In today's fast-paced and competitive business landscape, it is essential for investors and industry enthusiasts to thoroughly analyze companies before making investment decisions. In this article, we will conduct a comprehensive industry comparison, evaluating
Advanced Micro Devices Background
Advanced Micro Devices designs a variety of digital semiconductors for markets such as PCs, gaming consoles, data centers (including artificial intelligence), industrial, and automotive applications. AMD's traditional strength was in central processing units and graphics processing units used in PCs and data centers. However, AMD is emerging as a prominent player in AI GPUs and related hardware. Additionally, the firm supplies the chips found in prominent game consoles such as the Sony PlayStation and Microsoft Xbox.
| Advanced Micro Devices Inc | 109.96 | 5.62 | 10.71 | 2.06% | $2.11 | $4.78 | 35.59% |
| NVIDIA Corp | 46.81 | 38.66 | 24.84 | 29.14% | $38.75 | $41.85 | 62.49% |
| Taiwan Semiconductor Manufacturing Co Ltd | 33.14 | 10.42 | 14.35 | 9.44% | $691.11 | $588.54 | 30.31% |
| Broadcom Inc | 72.01 | 20.03 | 26.09 | 11.02% | $9.86 | $12.25 | 28.18% |
| Micron Technology Inc | 32.28 | 6.50 | 9.06 | 9.28% | $8.35 | $7.65 | 56.65% |
| Intel Corp | 710.50 | 1.91 | 3.51 | 3.98% | $7.85 | $5.22 | 2.78% |
| Qualcomm Inc | 35.97 | 9.10 | 4.50 | -12.88% | $3.51 | $6.24 | 10.03% |
| Texas Instruments Inc | 33.83 | 10.15 | 9.84 | 8.21% | $2.24 | $2.72 | 14.24% |
| Analog Devices Inc | 64.23 | 4.24 | 13.20 | 2.32% | $1.47 | $1.94 | 25.91% |
| ARM Holdings PLC | 148.31 | 16.57 | 27.95 | 3.3% | $0.22 | $1.11 | 34.48% |
| Marvell Technology Inc | 29.80 | 5.11 | 9.44 | 13.84% | $2.58 | $1.07 | 36.83% |
| NXP Semiconductors NV | 29.58 | 6 | 5.06 | 6.43% | $1.11 | $1.79 | -2.37% |
| Monolithic Power Systems Inc | 24.60 | 12.88 | 17.35 | 5.12% | $0.21 | $0.41 | 18.88% |
| ASE Technology Holding Co Ltd | 35.83 | 3.82 | 1.95 | 3.56% | $32.4 | $28.88 | 5.29% |
| First Solar Inc | 18.50 | 2.87 | 5.13 | 5.19% | $0.61 | $0.61 | 79.67% |
| ON Semiconductor Corp | 84.78 | 3.15 | 4.18 | 3.22% | $0.44 | $0.59 | -11.98% |
| STMicroelectronics NV | 49.79 | 1.44 | 2.28 | 1.33% | $0.31 | $1.06 | -1.97% |
| Credo Technology Group Holding Ltd | 121.55 | 19.80 | 33.83 | 7.99% | $0.09 | $0.18 | 272.08% |
| United Microelectronics Corp | 16.66 | 1.96 | 2.95 | 4.29% | $30.07 | $17.62 | -2.25% |
| Tower Semiconductor Ltd | 70.65 | 4.83 | 9.15 | 1.9% | $0.13 | $0.09 | 6.79% |
| Lattice Semiconductor Corp | 415.10 | 16.08 | 23.18 | 0.4% | $0.01 | $0.09 | 4.92% |
| Rambus Inc | 43.64 | 7.66 | 14.69 | 3.84% | $0.08 | $0.14 | 22.68% |
| Average | 100.84 | 9.68 | 12.5 | 5.76% | $39.59 | $34.29 | 33.03% |
After a detailed analysis of Advanced Micro Devices, the following trends become apparent:
-
The Price to Earnings ratio of
109.96for this company is1.09xabove the industry average, indicating a premium valuation associated with the stock. -
With a Price to Book ratio of
5.62, significantly falling below the industry average by0.58x, it suggests undervaluation and the possibility of untapped growth prospects. -
Based on its sales performance, the stock could be deemed undervalued with a Price to Sales ratio of
10.71, which is0.86xthe industry average. -
The Return on Equity (ROE) of
2.06%is3.7%below the industry average, suggesting potential inefficiency in utilizing equity to generate profits. -
The Earnings Before Interest, Taxes, Depreciation, and Amortization (EBITDA) of
$2.11 Billionis0.05xbelow the industry average, suggesting potential lower profitability or financial challenges. -
Compared to its industry, the company has lower gross profit of
$4.78 Billion, which indicates0.14xbelow the industry average, potentially indicating lower revenue after accounting for production costs. -
The company's revenue growth of
35.59%exceeds the industry average of33.03%, indicating strong sales performance and market outperformance.
Debt To Equity Ratio
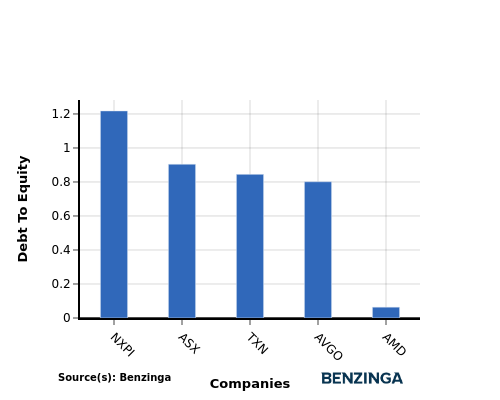
The debt-to-equity (D/E) ratio is a key indicator of a company's financial health and its reliance on debt financing.
Considering the debt-to-equity ratio in industry comparisons allows for a concise evaluation of a company's financial health and risk profile, aiding in informed decision-making.
In light of the Debt-to-Equity ratio, a comparison between Advanced Micro Devices and its top 4 peers reveals the following information:
-
Compared to its top 4 peers, Advanced Micro Devices has a stronger financial position indicated by its lower debt-to-equity ratio of
0.06. -
This suggests that the company relies less on debt financing and has a more favorable balance between debt and equity, which can be seen as a positive attribute by investors.
Key Takeaways
For Advanced Micro Devices, the PE ratio is high compared to peers, indicating potentially overvalued stock. The PB and PS ratios are low, suggesting undervaluation relative to industry competitors. In terms of ROE, EBITDA, gross profit, and revenue growth, Advanced Micro Devices lags behind its peers, indicating weaker financial performance and growth prospects within the Semiconductors & Semiconductor Equipment industry.
This article was generated by Benzinga's automated content engine and reviewed by an editor.
© 2026 Benzinga.com. Benzinga does not provide investment advice. All rights reserved.