
XRP price confirms bullish setup as ETF inflows spike, eyes 15% rally ahead

XRP price shot up over 12% on Tuesday as XRP ETFs saw a fresh surge in inflows. A confirmed bullish setup now hints that another 15% rally could be in the cards if the ongoing momentum holds.
- XRP price could be on the path to more upside as technicals remain bullish.
- XRP ETF inflows hit a 5-week high on Monday.
- A classic bullish reversal pattern was confirmed on the daily chart.
According to data from crypto.news, XRP rallied 12.5% in the past 24 hours to settle at $2.38 at the time of writing. This extends its gains to nearly 31% over the past week and follows a prolonged downtrend that brought the token down nearly 50% since mid-2025.
There are several catalysts that are supporting XRP’s upside today.
First, XRP price has benefited from renewed demand for XRP exchange-traded funds from American investors. SoSoValue data show that XRP ETFs logged $46.1 million in inflows on Monday, Jan. 5, their highest single-day inflows in nearly 5 weeks.
Higher XRP ETF inflows mean more capital used to buy underlying XRP, and tend to create upside pressure on the token.
Second, an uptick in open interest in XRP futures suggests that leveraged traders are re-entering the market with conviction. CoinGlass data shows that XRP futures OI has increased 21% in the past 24 hours to $4.65 billion.
When OI and price rise together, it signals new money entering the market rather than short covering or existing positions being closed, which in turn adds strong support to an asset’s bullish trend.
Third, Bitcoin, the bellwether crypto asset, briefly rebounded above $94k yesterday triggered a crypto market rebound and lifting overall market sentiment.
At press time, the Crypto Fear and Greed Index, which gauges market sentiment, has moved back into neutral territory from ‘extreme fear’ where it had been anchored since mid-December. Most high-cap cryptocurrencies, including XRP, tend to rally when this metric shows improvement.
XRP price analysis
On the daily chart, XRP price has confirmed a breakout from a falling wedge pattern that formed since the beginning of October 2025. Such a pattern is characterized by two descending and converging trendlines, which, upon a confirmed breakout, have historically been followed by strong upside, at least in the short term.
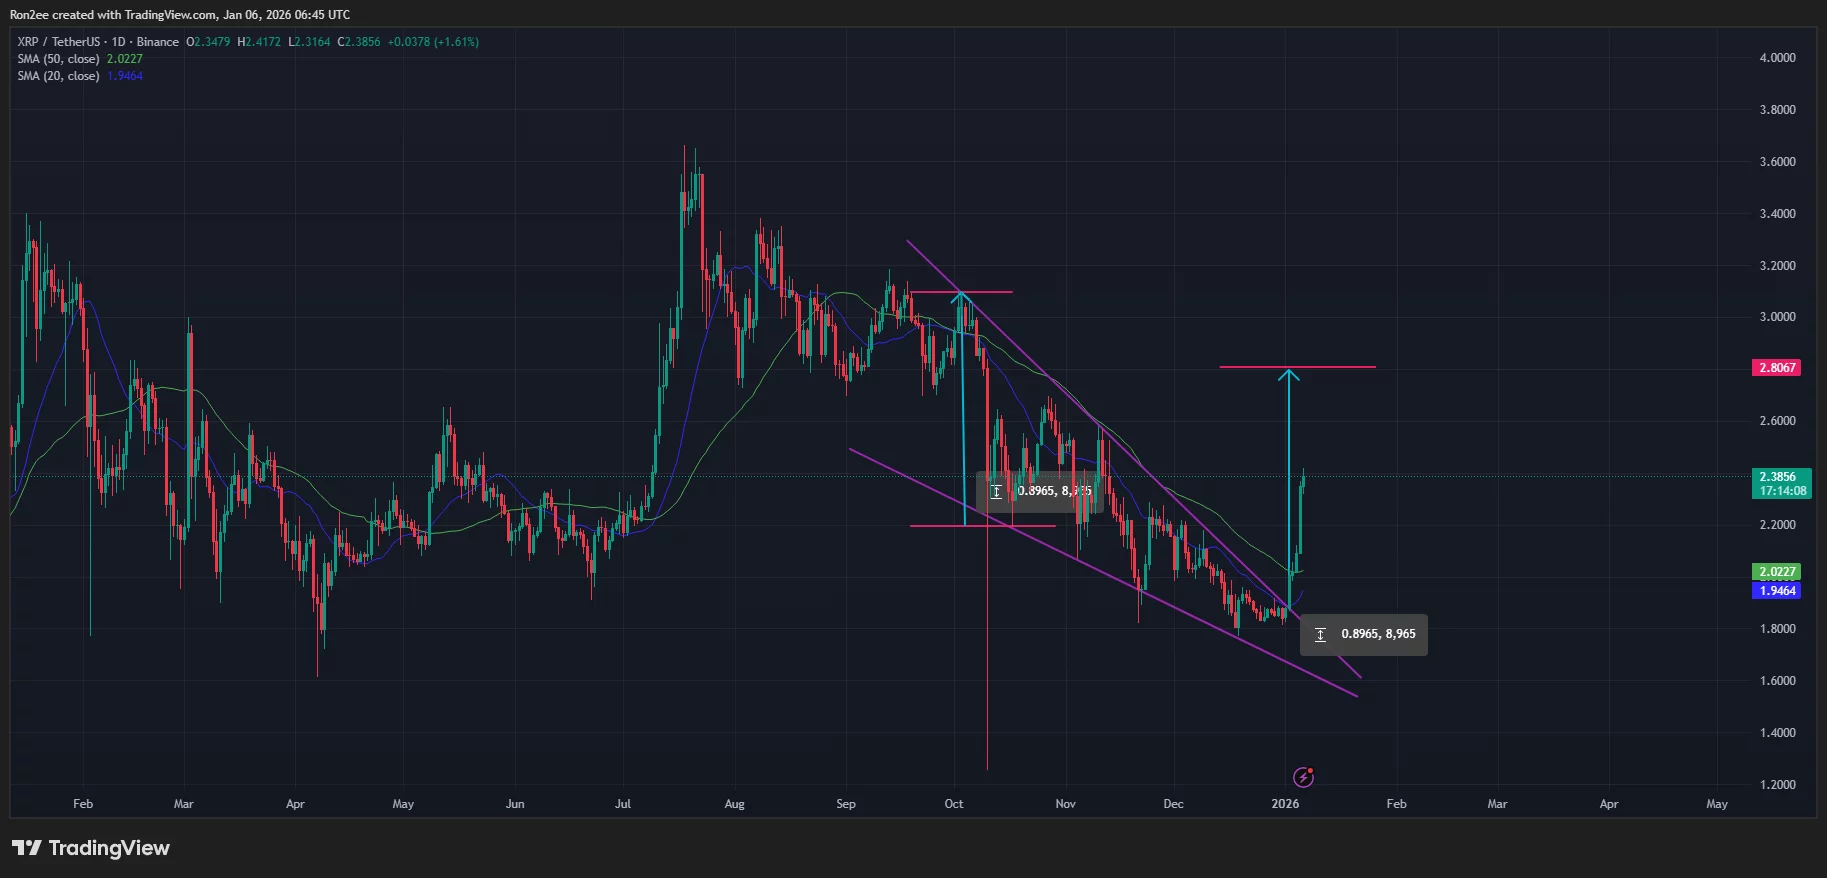 XRP price has confirmed a bullish reversal pattern on the daily chart — Jan. 6 | Source:
crypto.news
XRP price has confirmed a bullish reversal pattern on the daily chart — Jan. 6 | Source:
crypto.news
Looking at other technical indicators, they too present a bullish bias for the token. Notably, the 20-day simple moving average is eyeing a potential bullish crossover with the 50-day one, while the MACD lines have also pointed upwards.
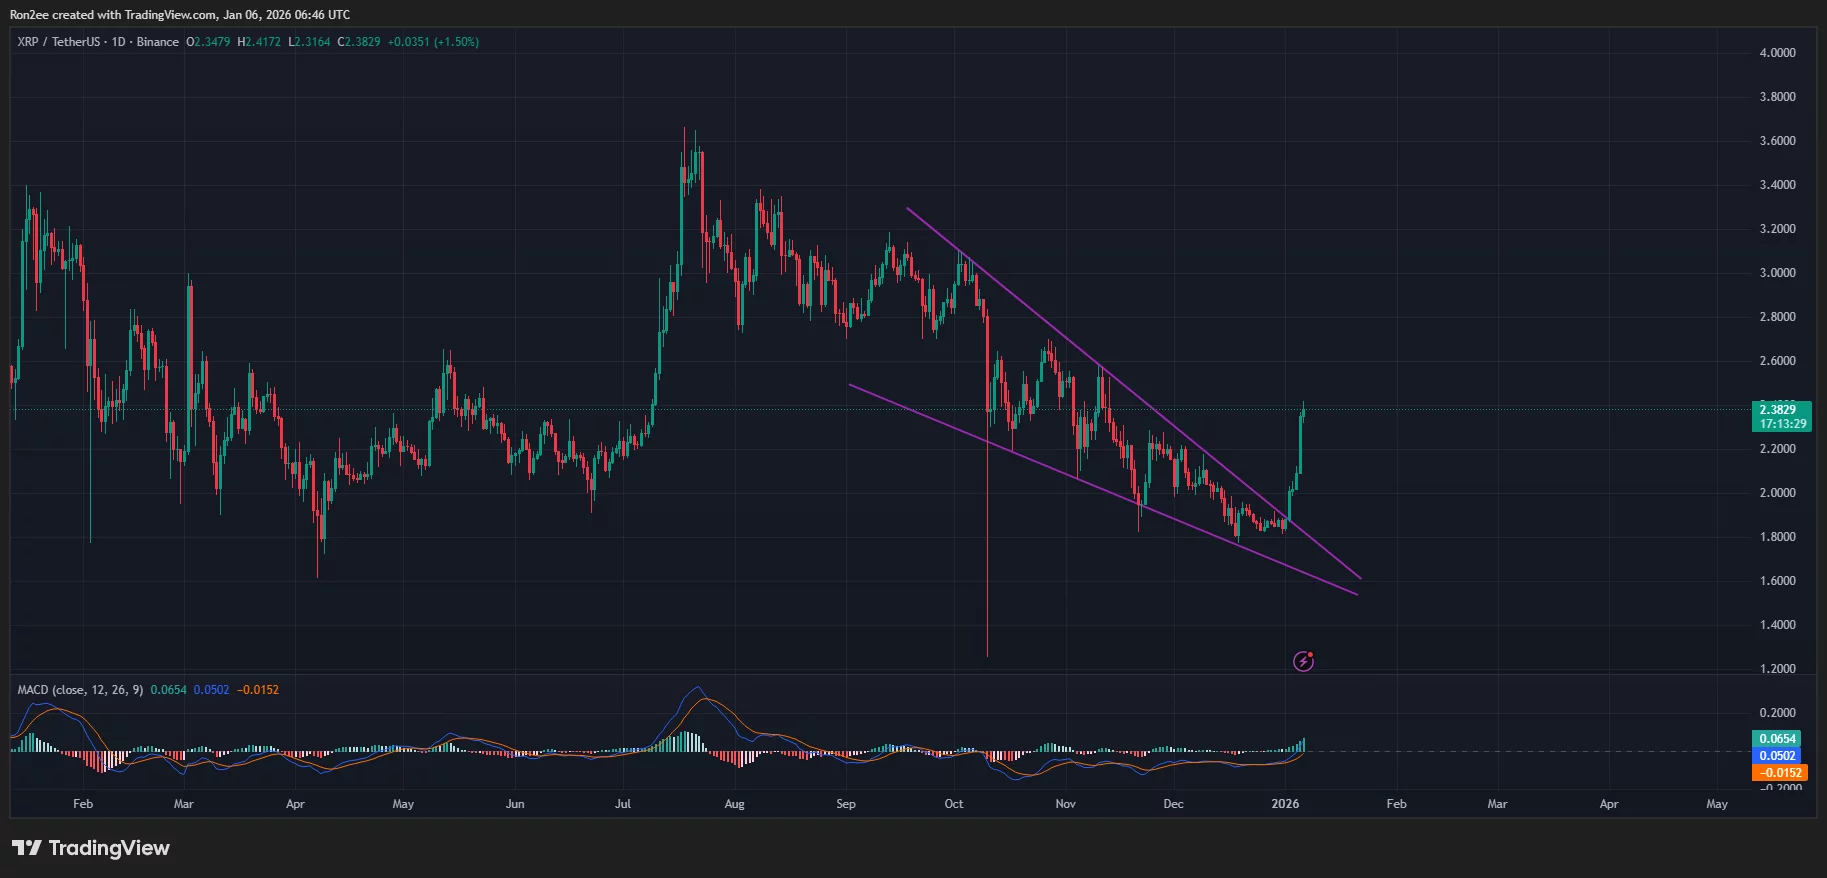 XRP price and MACD chart — Jan. 6 | Source:
crypto.news
XRP price and MACD chart — Jan. 6 | Source:
crypto.news
Based on all these factors, XRP price could most likely continue its ongoing rally as bulls push to meet $2.80, a target calculated by adding the height of the pattern formed to the point at which the breakout took place. As such, the target lies roughly 15% above the current price.
Disclaimer: The content of this article solely reflects the author's opinion and does not represent the platform in any capacity. This article is not intended to serve as a reference for making investment decisions.
You may also like
German manufacturing sector sees a 5.6% increase in new orders in November 2025 compared to the prior month
Salvo Games Taps BlockSec Arena to Fortify AI-Led Web3 Security
AP Top Financial News at 1:46 a.m. EST
The Big Players Gathered: Pay Attention to This Date for Cryptocurrencies