
USD/CAD Price Forecast: Hovers around 1.3700 below nine-day EMA

USD/CAD posts little losses, trading around 1.3700 during the European hours on Friday. The technical analysis of the daily chart shows an upside breakout above a bullish descending wedge pattern. The 14-day Relative Strength Index (RSI) at 35.12, below the midline, reflects weak momentum after an uptick from sub-30 readings.
The USD/CAD pair remains below the 50-day Exponential Moving Average (EMA) and marginally under the nine-day EMA, keeping bears in charge. Both averages slope lower, with the short-term line flattening near the spot price.
The USD/CAD pair reaches fresh five-month low of 1.3642 on December 26. Further declines would drag the pair within the wedge and put downward pressure on the pair to test the lower boundary of the descending wedge around 1.3550, followed by 1.3539, the lowest level since October 2024.
On the upside, the USD/CAD pair may test its immediate barrier at the nine-day EMA at 1.3715. A break above the short-term average would lead the pair to approach the 50-day EMA at 1.3848. Further advances above the medium-term average would improve the price momentum and support the pair to target the four-week high of 1.4014, reached on December 2.
(The technical analysis of this story was written with the help of an AI tool.)
Disclaimer: The content of this article solely reflects the author's opinion and does not represent the platform in any capacity. This article is not intended to serve as a reference for making investment decisions.
You may also like
Memecoin social buzz grows as traders return to risk assets

We Asked 4 AIs if Dogecoin (DOGE) Will Reach New ATH in 2026

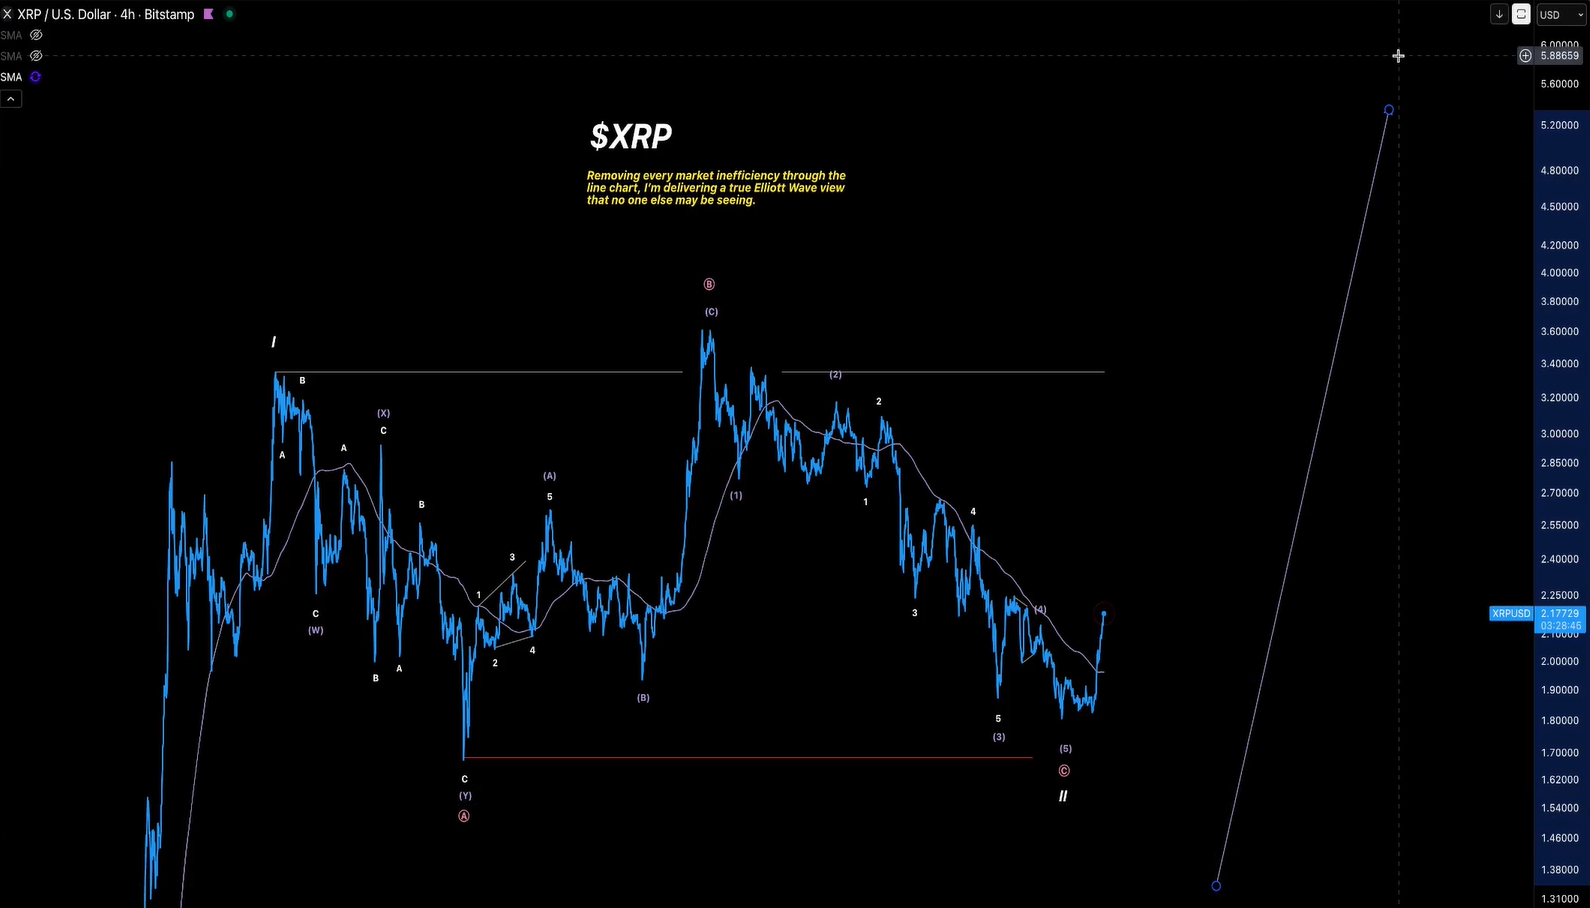
Elliott Wave Specialist Reveals Why an XRP Run to $20 Remains Possible
Ripple Acquires Another Company Indirectly After Spending $1 Billion