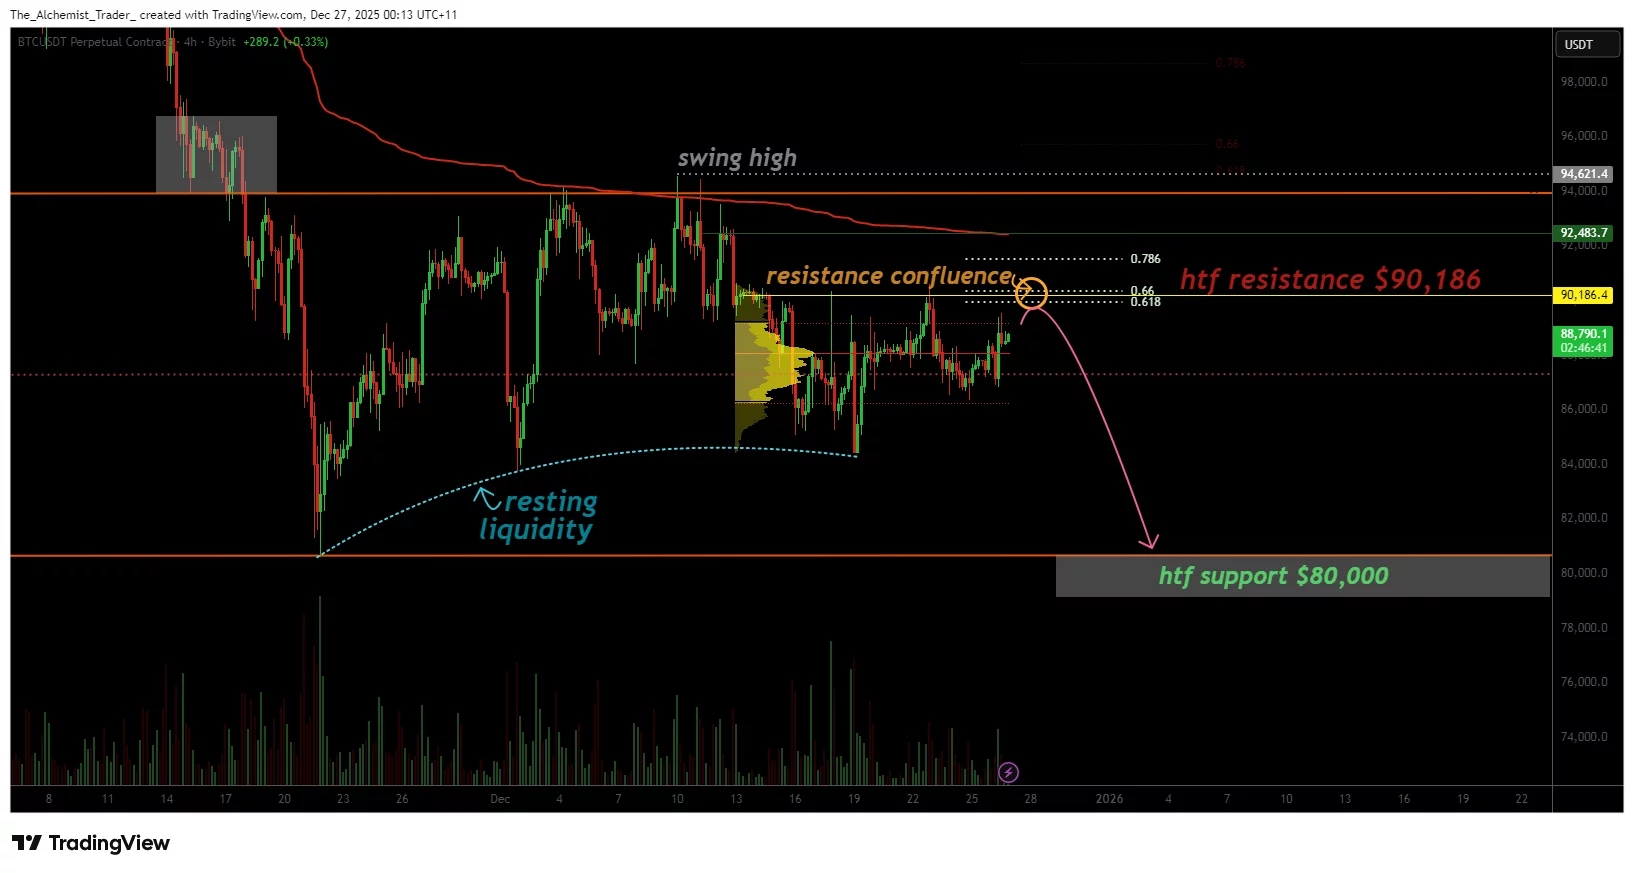
Recent data over the last five years reveals that Bitcoin’s price struggle significantly at the $70,000–$80,000 range. According to Investing.com, Bitcoin only spent 28 trading days within the $70,000–$79,999 band, while the $80,000–$89,999 zone saw activity for just 49 days. After an all-time high in October, Bitcoin hovered around the $80,000–$90,000 region throughout December, touching on areas previously unexplored in depth. Glassnode’s on-chain data further underscores this, suggesting possible consolidation signals due to low concentration in supply within this price range.
window.lazyLoadOptions=Object.assign({},{threshold:300},window.lazyLoadOptions||{});!function(t,e){"object"==typeof exports&&"undefined"!=typeof module?module.exports=e():"function"==typeof define&&define.amd?define(e):(t="undefined"!=typeof globalThis?globalThis:t||self).LazyLoad=e()}(this,function(){"use strict";function e(){return(e=Object.assign||function(t){for(var e=1;eCME Data Reveals Key Price Strengths
CME futures data indicates where Bitcoin’s price found stability in specific ranges, revealing significant gathering of positions. Notably, Bitcoin stayed in the $30,000–$39,999 and $40,000–$49,999 zones for nearly 200 trading days each, establishing strong price memories. A similar pattern emerged for the $50,000–$70,000 range, intensifying throughout 2024 with significant consolidation activity observed in these bands.
Conversely, the $70,000–$79,999 range emerged as one of the least engaged regions in the past five years, attracting minimal trading days, and offering limited opportunities for position establishment by market participants. Excluding brief ventures above $120,000, the $70,000–$80,000 band distinctly stands out as the weakest price zone.
Blockchain Distribution Affirms Absence of Support
Glassnode’s UTXO Realized Price Distribution (URPD) tool accentuates at what prices the current Bitcoin supply changed hands, employing entity-adjusted methods to collate each investor’s balance at an average cost into a singular focal point. This effectively highlights where the bulk of supply is truly concentrated.
The URPD indicates limited supply clustering in the $70,000–$80,000 band, aligning with brief consolidation phases found in futures data. In regions with sparse supply, prices tend to be more volatile. If the market spends more time in these zones, structural support might potentially strengthen.