
XRP Price Falls To Critical Support Level, Is It Time To Panic?

By:Newsbtc
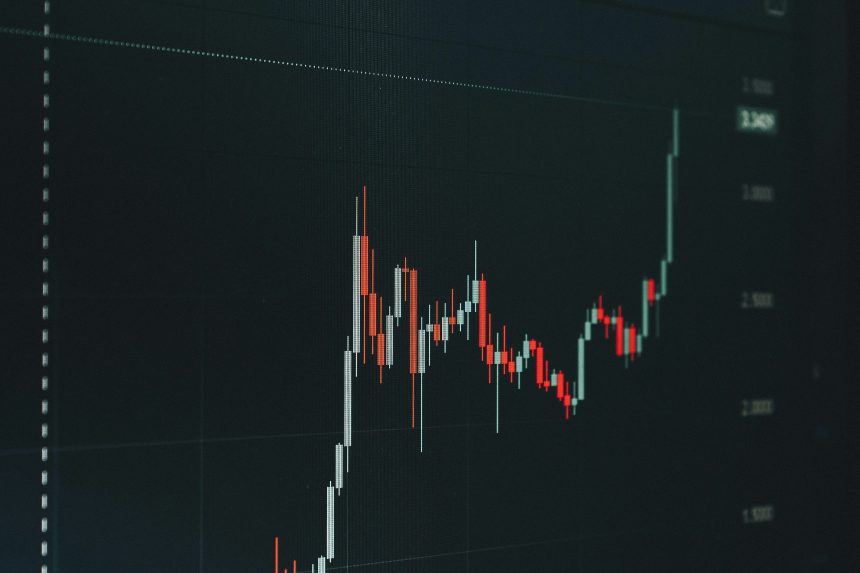
XRP now finds itself trading around the $1.90 region due to an extensive pullback in the past 30 days. The question is now whether this pullback is a structural weakness or a necessary reset within a larger bullish structure.
A technical analysis shared by crypto analyst Tara focuses on this exact moment, highlighting why the current level could be far more important than it looks on the surface.
XRP Tests A Macro Fib Support Zone Around $1.88
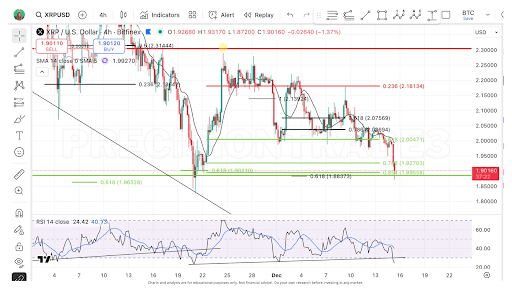
XRP’s price action in the past 24 hours saw it declining to an intraday low of $1.88, according to data from CoinGecko. However, technical analysis shows that this move has pushed the price action to a major macro support level around $1.88, which is defined by an important macro 0.5 Fib retracement on higher-timeframe charts. This zone has previously acted as a pivot, just like the bounce on November 21, which pushed the XRP price back to $2.26 within 48 hours.
var rnd = window.rnd || Math.floor(Math.random()*10e6); var pid607465 = window.pid607465 || rnd; var plc607465 = window.plc607465 || 0; var abkw = window.abkw || ''; var absrc = 'https://servedbyadbutler.com/adserve/;ID=172179;size=0x0;setID=607465;type=js;sw='+screen.width+';sh='+screen.height+';spr='+window.devicePixelRatio+';kw='+abkw+';pid='+pid607465+';place='+(plc607465++)+';rnd='+rnd+';click=CLICK_MACRO_PLACEHOLDER'; document.write('
');
if (!window.AdButler){(function(){var s = document.createElement("script"); s.async = true; s.type = "text/javascript";s.src = "https://servedbyadbutler.com/app.js";var n = document.getElementsByTagName("script")[0]; n.parentNode.insertBefore(s, n);}());}
var AdButler = AdButler || {}; AdButler.ads = AdButler.ads || []; var abkw = window.abkw || ""; var plc366606 = window.plc366606 || 0; (function(){ var divs = document.querySelectorAll(".plc366606:not([id])"); var div = divs[divs.length-1]; div.id = "placement_366606_"+plc366606; AdButler.ads.push({handler: function(opt){ AdButler.register(172179, 366606, [728,90], "placement_366606_"+opt.place, opt); }, opt: { place: plc366606++, keywords: abkw, domain: "servedbyadbutler.com", click:"CLICK_MACRO_PLACEHOLDER" }}); })();
The chart included in the analysis, which is shown below, illustrates multiple Fibonacci confluences clustered between roughly $1.88 and $1.86, and this further adds to the idea that this region is structurally significant rather than arbitrary. From a price-action perspective, XRP’s current pullback has been orderly, with no sharp breakdowns below this support as of now, and sellers may be losing momentum as price compresses into this level.
What A Bounce Or Breakdown Could Mean From Here
Tara noted that moments like this tend to feel the scariest for traders, precisely because the price is sitting on support rather than moving away from it. These are the points where sentiment is weakest, and fear is most visible, even though risk-reward technically improves.
 Source:
Chart from Tara on X
Source:
Chart from Tara on X
Therefore, retesting support is not inherently bearish. Instead, repeated support tests can absorb selling pressure and create the conditions for a stronger bounce.
var rnd = window.rnd || Math.floor(Math.random()*10e6); var pid607472 = window.pid607472 || rnd; var plc607472 = window.plc607472 || 0; var abkw = window.abkw || ''; var absrc = 'https://servedbyadbutler.com/adserve/;ID=172179;size=0x0;setID=607472;type=js;sw='+screen.width+';sh='+screen.height+';spr='+window.devicePixelRatio+';kw='+abkw+';pid='+pid607472+';place='+(plc607472++)+';rnd='+rnd+';click=CLICK_MACRO_PLACEHOLDER'; document.write('
');
if (!window.AdButler){(function(){var s = document.createElement("script"); s.async = true; s.type = "text/javascript";s.src = "https://servedbyadbutler.com/app.js";var n = document.getElementsByTagName("script")[0]; n.parentNode.insertBefore(s, n);}());}
var AdButler = AdButler || {}; AdButler.ads = AdButler.ads || []; var abkw = window.abkw || ""; var plc452518 = window.plc452518 || 0; (function(){ var divs = document.querySelectorAll(".plc452518:not([id])"); var div = divs[divs.length-1]; div.id = "placement_452518_"+plc452518; AdButler.ads.push({handler: function(opt){ AdButler.register(172179, 452518, [728,90], "placement_452518_"+opt.place, opt); }, opt: { place: plc452518++, keywords: abkw, domain: "servedbyadbutler.com", click:"CLICK_MACRO_PLACEHOLDER" }}); })();
The most important takeaway from the analysis is not that XRP must rally immediately, but that the reaction at this level matters more than the level itself. If XRP holds above the $1.88 price level and avoids printing a decisive new low, the structure would favor a bullish continuation.
In this case, the upside targets will be between $2.18 and $2.20. From here, any bullish follow-through could carry XRP to $2.31. These are all midterm price targets that can be achieved before the end of the year.

XRP Price Needs To Hold This Macro Support For Hope Of Revival
Momentum indicators, including the RSI, are already in oversold territory on the 4-hour candlestick chart. This indicator adds to the possibility of a clean bounce for XRP from the strong support around $1.88. At the time of writing, XRP is trading at $1.90 and is already showing signs of holding above $1.88.
var rnd = window.rnd || Math.floor(Math.random()*10e6); var pid607473 = window.pid607473 || rnd; var plc607473 = window.plc607473 || 0; var abkw = window.abkw || ''; var absrc = 'https://servedbyadbutler.com/adserve/;ID=172179;size=0x0;setID=607473;type=js;sw='+screen.width+';sh='+screen.height+';spr='+window.devicePixelRatio+';kw='+abkw+';pid='+pid607473+';place='+(plc607473++)+';rnd='+rnd+';click=CLICK_MACRO_PLACEHOLDER'; document.write('
');
if (!window.AdButler){(function(){var s = document.createElement("script"); s.async = true; s.type = "text/javascript";s.src = 'https://servedbyadbutler.com/app.js';var n = document.getElementsByTagName("script")[0]; n.parentNode.insertBefore(s, n);}());}
var AdButler = AdButler || {}; AdButler.ads = AdButler.ads || []; var abkw = window.abkw || ''; var plc452519 = window.plc452519 || 0; (function(){ var divs = document.querySelectorAll(".plc452519:not([id])"); var div = divs[divs.length-1]; div.id = "placement_452519_"+plc452519; AdButler.ads.push({handler: function(opt){ AdButler.register(172179, 452519, [728,90], 'placement_452519_'+opt.place, opt); }, opt: { place: plc452519++, keywords: abkw, domain: 'servedbyadbutler.com', click:'CLICK_MACRO_PLACEHOLDER' }}); })();
On the other hand, a breakdown below $1.90 to $1.80 would invalidate the current bullish setup and redirect attention to lower retracement areas.
 XRP trading at $1.90 on the 1D chart | Source: XRPUSDT on
Tradingview.com
XRP trading at $1.90 on the 1D chart | Source: XRPUSDT on
Tradingview.com
0
0
Disclaimer: The content of this article solely reflects the author's opinion and does not represent the platform in any capacity. This article is not intended to serve as a reference for making investment decisions.
PoolX: Earn new token airdrops
Lock your assets and earn 10%+ APR
Lock now!
You may also like
UK Crypto Ownership Takes Biggest Hit Since 2021, Regulator Says
Newsbtc•2025/12/17 22:06

Jared Isaacman confirmed as next head of NASA
TechCrunch•2025/12/17 22:03
DWF Ventures Highlights Overall Crypto Market Movements of 2025 post-153197 post-153197 post-153197
Newscrypto•2025/12/17 21:36
Trending news
MoreCrypto prices
MoreBitcoin
BTC
$86,188.35
-1.75%
Ethereum
ETH
$2,827.77
-4.13%
Tether USDt
USDT
$0.9996
-0.02%
BNB
BNB
$842
-3.55%
XRP
XRP
$1.86
-3.17%
USDC
USDC
$0.9999
-0.00%
Solana
SOL
$123.06
-4.14%
TRON
TRX
$0.2793
-0.45%
Dogecoin
DOGE
$0.1263
-4.16%
Cardano
ADA
$0.3673
-4.71%
How to buy BTC
Bitget lists BTC – Buy or sell BTC quickly on Bitget!
Trade now
Become a trader now?A welcome pack worth 6200 USDT for new users!
Sign up now