Bitcoin Loses Whale Support? Yet History Shows the Price Can Still Rise

Bitcoin price is trading near $89,700, almost flat on the day and down roughly 2% over the past week. On the surface, price action looks weak. Under the hood, something more interesting is happening. Large Bitcoin holders are quietly stepping back. Whale support is fading, with on-chain data showing sustained distribution over the past few
Bitcoin price is trading near $89,700, almost flat on the day and down roughly 2% over the past week. On the surface, price action looks weak. Under the hood, something more interesting is happening.
Large Bitcoin holders are quietly stepping back. Whale support is fading, with on-chain data showing sustained distribution over the past few weeks. Yet despite this, Bitcoin has failed to break down. That resilience matters because a separate on-chain signal now suggests selling pressure may be running out, despite the whale indifference.
Whales Are Selling, but Overall Pressure May Be Nearing Exhaustion
Bitcoin’s whale address data shows clear weakness. The 30-day change in whale addresses holding 1,000–10,000 BTC has dropped to −72, its lowest level since late November. The total whale count is also sitting near monthly lows. This confirms that large holders have been reducing exposure rather than accumulating.
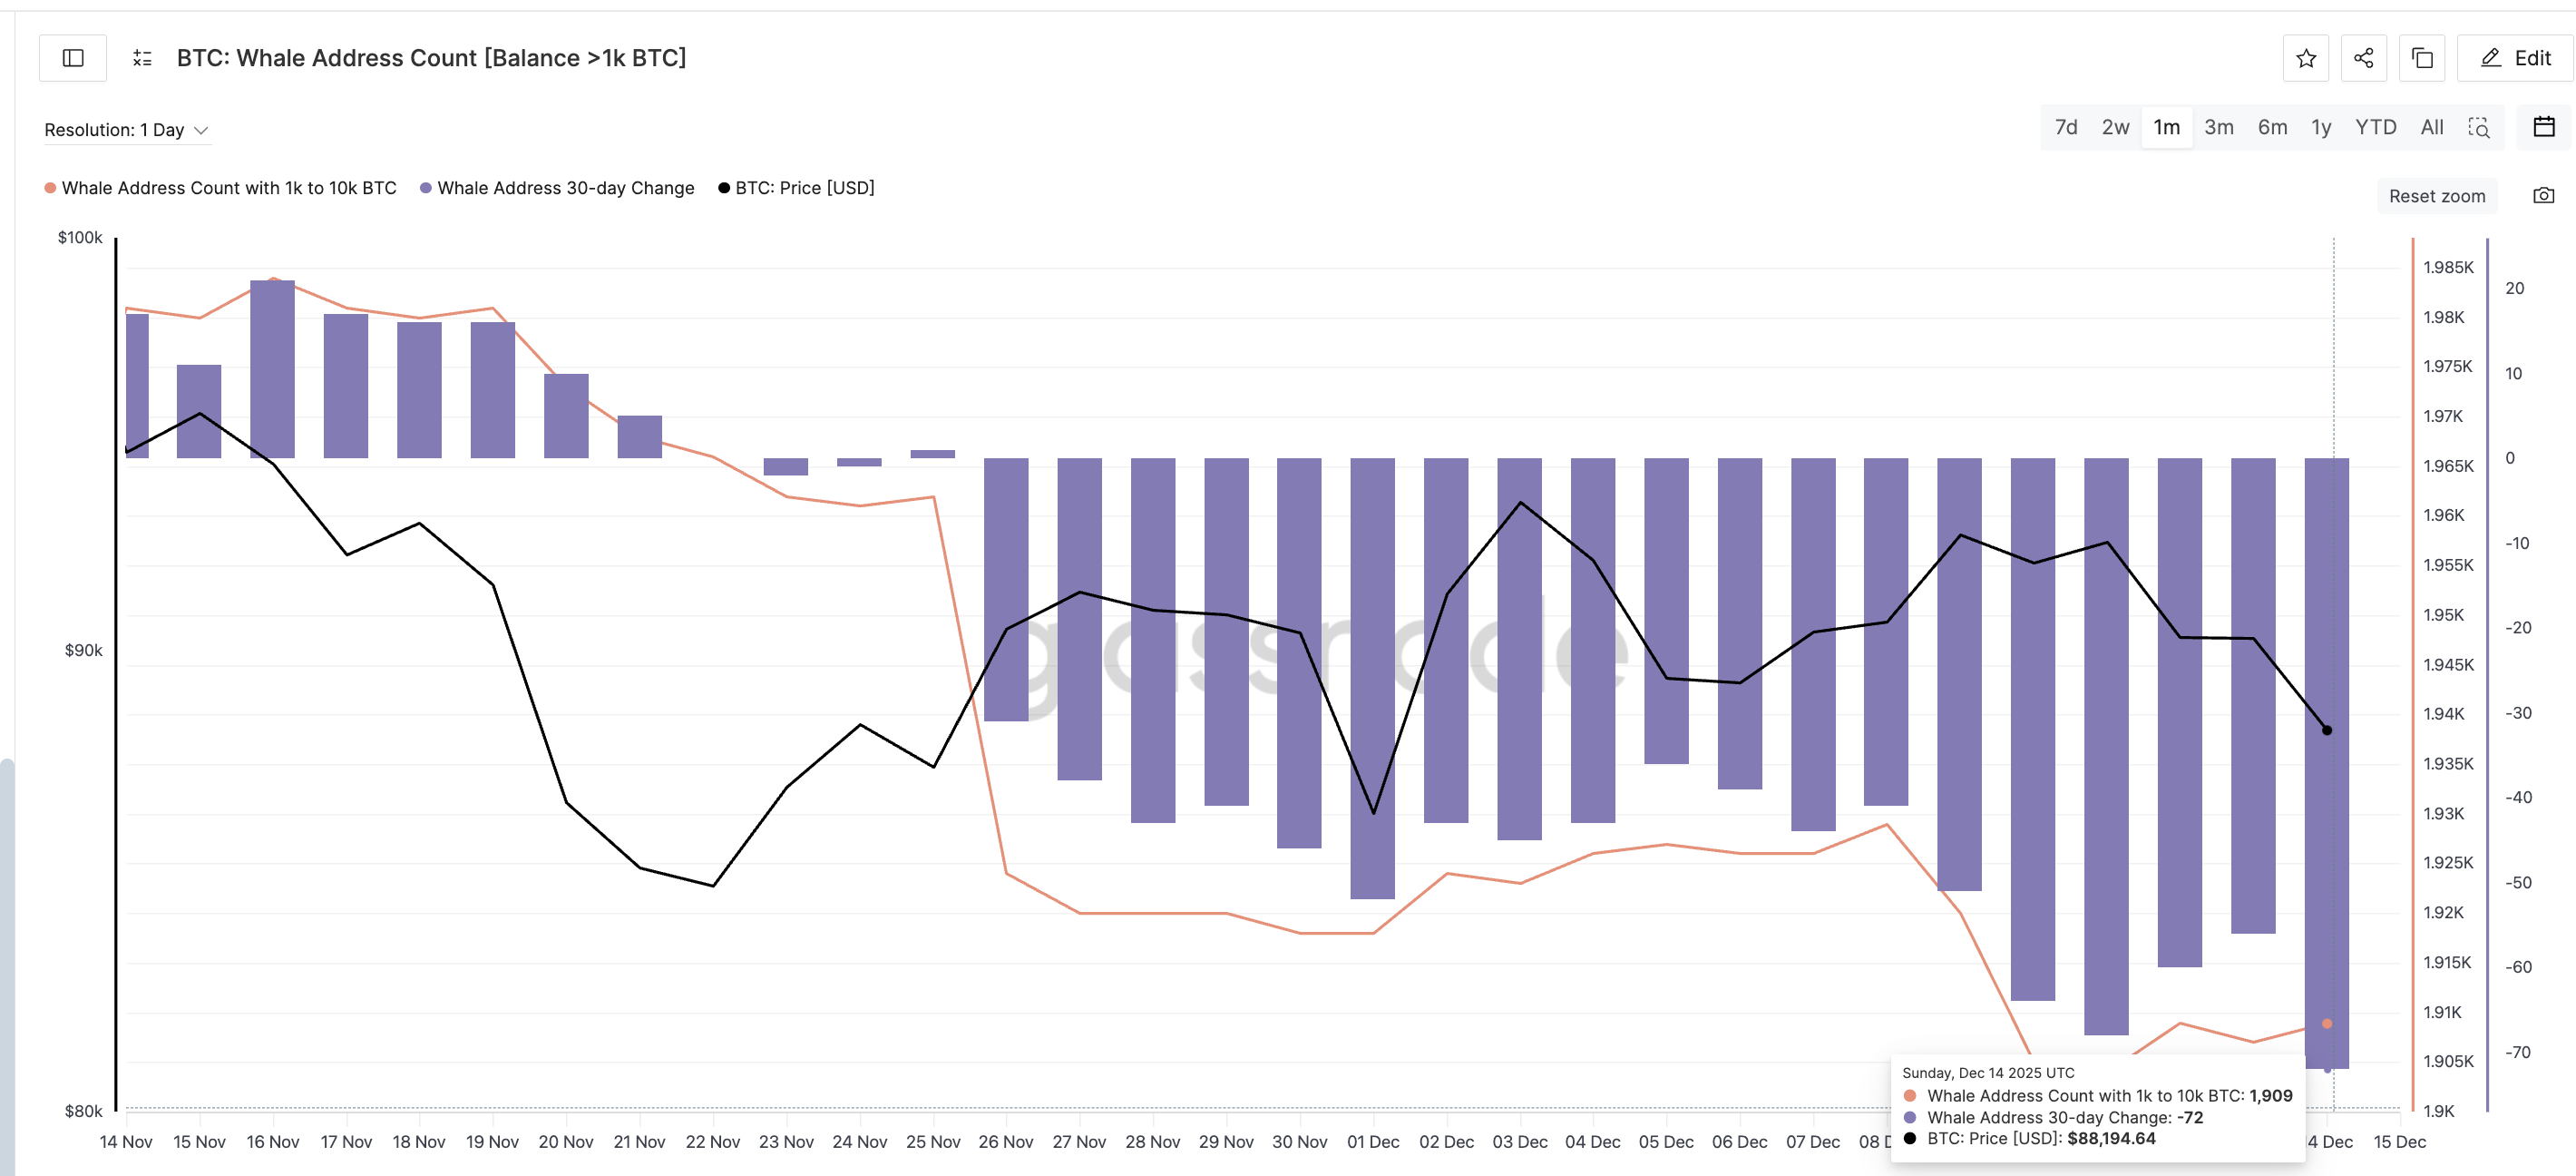 Whales Reducing Positions:
Glassnode
Whales Reducing Positions:
Glassnode
Do note that these whales are mostly rotating into ETH, which shows more optimism for the second-largest crypto.
🚨 WHALE ROTATION ACCELERATESA large whale just swapped:🔹 502.8 $BTC → 14,500 $ETH🔹 ~$45.24MThis wasn’t a one-off.The same wallet has now converted:🔹 1,969 $BTC🔹 into 58,149 $ETHThat’s not panic selling.That’s capital rotation.When whales rotate,they’re… pic.twitter.com/59goN9BeKb
— BMNR Bullz (@BMNRBullz) December 15, 2025
Normally, that kind of behavior leads to deeper pullbacks. This time, it hasn’t.
One reason may be the Bitcoin Seller Exhaustion Constant, a Glassnode metric that combines loss-taking behavior with price volatility. It highlights periods where many sellers are underwater, but volatility stays low. Historically, this combination appears near low-risk local BTC price bottoms.
The metric currently sits near 0.019, a level last seen around April 5, when Bitcoin traded near $83,500. Over the following six weeks, the price rallied more than 33%, peaking near $111,600. Today’s reading is slightly lower, placing it firmly within the same historical exhaustion zone.
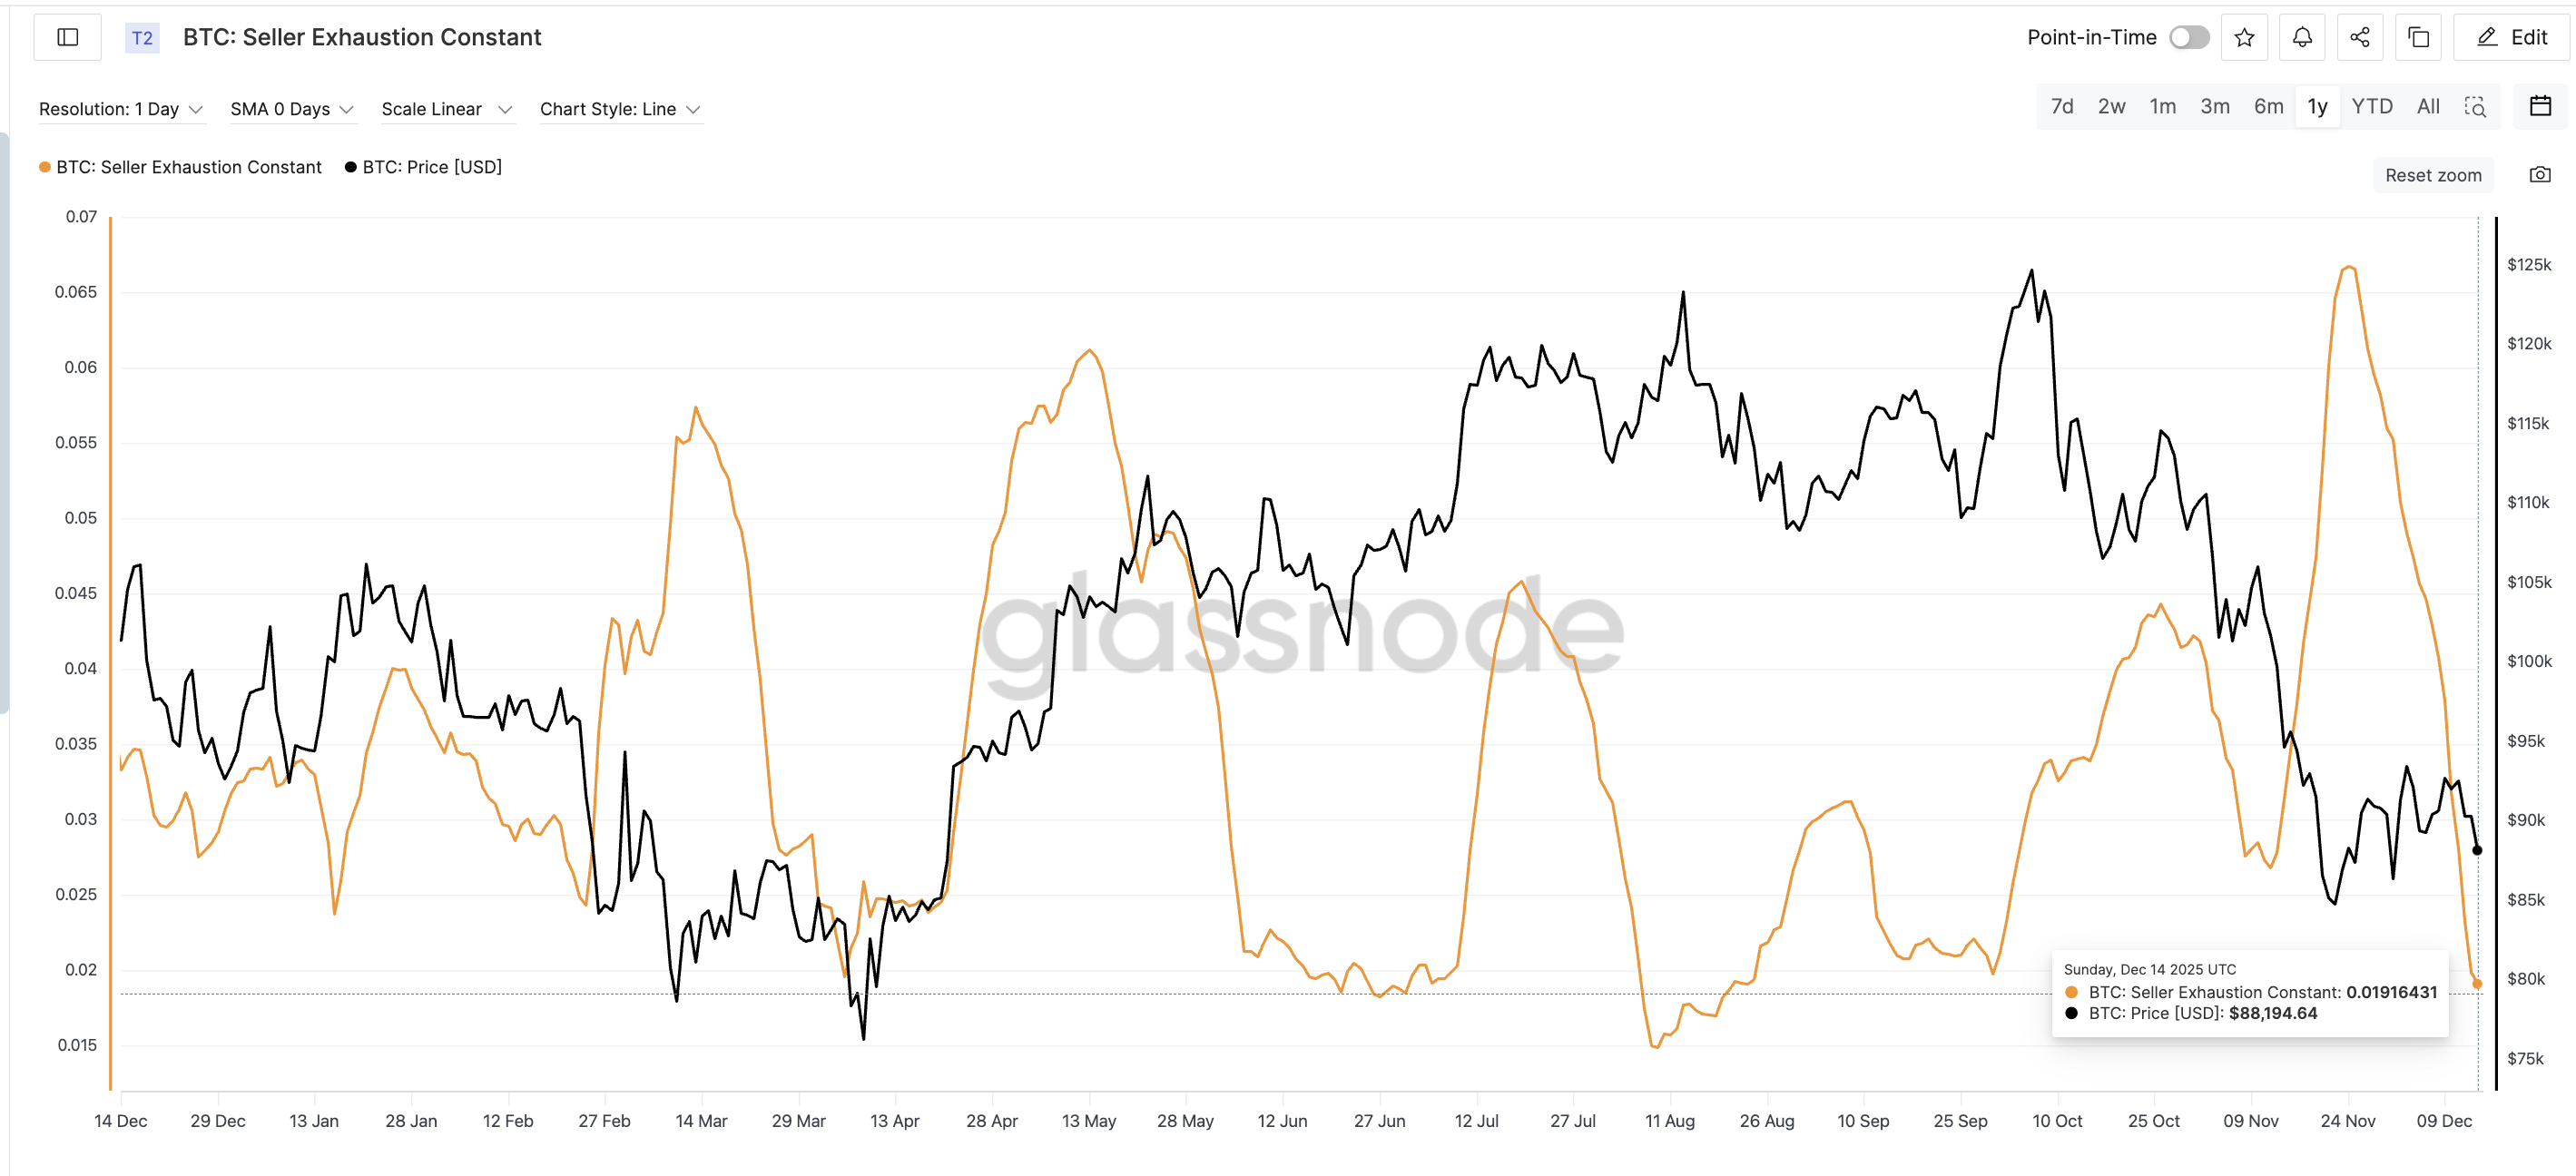 BTC Sellers Might Be Getting Tired:
Glassnode
BTC Sellers Might Be Getting Tired:
Glassnode
This does not guarantee a rally. It does suggest that downside risk is shrinking.
Bitcoin Price Levels That Decide the Next Move
Despite whale selling, Bitcoin continues to hold above $89,250, a key support zone. As long as this level holds on daily closes, bears struggle to gain control.
If Bitcoin reclaims $91,320, momentum improves quickly. That opens the door to $94,660, where the prior supply sits. A clean break there would shift market structure back in favor of bulls.
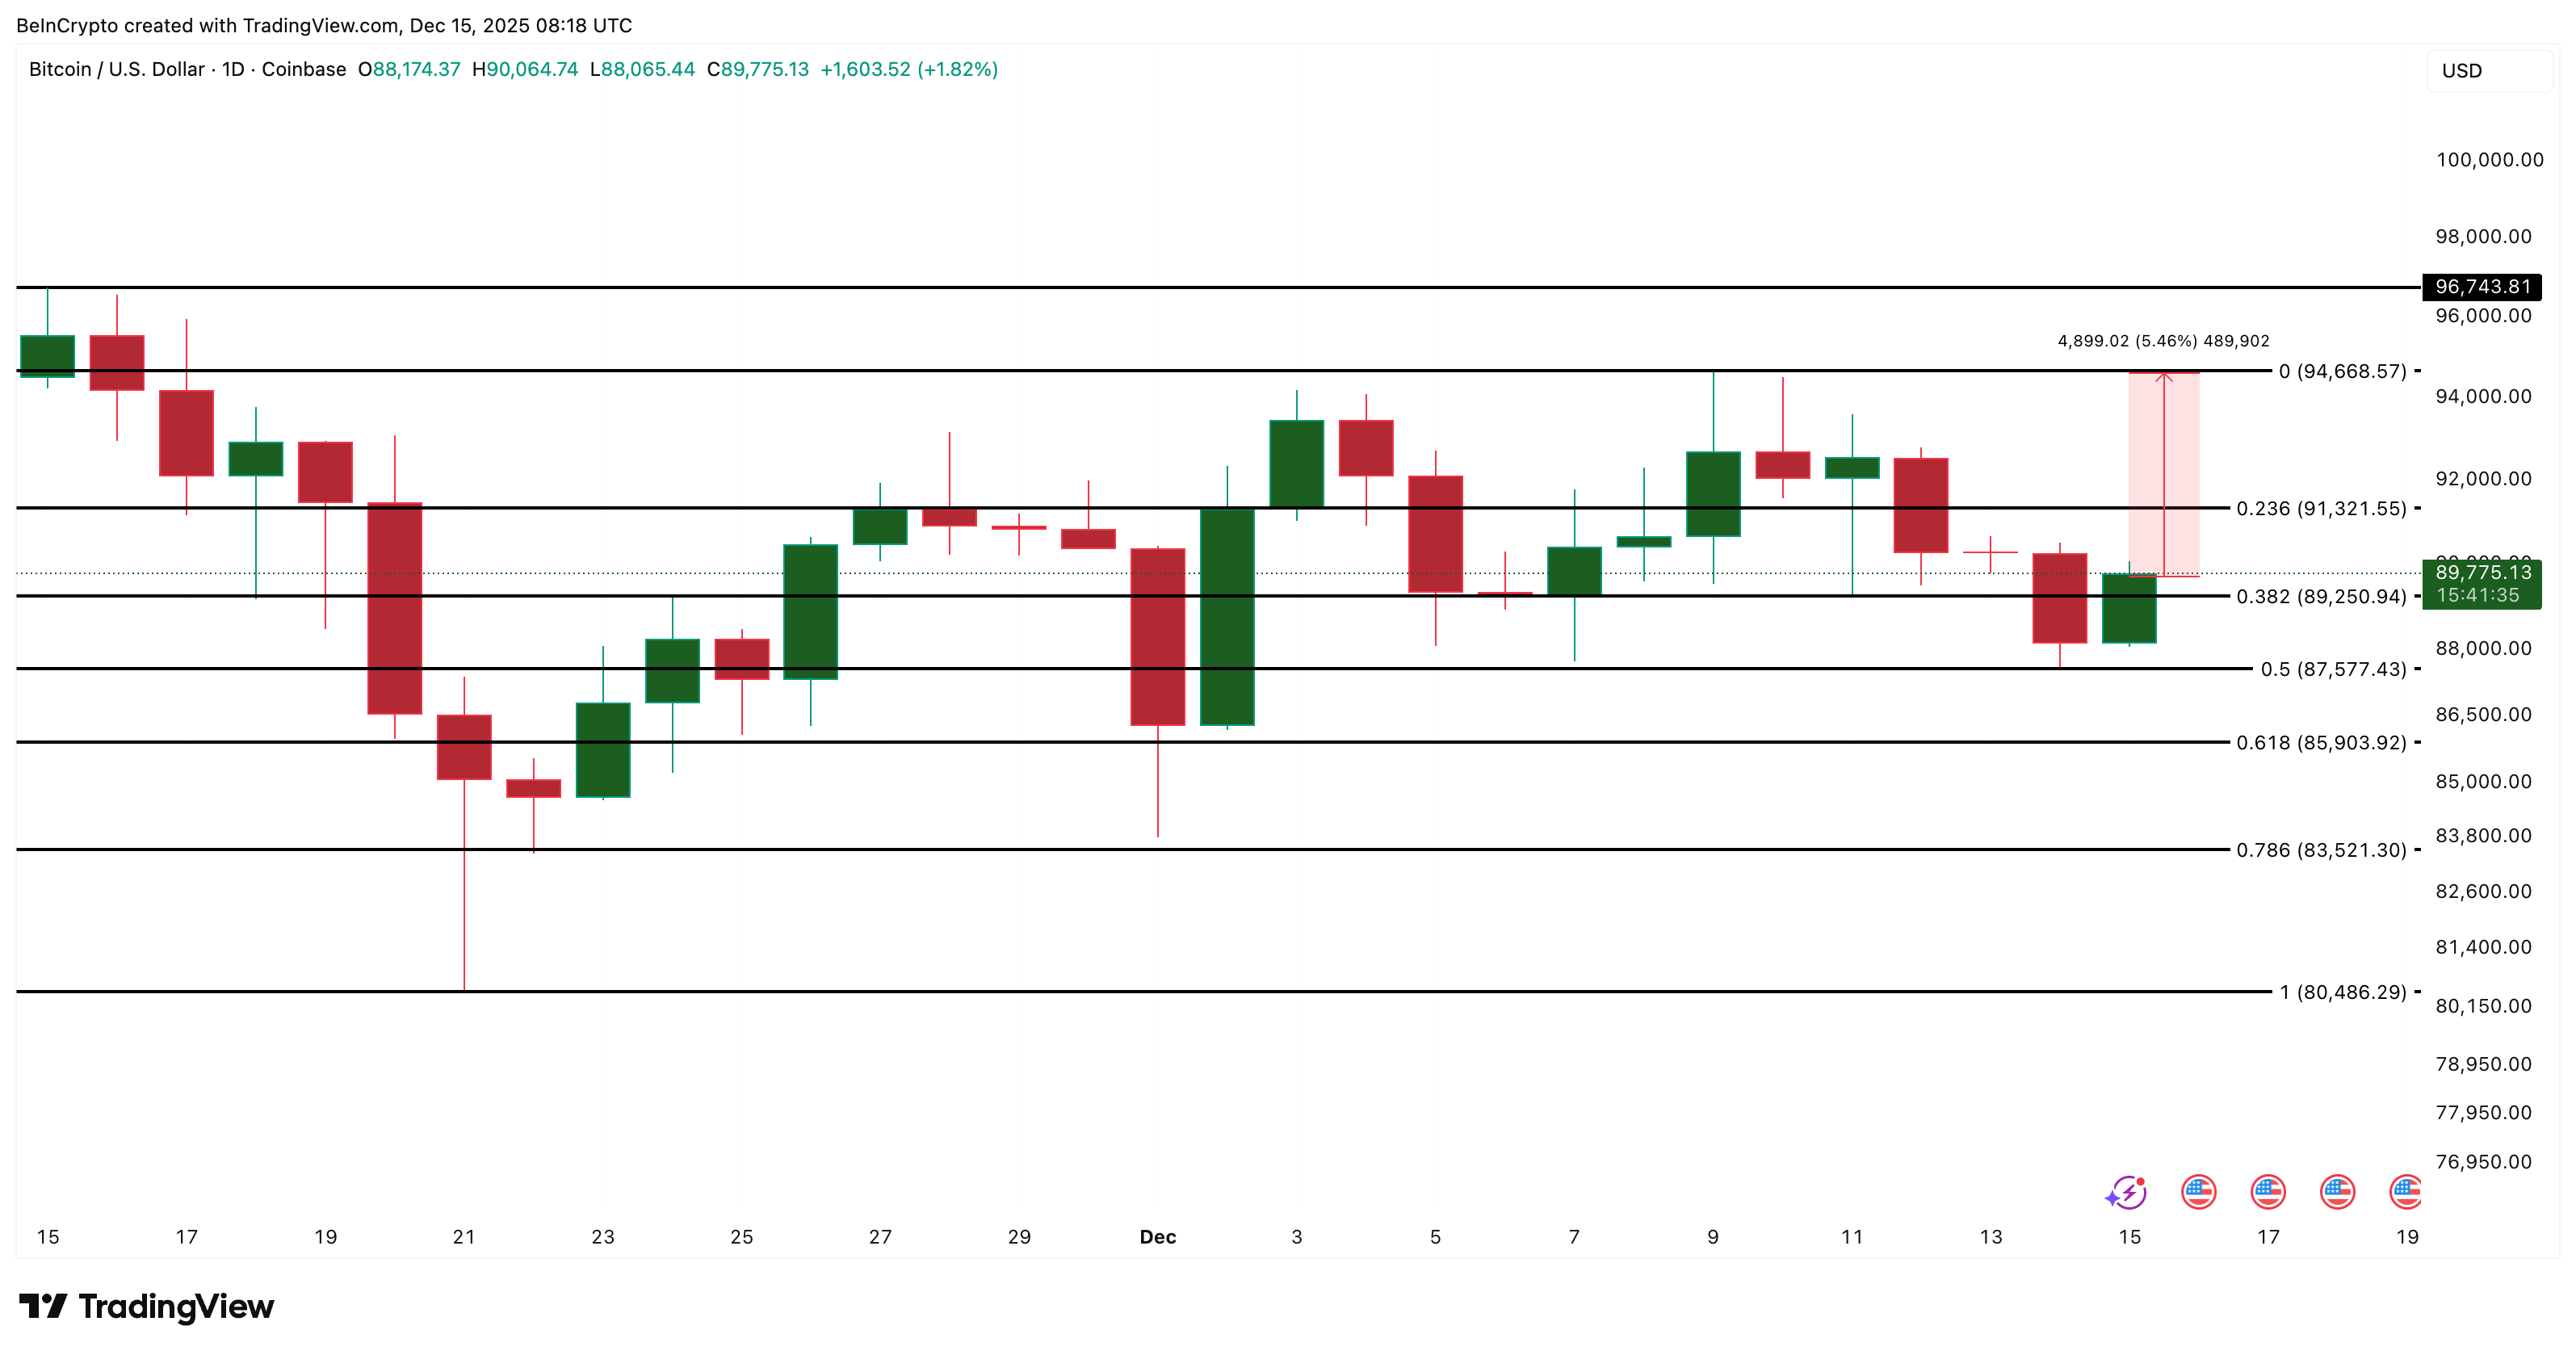 Bitcoin Price Analysis:
TradingView
Bitcoin Price Analysis:
TradingView
The invalidation is clear. A daily close below $89,250 weakens the exhaustion thesis and exposes downside toward $87,570 and $85,900.
Disclaimer: The content of this article solely reflects the author's opinion and does not represent the platform in any capacity. This article is not intended to serve as a reference for making investment decisions.
You may also like
The Inference Paradox and How AI’s Real Value Is Being Wasted on Oversized GPUs
BlockchainFX XMAS50 Bonus: Is This Presale the Top Crypto with 1000x Potential Above Sky and Canton Network?