Pi Coin Price Faces Doomsday Risk After Pattern Break — Here’s How It Can Recover?

Pi Coin price had a steady run in November when most large tokens struggled. But the tone changed this week. The token is down almost 10% over the past seven days and more than 4% in the last 24 hours. The move under a key level confirmed a clear pattern break on the daily chart,
Pi Coin price had a steady run in November when most large tokens struggled. But the tone changed this week. The token is down almost 10% over the past seven days and more than 4% in the last 24 hours. The move under a key level confirmed a clear pattern break on the daily chart, which many traders might link with “doomsday” risk because it can push the price toward a new all-time low if selling continues.
The main question now is whether the chart can recover this time.
Pattern Breakdown Opens the Path to a New Low
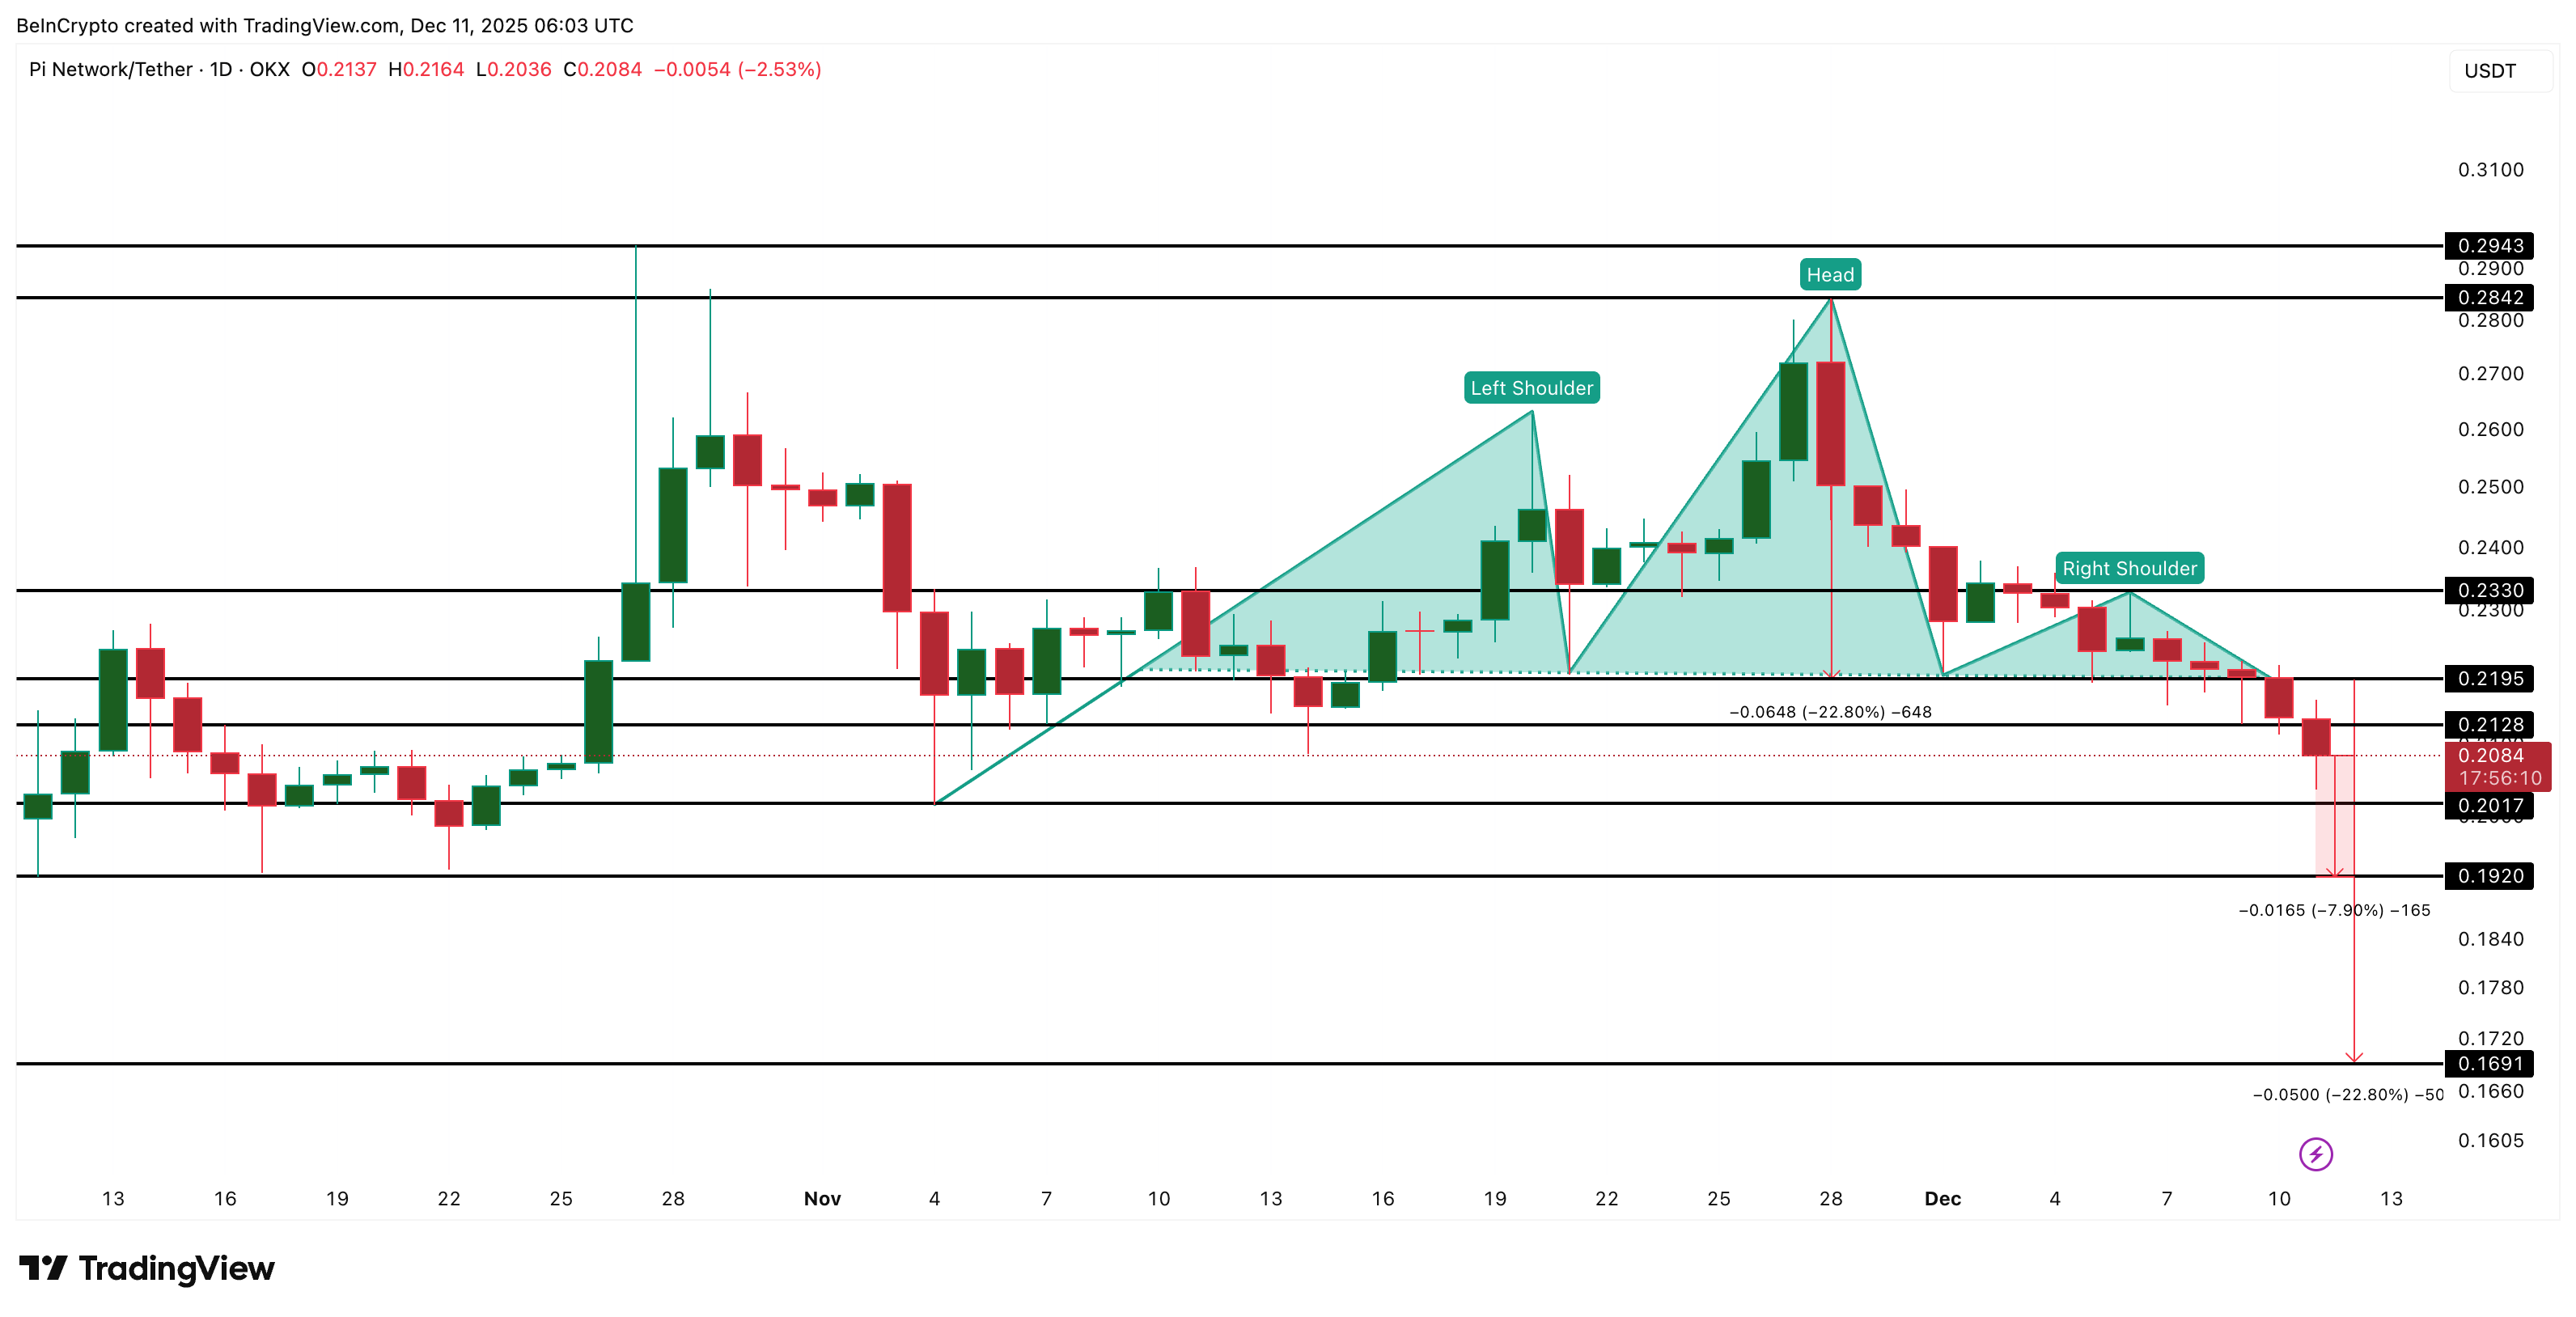
Pi Coin dropped below the neckline near $0.219, completing a standard head and shoulders pattern, signifying a possible bearish reversal.
The usual downside projection comes from the gap between the neckline and the head. That projection suggests a possible fall of about 22.8%, placing Pi Coin near $0.169.
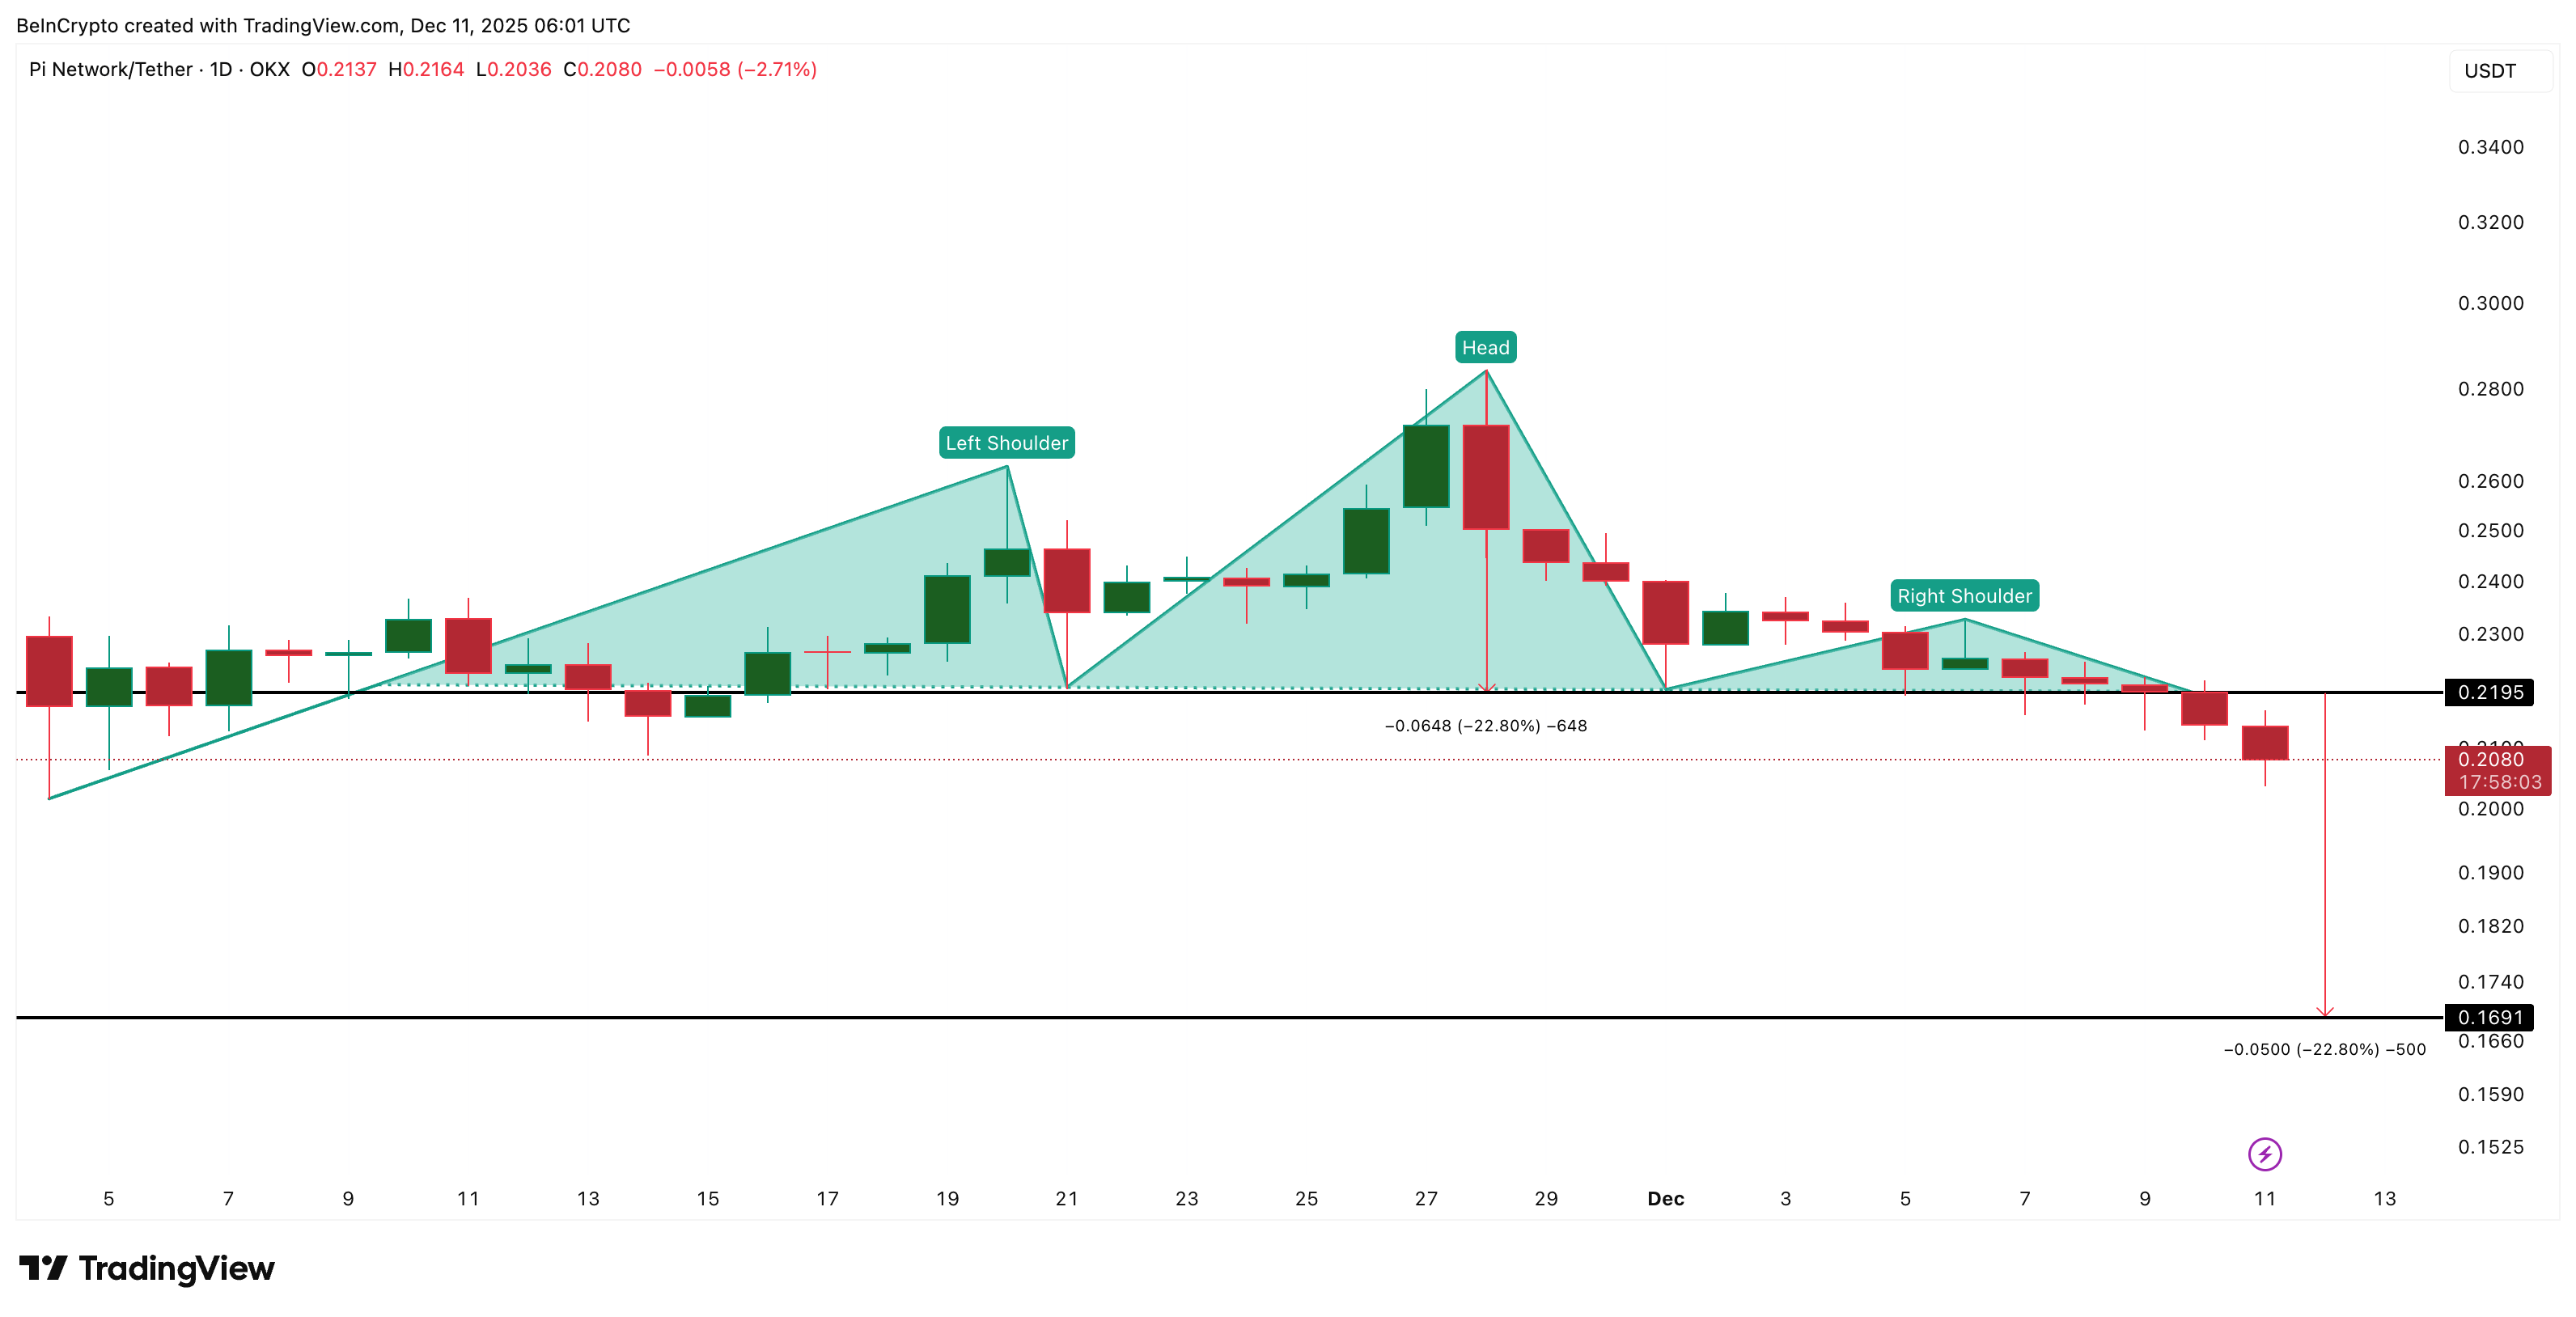 PI Price Risk:
TradingView
PI Price Risk:
TradingView
Want more token insights like this? Sign up for Editor Harsh Notariya’s Daily Crypto Newsletter.
This matters because Pi Coin’s current all-time low is near $0.172, so a move toward $0.169 would create a new low. But two metrics can still help PI avert the risk.
Sellers Are Strong, but Buyers Still Show Signs of Life
There are still hints of support from larger buyers. One sign comes from the money flow. The Chaikin Money Flow (CMF), which tracks how much big money is entering or leaving, shows a small divergence. Between December 9 and December 11, the price made a lower low, but the CMF trended higher. This usually signals that some buyers are absorbing the dips.
CMF has also broken above its short-term downtrend, but it has not yet moved over the zero line. The zero line is where money flow shifts from net selling to net buying. Pi Coin needs that shift to confirm strength.
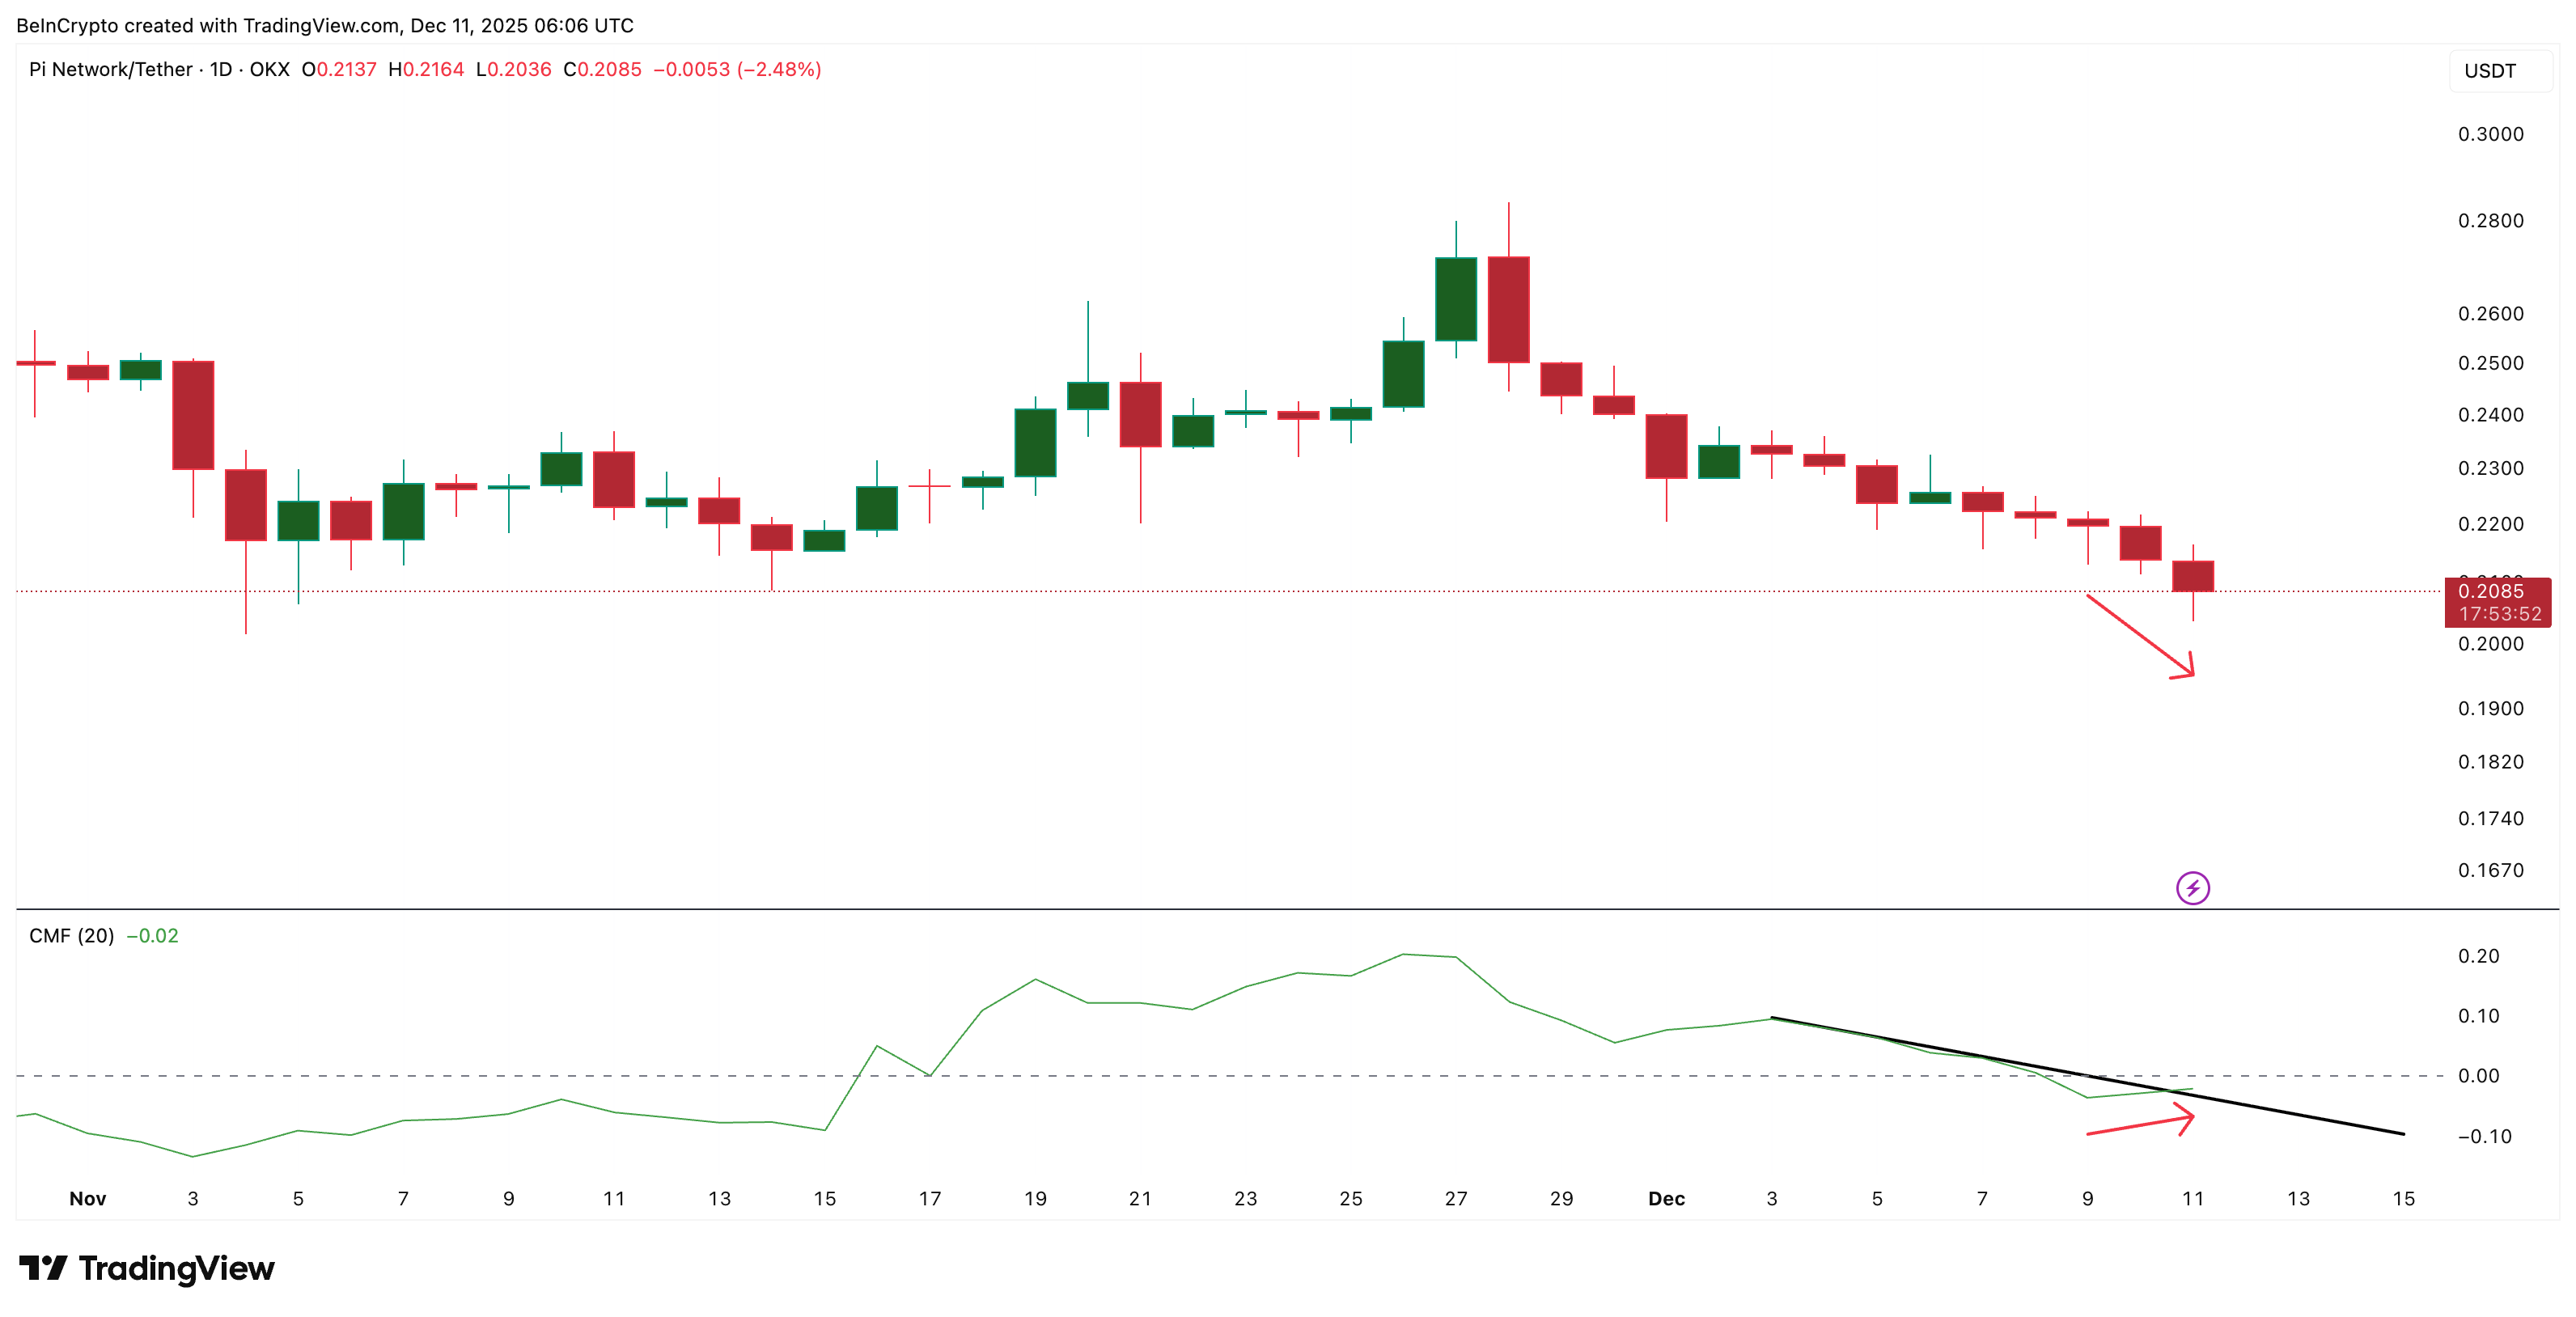 Money Flow Might Be Returning:
TradingView
Money Flow Might Be Returning:
TradingView
Momentum shows a similar picture. The Relative Strength Index (RSI), which measures buying pressure and selling pressure, formed a divergence of its own. Between November 4 and December 10, the PI price made a higher low, but the RSI made a lower low — hidden bullish divergence. This can mean that the selling pressure is starting to weaken.
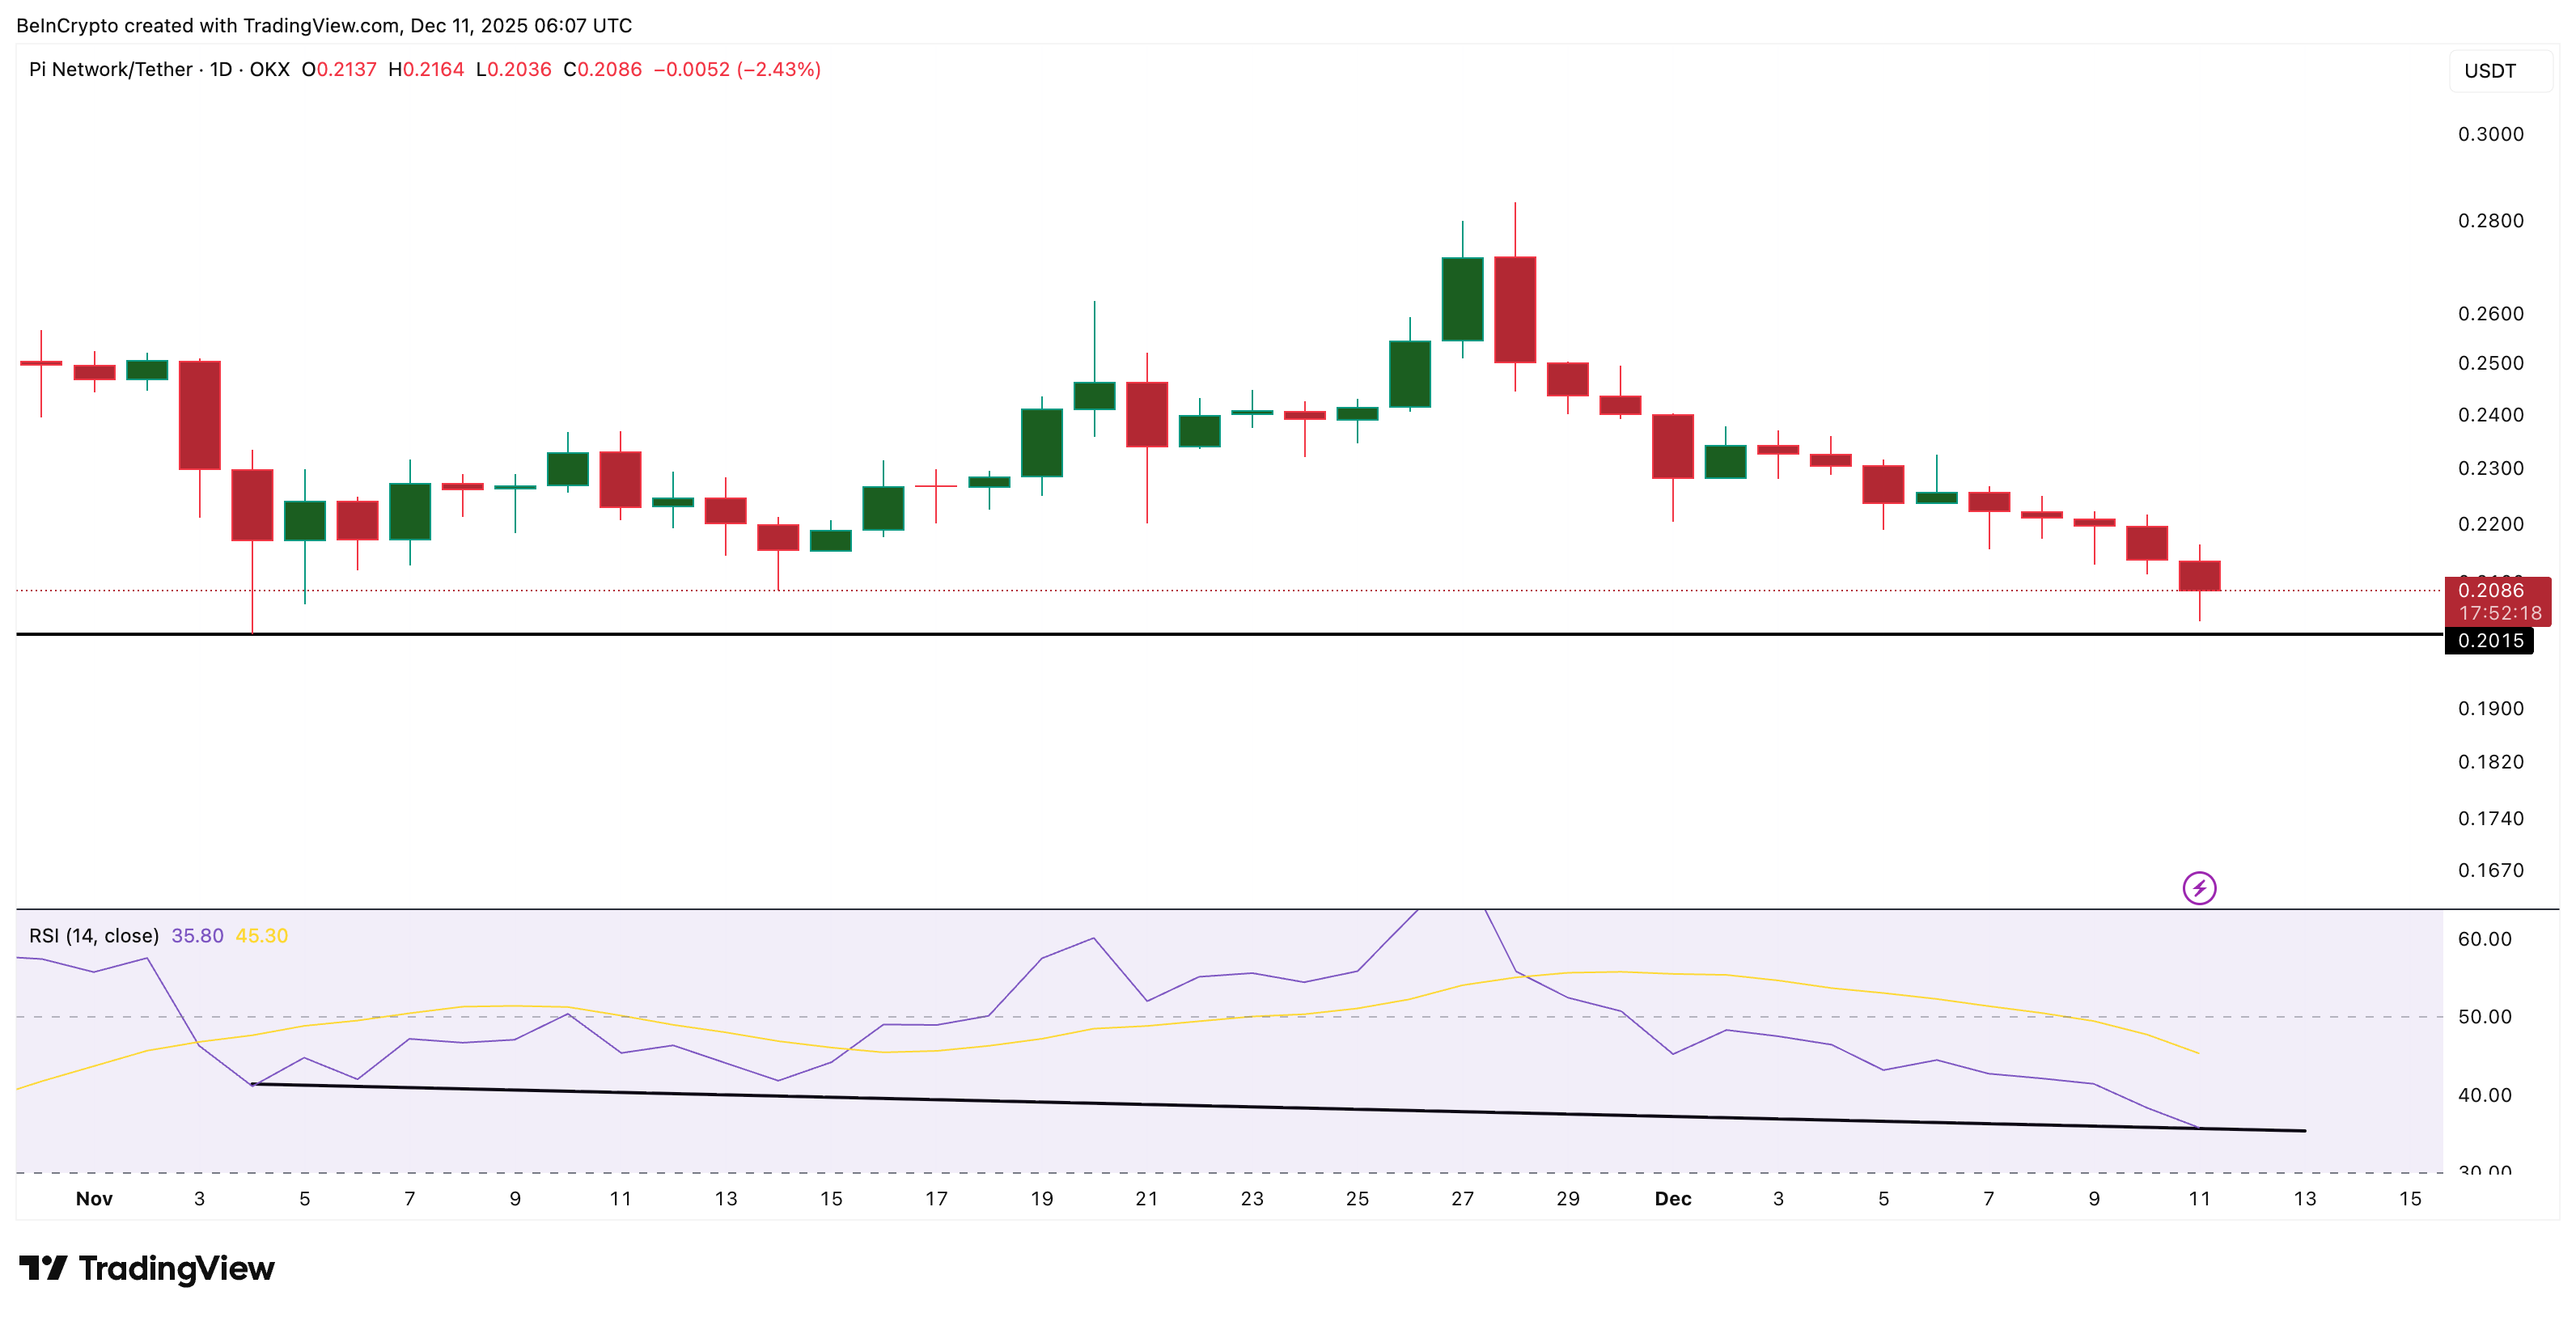 Hidden Bullishness Surfaces:
TradingView
Hidden Bullishness Surfaces:
TradingView
These early signals do not reverse the breakdown, but they show that sellers do not have full control.
Key Pi Coin Price Levels Decide The Fate
The Pi Coin price trades near $0.208 at press time. The most important line is $0.192. A break below it would open the path toward $0.169—the pattern target — and lock in a fresh low for the chart.
For a recovery, Pi Coin must first reclaim $0.233. This level sits above the right shoulder and would show early improvement. A full trend reversal only happens if the price moves above $0.284, which is the zone above the head of the pattern.
 Pi Coin Price Analysis:
TradingView
Pi Coin Price Analysis:
TradingView
Right now, Pi Coin sits between pressure and early support signs. The breakdown points to a new low, but the divergences show that buyers are still active. The next move depends on whether the price holds the $0.192 support or gives in to the downtrend.
Disclaimer: The content of this article solely reflects the author's opinion and does not represent the platform in any capacity. This article is not intended to serve as a reference for making investment decisions.
You may also like
The Emergence of Hyperliquid and What Lies Ahead for Perpetual Trading Platforms
- Hyperliquid dominates 56% of decentralized perpetual trading volume in 2025 with $86.6M 30-day revenue, driven by HyperCore's on-chain CLOB and HyperBFT consensus. - Its sub-second finality and 200k orders/second capacity rival centralized exchanges while maintaining transparency, attracting institutional traders seeking compliance and security. - Strategic partnerships with Anchorage Digital and Circle's CCTP V2, plus a $888M strategies fund, reinforce institutional adoption aligned with U.S. and EU reg

COAI's Unexpected Price Decline: Causes, Impacts, and Potential Prospects?
- COAI token's nearly 90% drop from $44.90 to $2.18 in October 2025 driven by C3.ai's $116.8M loss, governance issues, and regulatory uncertainty. - Market fear index hit 10/100 as top wallets (88% supply control) accelerated selling, shifting capital to Binance Chain meme coins. - Technical indicators show oversold RSI (31.4) but broken key support levels, creating asymmetric risks for contrarian investors. - Regulatory ambiguity and governance flaws persist, with 30-day -92.6% decline highlighting struct

LUNA +30.44% 7D as Network Improvements and Upcoming Sentencing Date Fuel Market Fluctuations
- Terraform Labs founder Do Kwon's sentencing hearing on Dec 11 intensified LUNA volatility, with 11.16% 24h drop amid legal uncertainty. - Terra network's v2.18 upgrade boosted LUNA by 250% in 10 days through performance improvements and Cosmos interoperability. - LUNC surged 116% weekly driven by viral social media nostalgia and accelerated token burns, highlighting community-driven sentiment. - Legal outcomes and technical upgrades remain dual drivers, with market volatility expected to persist until re