What Does the Russell 2000 Breakout Signal Mean for Bitcoin and Altcoins?

The Russell 2000 Index, which comprises approximately 2,000 small-cap companies, has long served as a barometer of investor appetite for growth and high-risk equities. Analysts quickly noticed its correlation with the crypto market. When risk-on sentiment spreads into the crypto market, it can help push Bitcoin and altcoins higher. The details below illustrate how this
The Russell 2000 Index, which comprises approximately 2,000 small-cap companies, has long served as a barometer of investor appetite for growth and high-risk equities. Analysts quickly noticed its correlation with the crypto market.
When risk-on sentiment spreads into the crypto market, it can help push Bitcoin and altcoins higher. The details below illustrate how this dynamic unfolds.
Russell 2000 Flashes a Breakout Signal, Raising Hope for Crypto
If the S&P 500 represents large-cap blue-chip companies, the Russell 2000 focuses on small-cap stocks.
The index is not as famous as the S&P 500 or the Dow Jones. However, it remains important, especially for investors who seek higher risk. This risk appetite aligns closely with many crypto investors.
In December, the Russell 2000 recorded a major turning point when it broke above a long-term resistance level. This move often signals strong upside momentum.
The breakout is considered a clear risk-on signal. This suggests that capital is shifting back to riskier assets, which can serve as fuel for Bitcoin (BTC) and altcoins.
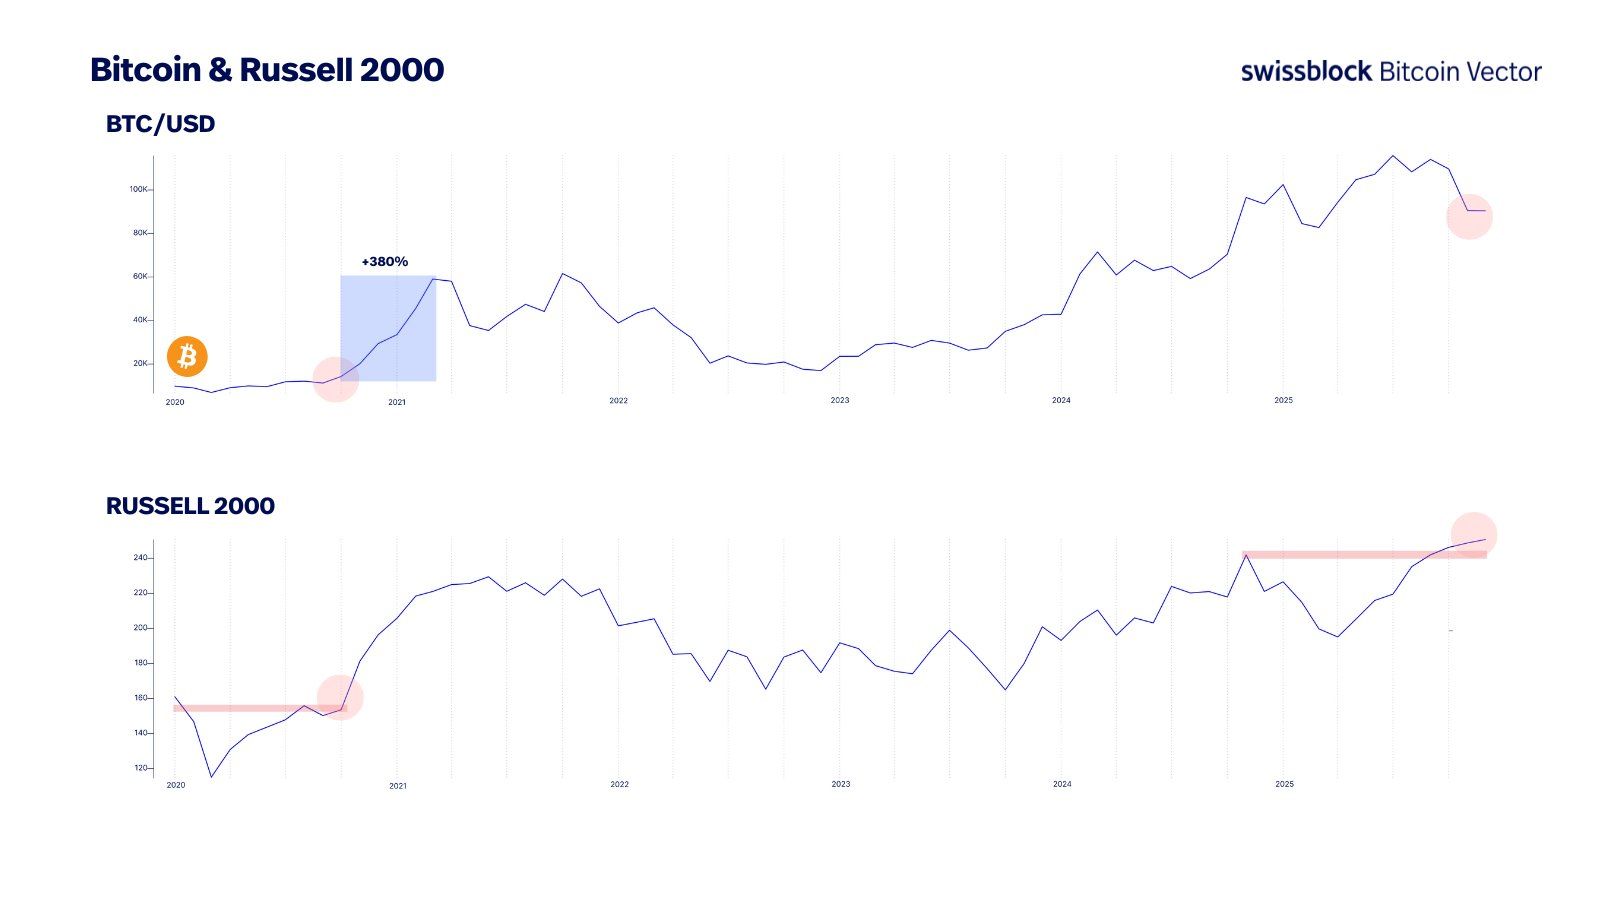 Bitcoin vs Russell 2000. Source:
The Bitcoin Vector — an institutional Bitcoin report published by Swissblock — noted that in late 2020, the Russell 2000 broke through new highs and later turned that level into support. Bitcoin surged 380% after that.
“Last time this setup appeared, BTC delivered over 390% upside. This time the structure is different, but we’re starting from an environment that precedes liquidity expansion. And when liquidity turns, risk assets take the lead,” Bitcoin Vector stated.
Negentropic, co—founder of Glassnode, added that the Russell 2000 breakout signals a broad return of investors to risk assets.
Several analysts also believe this is a bullish sign for altcoins.
“Russell 2000 is the biggest indicator for Altseason, and it’s about to hit a new all-time high,” Ash Crypto said.
By comparing the altcoin market capitalization with that of the iShares Russell 2000 ETF — a fund that tracks US small-cap equities — analyst Cryptocium highlighted a correlation. Altcoin market cap (OTHERS) often surges when the iShares Russell 2000 ETF breaks above its previous all-time high.
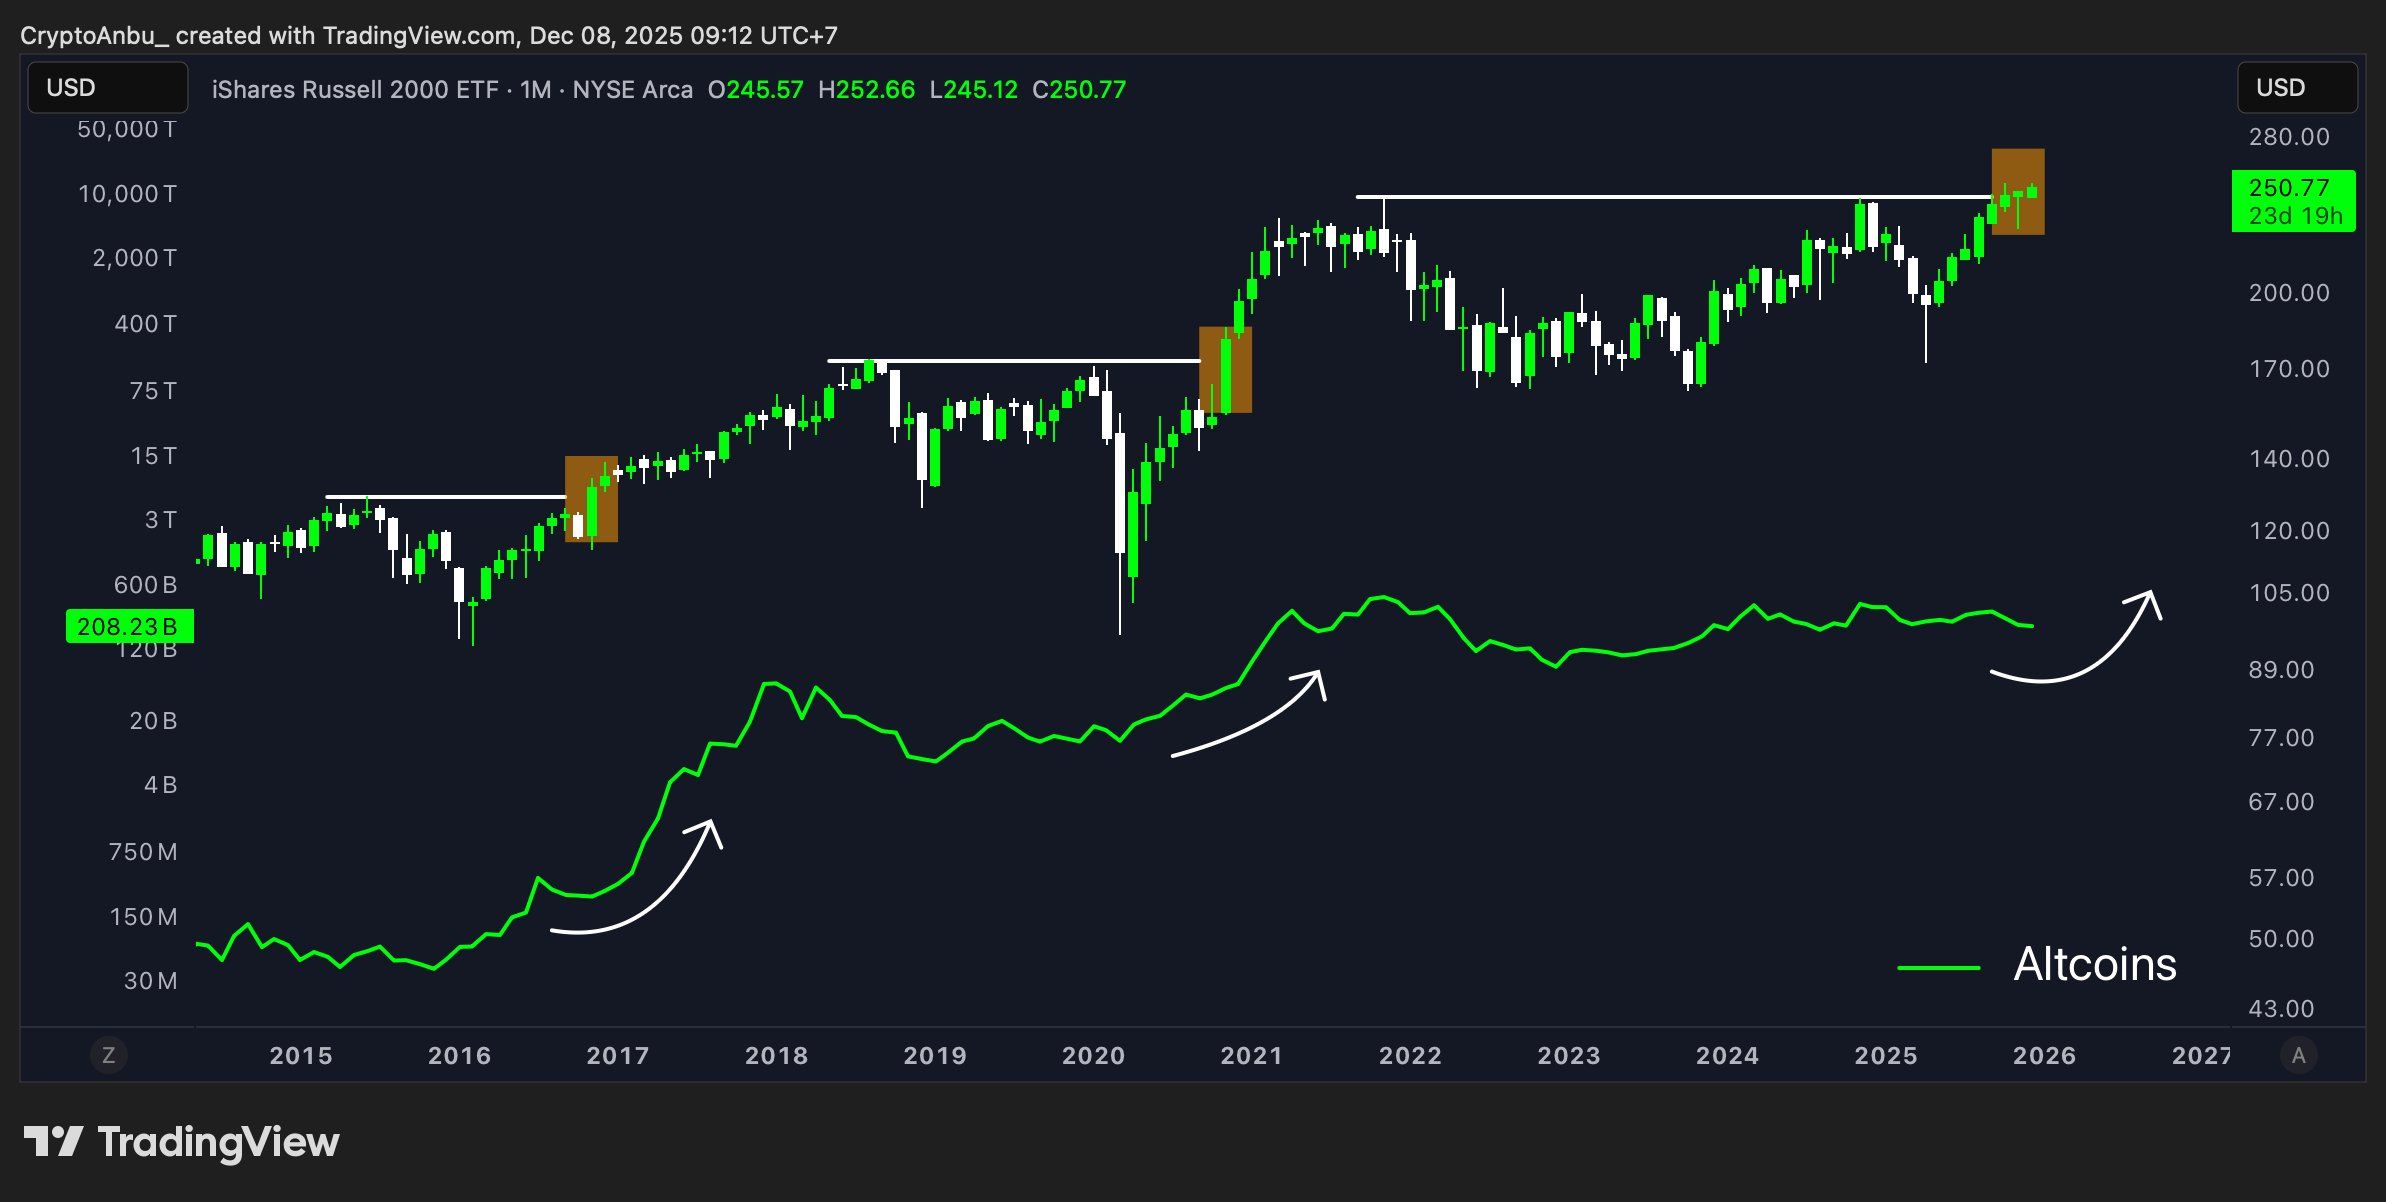 Altcoin Market Cap vs iShares Russell 2000 ETF. Source:
This pattern has appeared twice: once in 2017 and again in 2021. It now suggests a potential altcoin boom in 2026.
But a Deeper Look Reveals Internal Weakness
A closer look inside the Russell 2000 rally shows a different picture.
Analyst Duality Research noted that, although the index rose in 2025, small-cap ETFs within the index still recorded net outflows of approximately $19.5 billion this year. This contrasts sharply with past rallies, which have typically been accompanied by strong ETF inflows.
The Russell 2000 is up more than 13% year-to-date and over 40% off its April lows, yet small-cap ETFs have still recorded roughly $20 billion in net outflows this year.
— Duality Research
This perspective weakens the bullish argument for a tight correlation between the Russell 2000 and the crypto market. If risk-on sentiment fails to last and the breakout turns into a false move, that negative shift may spread and extend the bearish mood in the crypto market.
Disclaimer: The content of this article solely reflects the author's opinion and does not represent the platform in any capacity. This article is not intended to serve as a reference for making investment decisions.
You may also like
Key Bitcoin price levels to watch ahead of 2025’s last FOMC meeting

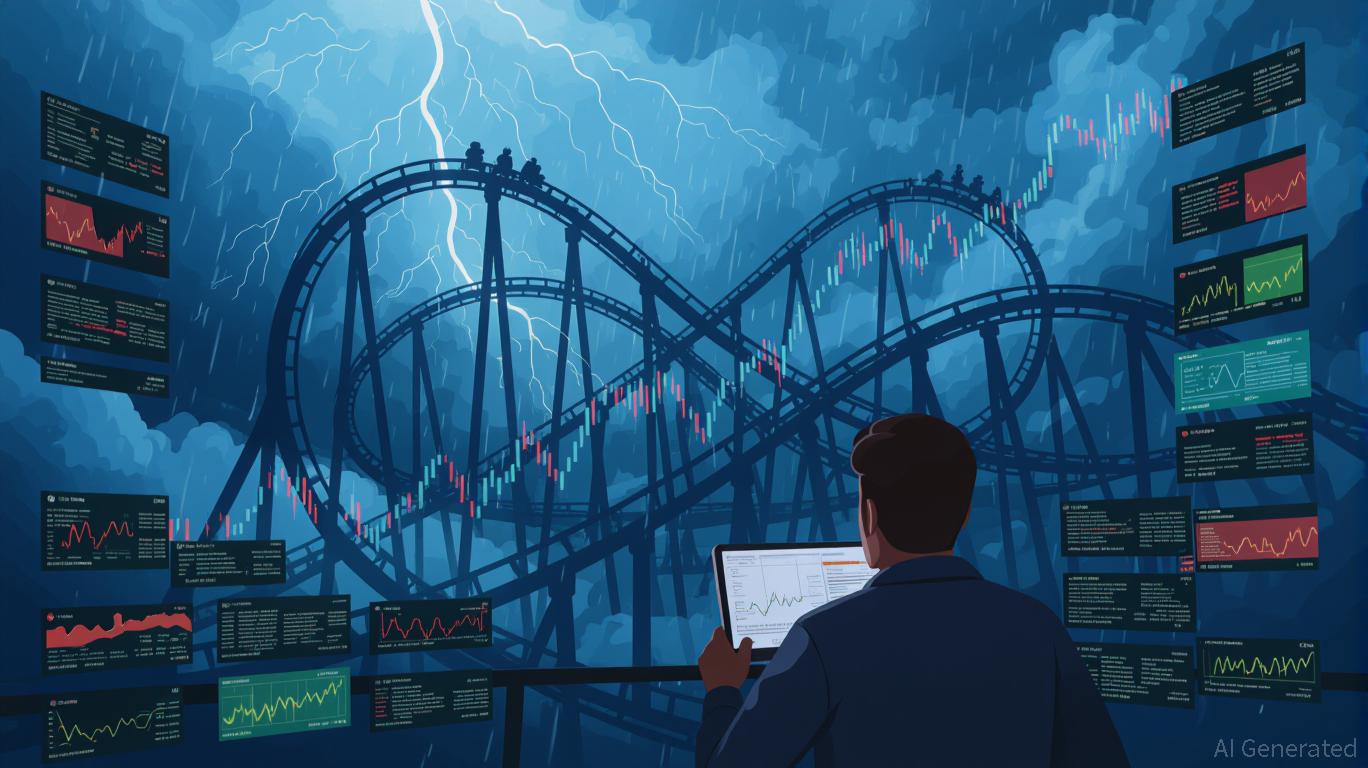
Navigating the Fluctuations of Bitcoin in Late 2025: Adaptive Risk Management Approaches for an Evolving Cryptocurrency Landscape
- Bitcoin's November 2025 price swung between $80,553 and $91,000, eroding 25% of value amid macroeconomic and regulatory pressures. - Volatility stemmed from technical breakdowns, leveraged liquidations, and market makers' gamma exposure shifts below $85,000. - U.S. GENIUS Act and EU MiCA framework provided regulatory clarity, boosting institutional adoption through compliant ETPs and stablecoins. - Investors adopted risk-rebalance strategies: options hedging, macro-adjusted DCA, and diversified crypto tr
Bitcoin Experiences Steep Drop: What Causes the Sudden Sell-Off?
- Bitcoin plummeted 30% in November 2025, erasing $1 trillion in market cap amid macroeconomic pressures and institutional profit-taking. - Central bank uncertainty (Fed, ECB) and leveraged liquidations amplified the selloff, with ETF outflows exceeding $3.79 billion. - Bitcoin's 0.90 correlation with the S&P 500 highlighted its shift from "digital gold" to risk-on asset, contrasting gold's 55% surge. - On-chain metrics revealed structural weaknesses: hash rate declines, miner revenue drops, and divergent

PENGU USDT Sell Alert and Stablecoin Price Fluctuations: Evaluating Algorithmic Dangers Amid Changing Cryptocurrency Markets
- PENGU USDT's 2025 volatility reignited debates on algorithmic stablecoin fragility amid regulatory uncertainty and post-UST market skepticism. - Technical analysis showed conflicting signals: overbought MFI vs bearish RSI divergence, with critical support/resistance levels at $0.010-$0.013. - $66.6M team wallet outflows and 32% open interest growth highlighted liquidity risks, while UST's collapse legacy exposed algorithmic design flaws. - Investors increasingly favor fiat-backed alternatives like USDC ,