
Crypto Market Prediction: XRP's Mythical 1,100% Activity, Bitcoin's Upside Setup Strengthens, Shiba Inu's (SHIB) Razor-Sharp Reversal Window

The massive 1,100% surge in XRP Ledger payment activity — the second-largest spike in a 365-day window — is one of those metrics that looks explosive on paper but becomes much more nuanced when you line it up against price action and structural market conditions. Yes, the network lit up: payment volume and counts went vertical momentarily, approaching levels not seen since the euphoric early stages of the cycle.
But activity alone does not automatically translate into bullish price action, and XRP’s chart makes that painfully obvious. The price is stuck in a clear descending channel, rolling over each time it gets close to the 20-50 EMA cluster and failing at the midrange. Momentum is weak, the RSI is hovering in the mid-40s and volume on green candles is uninspiring.
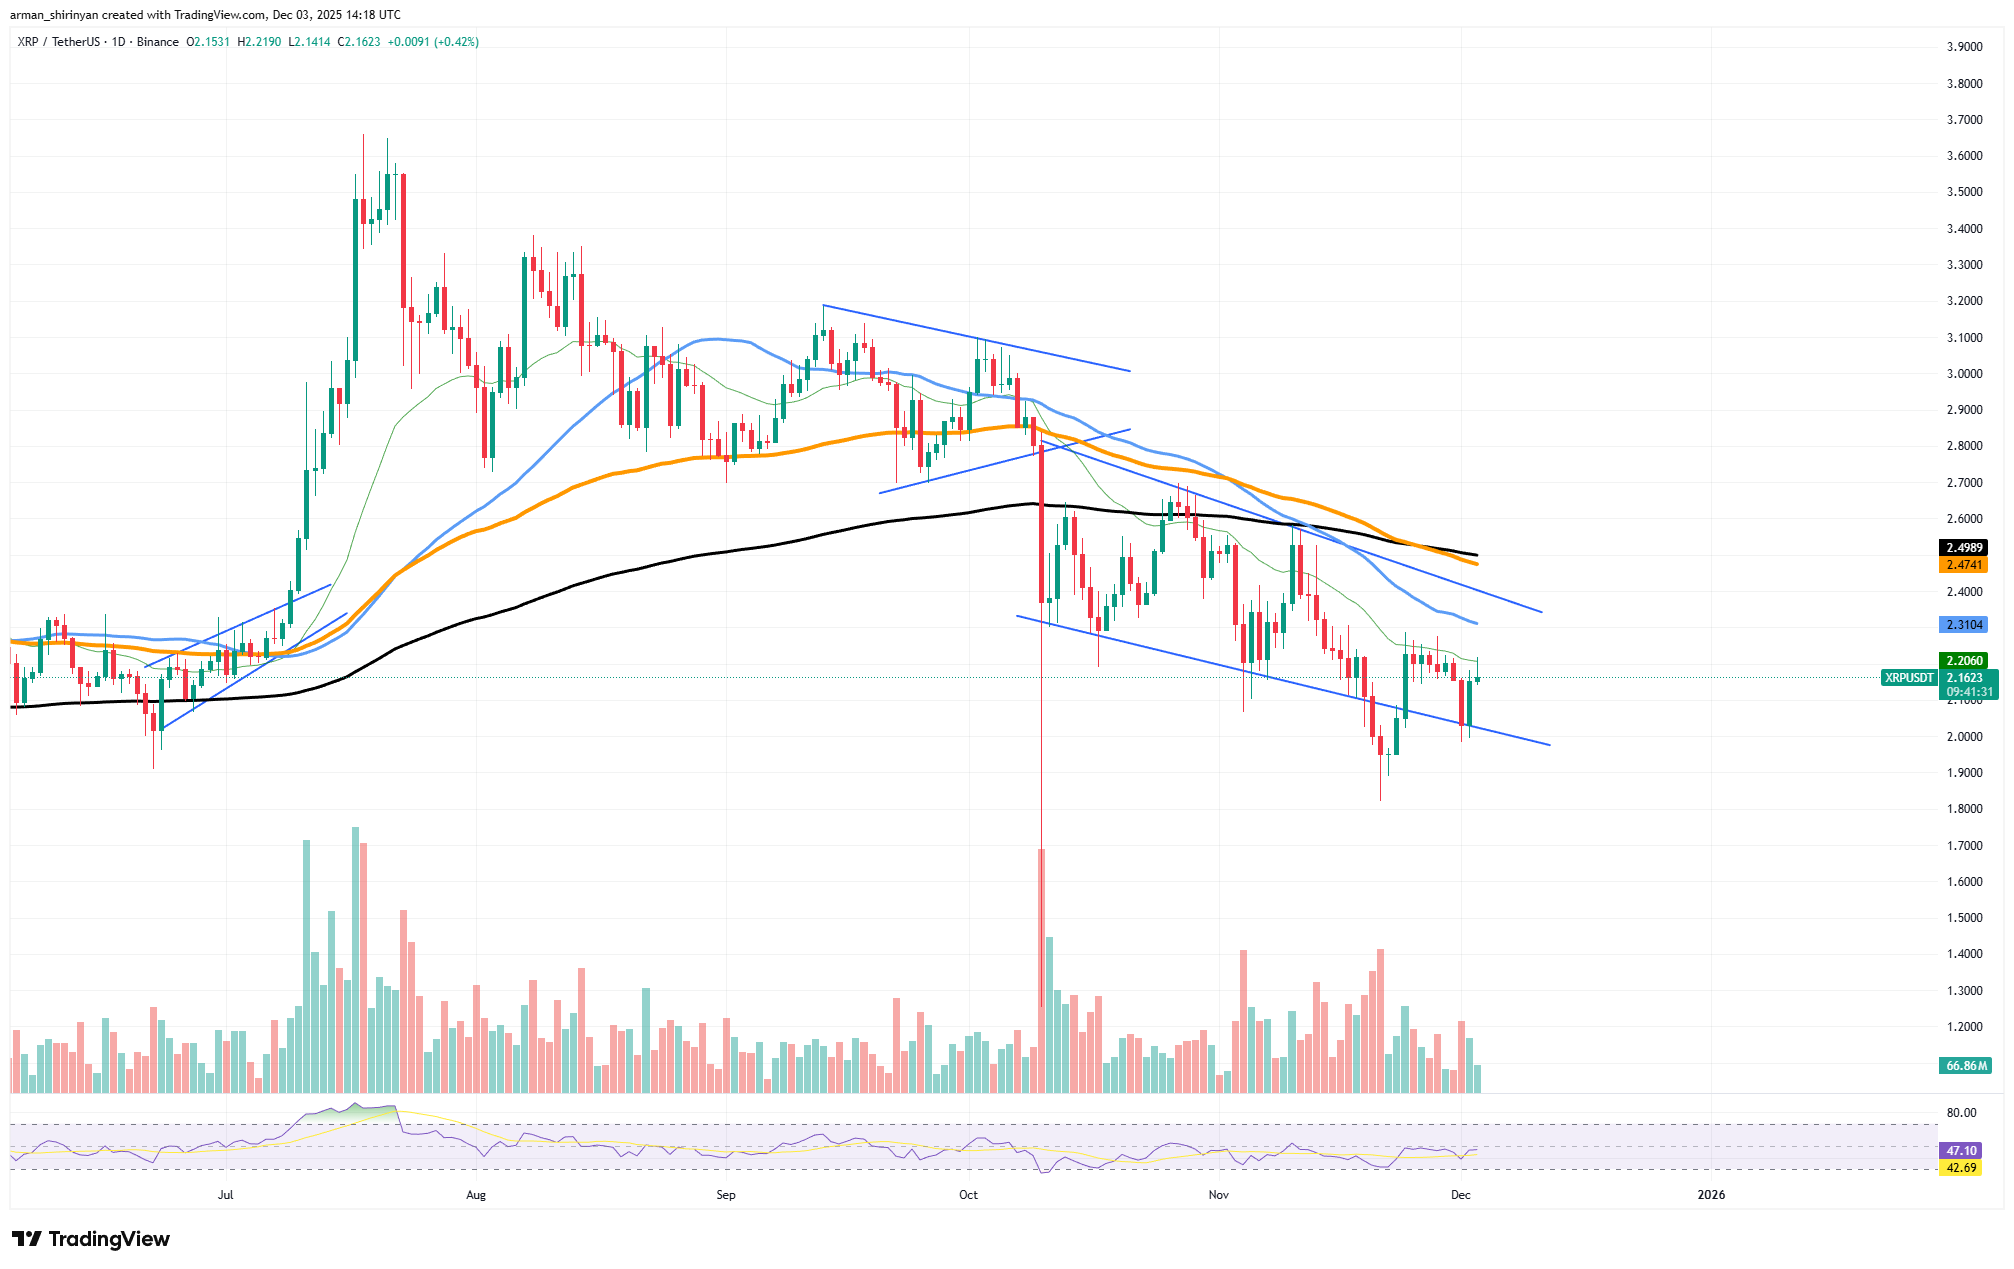
The recent bounce off the channel bottom appears to be nothing more than a mechanical reaction, the kind of move assets make just because they hit trendline support rather than because buyers are suddenly making a significant comeback. So, how does the activity spike fit into this?
There have been two types of XRP Ledger activity spikes in the past: bursts brought on by utilities (ODL flows, settlement spikes, institutional movements) and volatility caused by noise — frequently wash-like patterns or automated systems that cycle through big volumes of transactions. This surge resembles the second category more than the first — at least so far.
There are no signals of accumulation exchange outflows, a shift in broader market flows or an accompanying shift in liquidity into spot markets that would indicate institutions are preparing for a breakout. The price simply did not react —and that silence from the chart is telling.
Is Bitcoin ready?
The current rally does not seem like another dead-cat lift inside a brutal downtrend, the slope, volume and structure look meaningfully different this time. Buyers entered the $84,000-$86,000 range with vigor, printing a series of growing green candles supported by increasing volume. More significantly, Bitcoin is now moving confidently — something it has not done since mid-October, straight into the 20-day EMA.
The acceleration is clear on the chart: shorter-term moving averages are flattening, candle bodies are widening and intraday recoveries are sticking. That is how a momentum pivot appears in its early stages.
The big question is whether this move has enough strength to reclaim the mid-$95,000s and eventually challenge the resistance zone around $100,500-$102,000, sitting right at the 50-day EMA and horizontal supply. That area is the battlefield. Break it, and the market’s bias flips from corrective to constructive. If we do not succeed there, we will return to rangebound suffering.
BTC is still structurally below all major medium-term moving averages, and the broader trend is objectively downward. This bounce does not magically erase that. But strong rallies inside downtrends matter — they tell you whether sellers are losing control.
Short-term expectations:
-
Momentum can carry BTC to $95,000-$97,000 relatively quickly.
-
A spike into $100,000-$102,000 is on the table if volume keeps expanding.
-
RSI is rising but not stretched, so there is room for more upside before exhaustion kicks in.
Shiba Inu's thin recovery threshold
Shiba Inu just delivered one of its cleaner intraday reversals in weeks, but calling it a recovery would be dishonest. In reality, there is a limited high-risk window in which SHIB can still achieve a significant trend shift, but the bar for that shift is becoming thinner every day. This bounce looks sharp because SHIB has been smashed for weeks, grinding lower under every major moving average while liquidity dried up.
Any sudden rotation of buyers naturally looks aggressive on the chart. That does not make it structurally strong. The current rebound is trying to push SHIB toward the 20-day EMA, the first technical hurdle where every previous attempt this quarter failed. Until that level is reclaimed and held, the market will not treat the move as anything more than a relief bounce inside a bearish macro structure.
The price is still well below the 50-day EMA and miles under the 200-day, which means the longer-term trend remains decisively downward. What matters here is how narrow the reversal window has become. Long-term consolidation is not possible on SHIB. Volume is picking up slightly, but not enough to confirm a sustainable accumulation phase. The market context makes this tighter.
Bitcoin is rallying, but SHIB is barely reacting compared to stronger altcoins. That divergence is a warning: if BTC cools off again, SHIB likely loses this entire bounce and prints new local lows. Because SHIB is no longer exhibiting relative strength against anything — not Bitcoin ETH or other meme-sector tokens — the threshold is extremely thin.
A proper recovery requires SHIB to break above the descending trendline and reclaim the short-term EMAs with convincing volume. Until that happens, this reversal is nothing more than a brief counter-move inside a larger downtrend. SHIB still has a chance, but it is a narrow one and the clock is ticking.
Disclaimer: The content of this article solely reflects the author's opinion and does not represent the platform in any capacity. This article is not intended to serve as a reference for making investment decisions.
You may also like
Ramp Network Secures EU-Wide Crypto Licence Under MiCAR
Hyperliquid (HYPE) Price Spike Expected in Late 2025: Transforming DeFi Liquidity and Market Dynamics
- Hyperliquid (HYPE) dominates 75% of decentralized perpetual contracts with $95.63M 30-day revenue, driving a 23% weekly token surge. - Its CLOB model on HyperBFT blockchain achieves 200k orders/second, bridging DEX-CEX gaps with $15B open interest and $47B weekly volumes. - Institutional adoption via $888M Hyperliquid Strategies and $3.5B TVL growth redefines altcoin valuations through on-chain liquidity metrics. - Challenges include 3 market manipulation attacks and $89.2M HYPE unstaking, countered by H

UK Law Confirms Crypto as Personal Property