Date: Wed, Nov 26, 2025 | 12:15 PM GMT
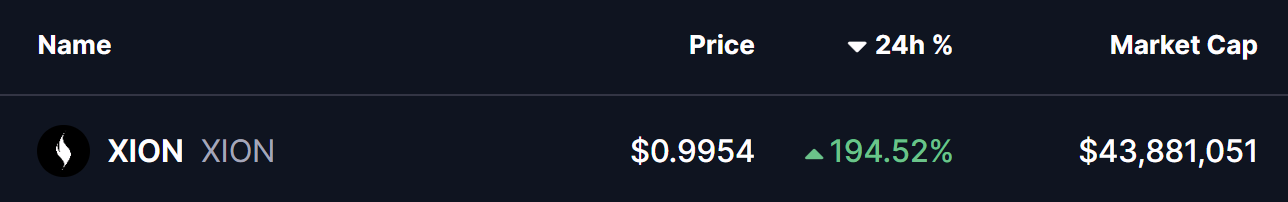
In the cryptocurrency market today, the $XION token — the native utility and governance asset of the XION blockchain, a Layer-1 network built to accelerate mainstream Web3 adoption — has grabbed major attention. The token exploded nearly 200% following a major exchange listing, and now a developing structure on the chart may offer clues on what comes next for the token.
 Source: Coinmarketcap
Bithumb Listed XION
The sharp surge in XION’s price comes immediately after Bithumb , one of South Korea’s largest regulated exchanges with more than 8 million users, officially listed the $XION token in the KRW market pair today.
The listing sparked a massive spike in activity, pushing XION’s 24-hour trading volume up by 618.92%, fueling strong speculation and momentum across the market.
 Source: @burnt_xion (X)
Can This Pattern Trigger Further Gains?
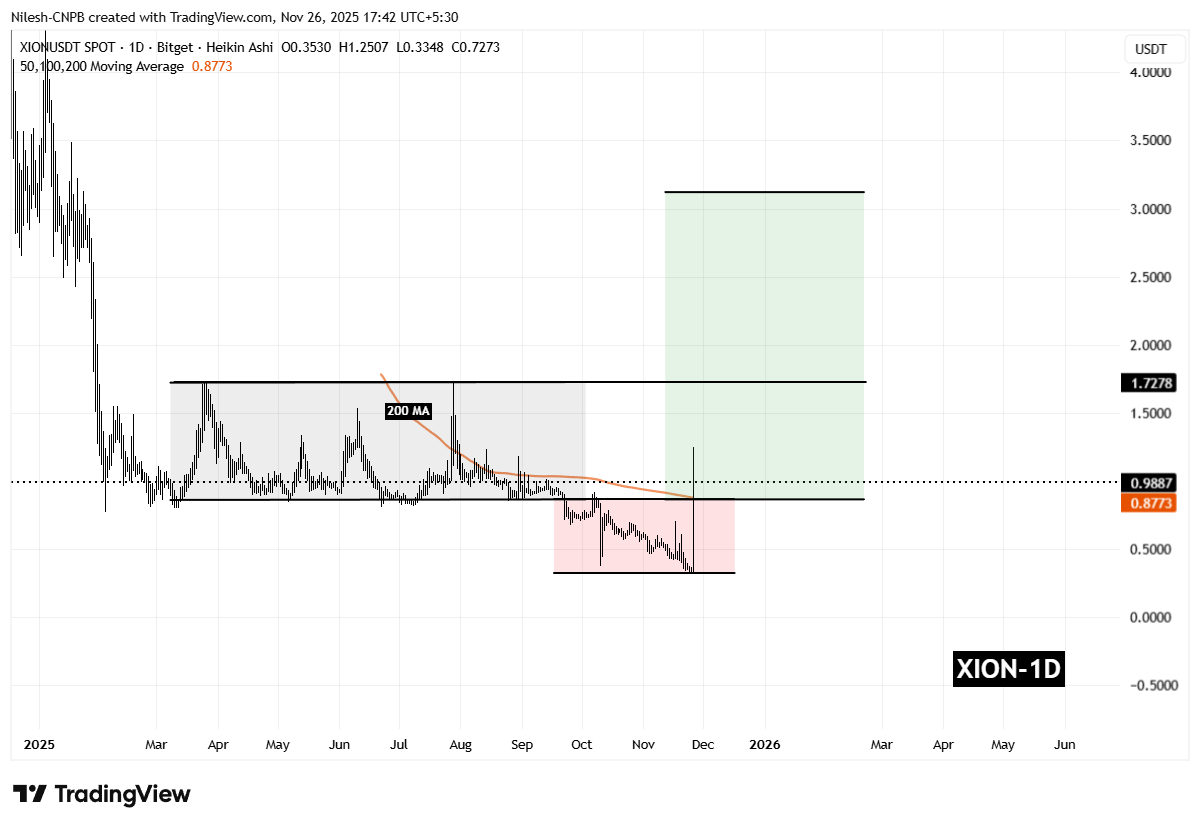
On the daily chart, XION appears to be forming a three-phase structure that aligns with the Power of 3 (PO3) model — a popular framework that maps out manipulation, accumulation, and expansion phases before a stronger trend move.
After dipping into the manipulation zone, XION bounced sharply and has now reclaimed the accumulation range low at $0.86, which also aligns with a reclaim of the 200-day moving average. This level has now flipped into support, strengthening the bullish outlook as long as buyers defend it.
 XION Daily Chart/Coinsprobe (Source: Tradingview)
XION is currently trading above this zone, and maintaining support here could allow the expansion phase to continue. The next major resistance sits at $1.7278, the range high marked on the chart. A clean reclaim of this level would expose the next technical target near $3.11, matching the projected expansion zone.
However, it’s important to note that listing-driven pumps often retrace quickly.
A failure to hold both the 200-day MA and the $0.86 support would invalidate the current bullish structure and put XION back into its previous range.