Solana (SOL) Aims Recovery Run, $155 Resistance Now Back in Focus

Solana started a recovery wave above the $132 zone. SOL price is now consolidating and faces hurdles near the $145 zone.
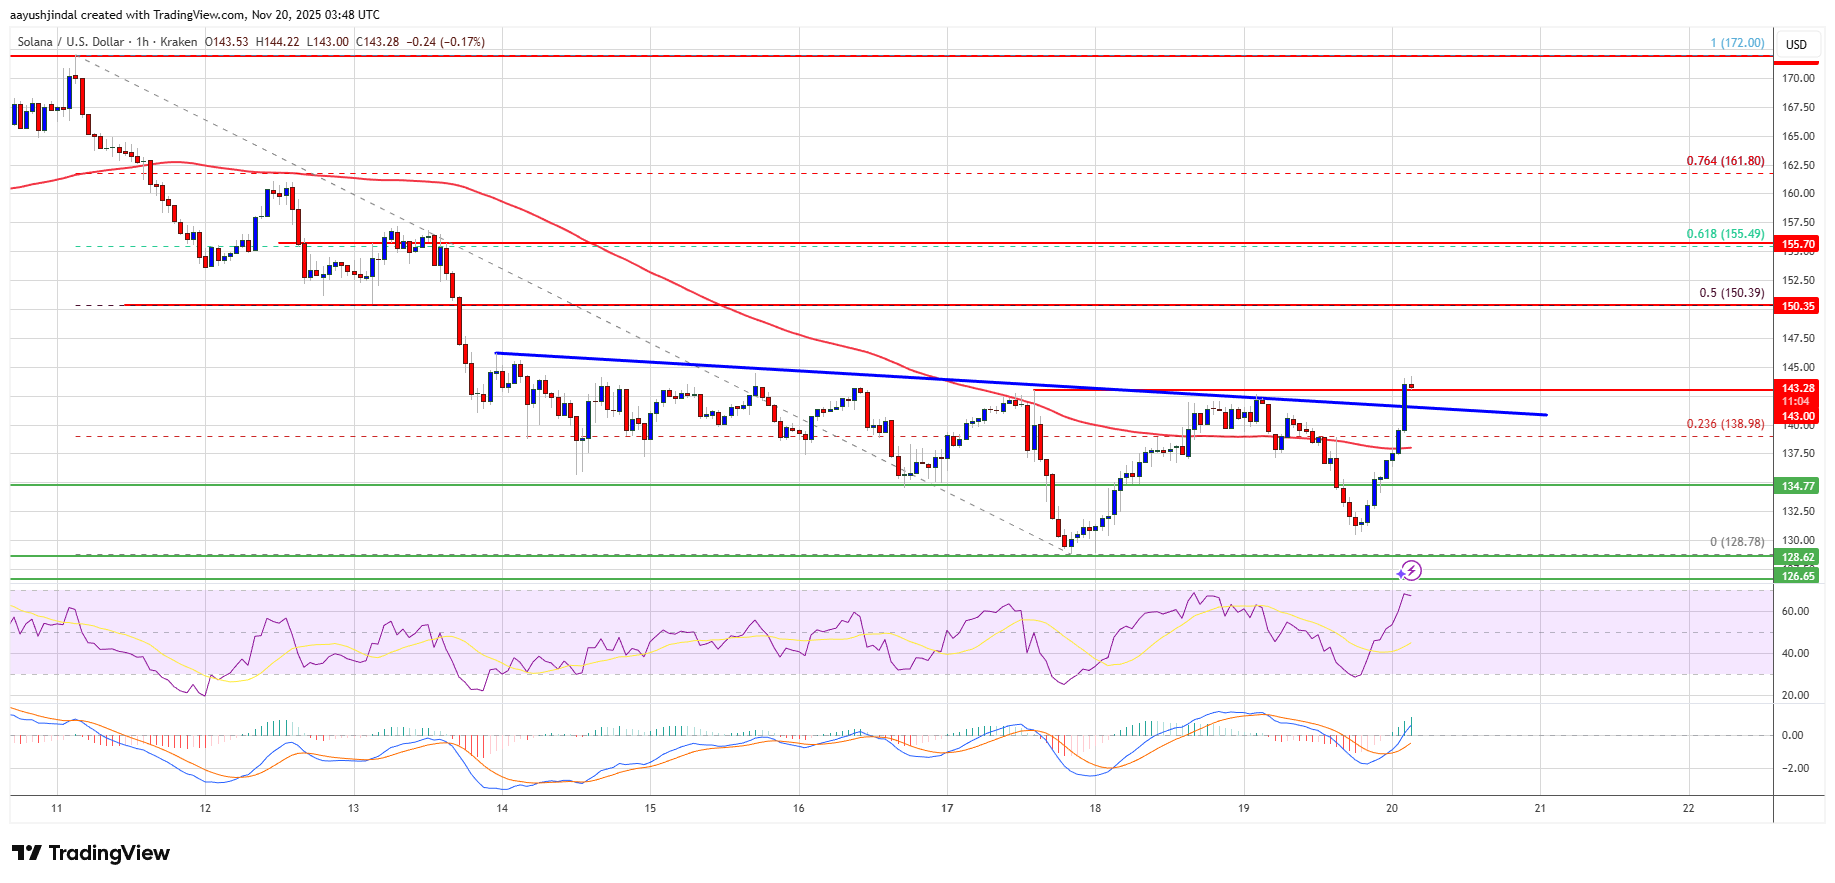
- SOL price started a decent recovery wave above $135 and $140 against the US Dollar.
- The price is now trading above $140 and the 100-hourly simple moving average.
- There was a break above a key bearish trend line with resistance at $140 on the hourly chart of the SOL/USD pair (data source from Kraken).
- The price could continue to move up if it clears $145 and $150.
Solana Price Aims Higher Levels
Solana price remained stable and started a decent recovery wave above $130, beating Bitcoin and Ethereum. SOL was able to climb above the $135 level.
There was a move above the 23.6% Fib retracement level of the downward move from the $172 swing high to the $129 low. Besides, there was a break above a key bearish trend line with resistance at $140 on the hourly chart of the SOL/USD pair.
Solana is now trading above $140 and the 100-hourly simple moving average. On the upside, immediate resistance is near the $145 level. The next major resistance is near the $150 level.
The main resistance could be $155 and the 61.8% Fib retracement level of the downward move from the $172 swing high to the $129 low. A successful close above the $155 resistance zone could set the pace for another steady increase. The next key resistance is $165. Any more gains might send the price toward the $172 level.
Another Drop In SOL?
If SOL fails to rise above the $150 resistance, it could continue to move down. Initial support on the downside is near the $138 zone. The first major support is near the $135 level.
A break below the $135 level might send the price toward the $128 support zone. If there is a close below the $128 support, the price could decline toward the $120 zone in the near term.
Technical Indicators
Hourly MACD – The MACD for SOL/USD is gaining pace in the bullish zone.
Hourly Hours RSI (Relative Strength Index) – The RSI for SOL/USD is above the 50 level.
Major Support Levels – $138 and $135.
Major Resistance Levels – $150 and $155.
Disclaimer: The content of this article solely reflects the author's opinion and does not represent the platform in any capacity. This article is not intended to serve as a reference for making investment decisions.
You may also like
Stablecoin Surge Compels Basel to Address Regulatory Inflexibility
- Global regulators, led by the Basel Committee, face pressure to revise strict 1,250% capital requirements for stablecoins as their role in institutional finance expands. - The U.S. Fed, Bank of England, and EU reject current rules, citing impracticality, while stablecoins like USDT/USDC now underpin regulated crypto derivatives and yield products. - Basel chair Erik Thedéen acknowledges the need for a "different approach" to risk-weighting stablecoins, which now enable institutional access to crypto mark

Markets Trapped Between Fear and Optimism for the Future
- U.S. markets face volatility as delayed September NFP data creates uncertainty over Fed rate-cut timing, with crypto and equities reacting sharply. - Bitcoin erased 2025 gains amid waning sentiment and liquidity strains, while AI stocks like Nvidia falter on profitability concerns. - Gold struggles near $4,080 as hawkish Fed signals boost the dollar, contrasting with Kraken's $20B IPO optimism in crypto diversification. - Upcoming NFP report and Fed minutes could determine market direction, balancing sho

Zcash (ZEC) Price Rally: Renewed Interest in Privacy Coins Fueled by Institutional Engagement and Clearer Regulations
- Zcash (ZEC) surged 10.72% to $683.14 on Nov 15, 2025, driven by institutional adoption and regulatory clarity. - Major investors like Cypherpunk ($146M) and Winklevoss ($58.88M) boosted ZEC's market cap to $7.2B, surpassing Monero. - U.S. Clarity/Genius Acts legitimized Zcash's optional-privacy model, distinguishing it from untraceable coins amid regulatory scrutiny. - Price volatility and technical indicators suggest potential for $875 if institutional demand and regulatory support persist. - Zcash's st
Ethereum Updates Today: Can Bulls Defend the $2,850 Level or Will Bears Take Over?
- Ethereum's $3,000 price tests $2,800–$2,950 support zone amid bullish wedge patterns and bearish breakdown risks. - Analysts split: Erik warns $2,850 break could trigger $800–$1,000 drop, while Matt Hughes calls $2,870 pullback a normal correction. - Technical indicators show mixed signals - ETH above 100-day EMA but below 50-day EMA, with Bollinger Bands framing $2,850–$3,150 key levels. - On-chain data suggests potential "liquidity reset" could precede bullish expansion, but delayed recovery risks prol