

Date: Mon, Nov 17, 2025 | 07:45 AM GMT
The broader altcoin market continues to face heavy volatility as Ethereum (ETH) has dropped more than 17% over the past 30 days, adding significant pressure on several major tokens , including Kaspa (KAS).
KAS has slipped nearly 14% during this period, but the chart is now hinting at something far more constructive beneath the recent weakness. A clearly defined harmonic structure is taking shape, suggesting that a potential rebound may be developing.
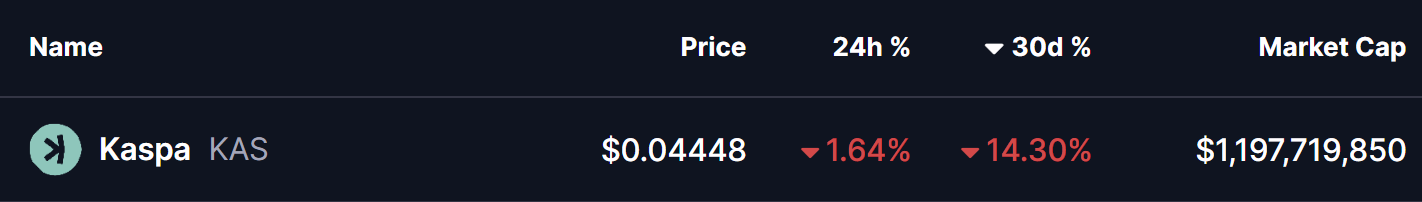 Source: Coinmarketcap
Harmonic Pattern Signals More Upside
On the 4-hour timeframe, Kaspa is forming a Bearish Gartley harmonic pattern—a setup that typically drives price higher until the final D-point completes. While the reversal generally occurs at the PRZ (Potential Reversal Zone), the approach toward that zone often brings steady upside movement.
The structure began at Point X near $0.060449, followed by a sharp decline into Point A. A bounce then carried price into Point B, before a deeper correction drove KAS into Point C around $0.042731. From this level, the token has started to climb again and is now trading near $0.044469, showing early signs of renewed momentum.
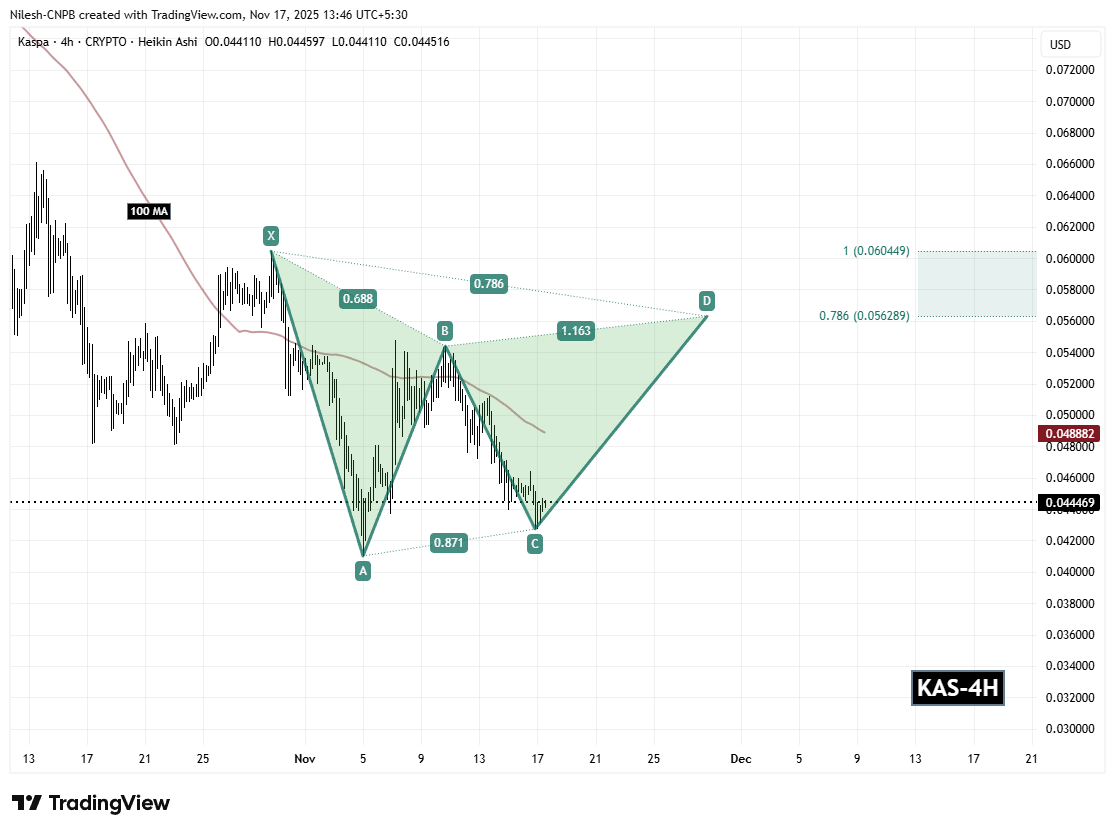 Kaspa (KAS) 4H Chart/Coinsprobe (Source: Tradingview)
Adding strength to this setup is the 100-hour moving average, currently sitting around $0.048882. A reclaim of this level would indicate rising buyer conviction and serve as a strong confirmation of trend improvement.
What’s Next for KAS?
The immediate focus remains on the C-support region at $0.042731. Holding above this level is essential for keeping the harmonic structure intact. If KAS maintains this support and continues gaining momentum, the next major hurdle lies at the 100-hour moving average around $0.048882. A strong breakout above this dynamic resistance could open the door for the continuation of the CD-leg.
From there, KAS is likely to move toward the Potential Reversal Zone (PRZ) between the 0.786 Fibonacci extension at $0.056289 and the 1.0 extension at $0.060449. This is the region where the Gartley pattern is expected to complete before facing stronger resistance or a possible trend shift.
However, a failure to hold the C-support at $0.042731 would weaken the bullish outlook and could trigger deeper downside testing before any meaningful recovery resumes.