Bitcoin price below energy cost models as MVRV z-score sinks

Bitcoin trades far below energy cost models; mining pressures rise.
- Bitcoin’s price is nearly 70% beneath its estimated fair value based on mining energy cost models, sparking concern among analysts tracking production economics.
- Technical data (MVRV Z-Score, Stochastic RSI) shows bearish momentum and recent declines, with historic signals pointing to possible accumulation periods.
- Miners face rising energy expenses, squeezed profit margins, and ongoing difficulty adjustments, making the next weeks pivotal for market direction.
Bitcoin ( BTC ) price is trading approximately 70% below its estimated fair value based on mining energy cost models, according to analysts tracking production economics in the cryptocurrency sector.
Energy-driven valuation models , which calculate Bitcoin’s theoretical value using electricity costs, hardware efficiency and miner behavior, show a substantial gap between current market prices and production-based fair value estimates, according to industry analysts.
The MVRV Z-Score , a long-term on-chain indicator, has declined to 14-month lows, levels that have historically corresponded with accumulation periods in previous market cycles, according to blockchain data providers.
Energy-based valuation models have gained adoption among institutional analysts because they link price expectations to measurable production costs rather than speculative sentiment, according to market observers. These models incorporate real-time mining efficiency data and global energy prices to establish a theoretical value range for the cryptocurrency.
The models operate on the premise that miners behave according to long-term economic incentives. When mining becomes unprofitable, less efficient miners cease operations, reducing total network energy consumption and lowering difficulty during adjustment cycles. This process theoretically brings production costs and market prices into alignment over time, according to the model’s framework.
Bitcoin’s protocol adjusts mining difficulty every 2,016 blocks to maintain an average block time near 10 minutes. When mining participation decreases, difficulty adjusts downward, reducing energy requirements per block. Conversely, when participation increases, difficulty rises, elevating energy consumption and the associated production cost per coin.
Historical patterns indicate that when valuation models diverge significantly from spot prices, the gap typically closes within several months as markets reprice the asset, according to analysts who track these metrics.
Bitcoin’s market dominance has declined in recent periods, and technical indicators including the Stochastic RSI have shown bearish crossovers, according to chart analysis. The cryptocurrency has traded near key support levels following a pullback, with price action testing support zones after breaking below a head-and-shoulders technical pattern.
Mining difficulty continues to adjust as miners respond to price fluctuations and profitability changes. The difficulty adjustment mechanism was designed to maintain steady block production regardless of network participation levels.
Technical analysts report that the next several weeks will be critical in determining whether buyers defend current price levels or whether further declines toward lower technical targets occur. If accumulation activity strengthens, the asset could attempt a recovery toward higher price levels, according to market observers. If selling pressure persists, prices could move closer to bearish pattern targets identified by technical analysts.
Energy expenses for Bitcoin mining have increased while market prices have moved in the opposite direction, creating the valuation disconnect identified by energy-based models, according to analysts who monitor production economics in the cryptocurrency mining sector.
Disclaimer: The content of this article solely reflects the author's opinion and does not represent the platform in any capacity. This article is not intended to serve as a reference for making investment decisions.
You may also like
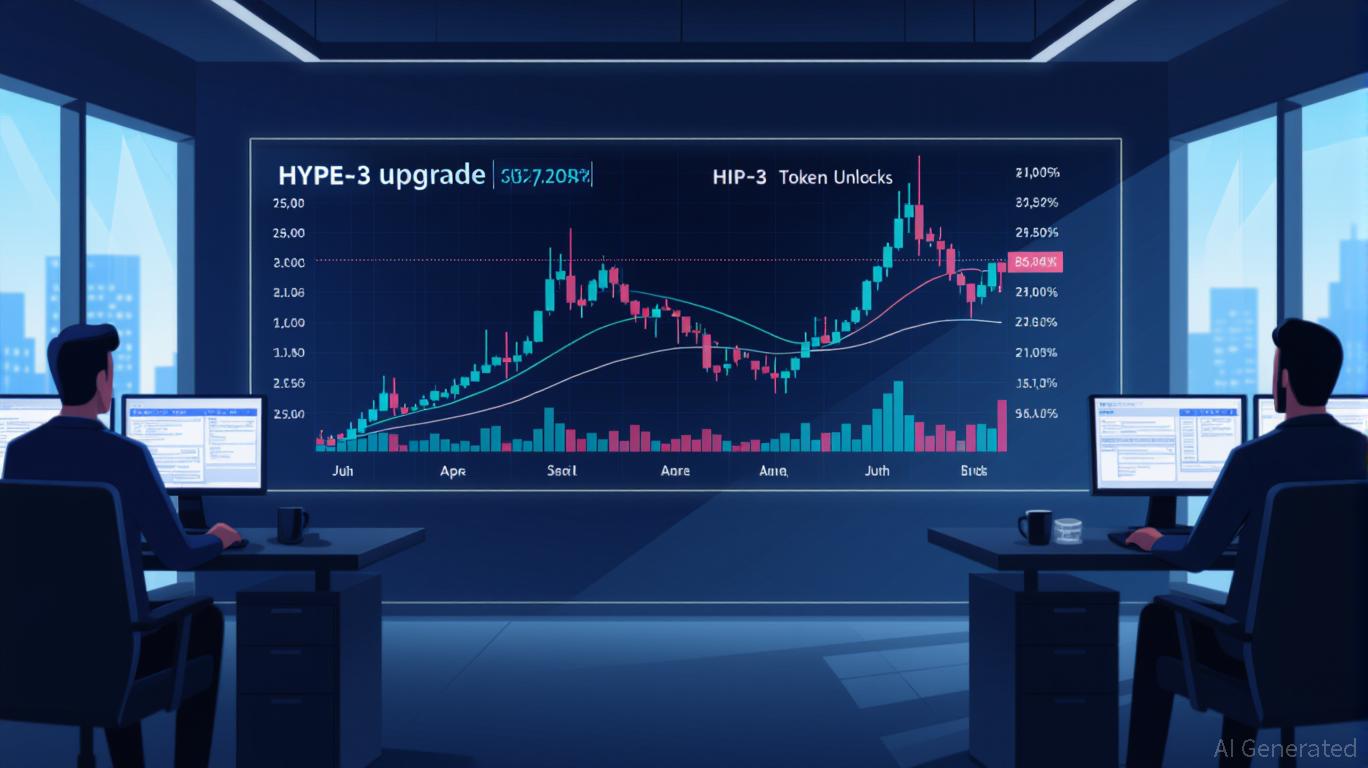
HYPE Token's Soaring Rise in November 2025: Real Worth or Just Hype-Driven Frenzy?
- Hyperliquid's HYPE token surged to $41.28 in Nov 2025, then fell to $27.43, sparking debates over genuine value vs speculative mania. - Structural upgrades (HIP-3 fee cuts) and partnerships (USDH stablecoin, Kinetiq) boosted utility, while UAE regulatory clarity attracted institutional interest. - Token unlocks ($308M-$351M) and retail-driven FOMO amplified volatility, with 23.4% of unlocked tokens sold over-the-counter. - Analysts highlight mixed signals: VanEck notes institutional accumulation and 36%
USE.com Opens Its Presale Phase as Global Demand for Next-Generation Exchanges Surges
Twenty One (XXI) launches on the NYSE with a 4 billion dollar Bitcoin treasury

The Influence of New Technologies on Investment Prospects in Higher Education
- Emerging tech reshapes workforce demands, creating investment opportunities for STEM-aligned institutions like Farmingdale State College (FSC). - FSC's $75M Computer Sciences Center and AI research projects bridge education gaps in cybersecurity, AI, and engineering through hands-on training. - Edtech platforms like Uplimit and immersive tools (AR/VR) address skill shortages, while career-connected learning models gain traction in workforce development. - Despite federal STEM funding declines, institutio