
Top 3 Price Prediction Bitcoin, Gold, Silver: Flash Reversal Signals at Key Technical Levels

Bitcoin, Gold, and Silver are testing critical support zones as early reversal signals appear across RSI, AO, and volume profiles. With BTC forming a Death Cross and XAU and XAG retracing into major liquidity clusters, traders now watch for a decisive break or bounce that could define the next market move.
Bitcoin, Gold, and Silver prices have reached major price levels where the market could soon flip direction, because early technical indicators suggest a possible reversal.
As of this writing, the prices of BTC, XAU, and XAG were testing critical support levels, amid elevated fear levels in the market and concerns over the pioneer cryptocurrency’s death cross.
Bitcoin Bulls Show Up Amid Death Cross Fears
Throughout the past weekend, crypto traders and investors discussed the death cross, a technical formation on the BTC/USDT trading pair that is expected to determine Bitcoin’s next directional bias.
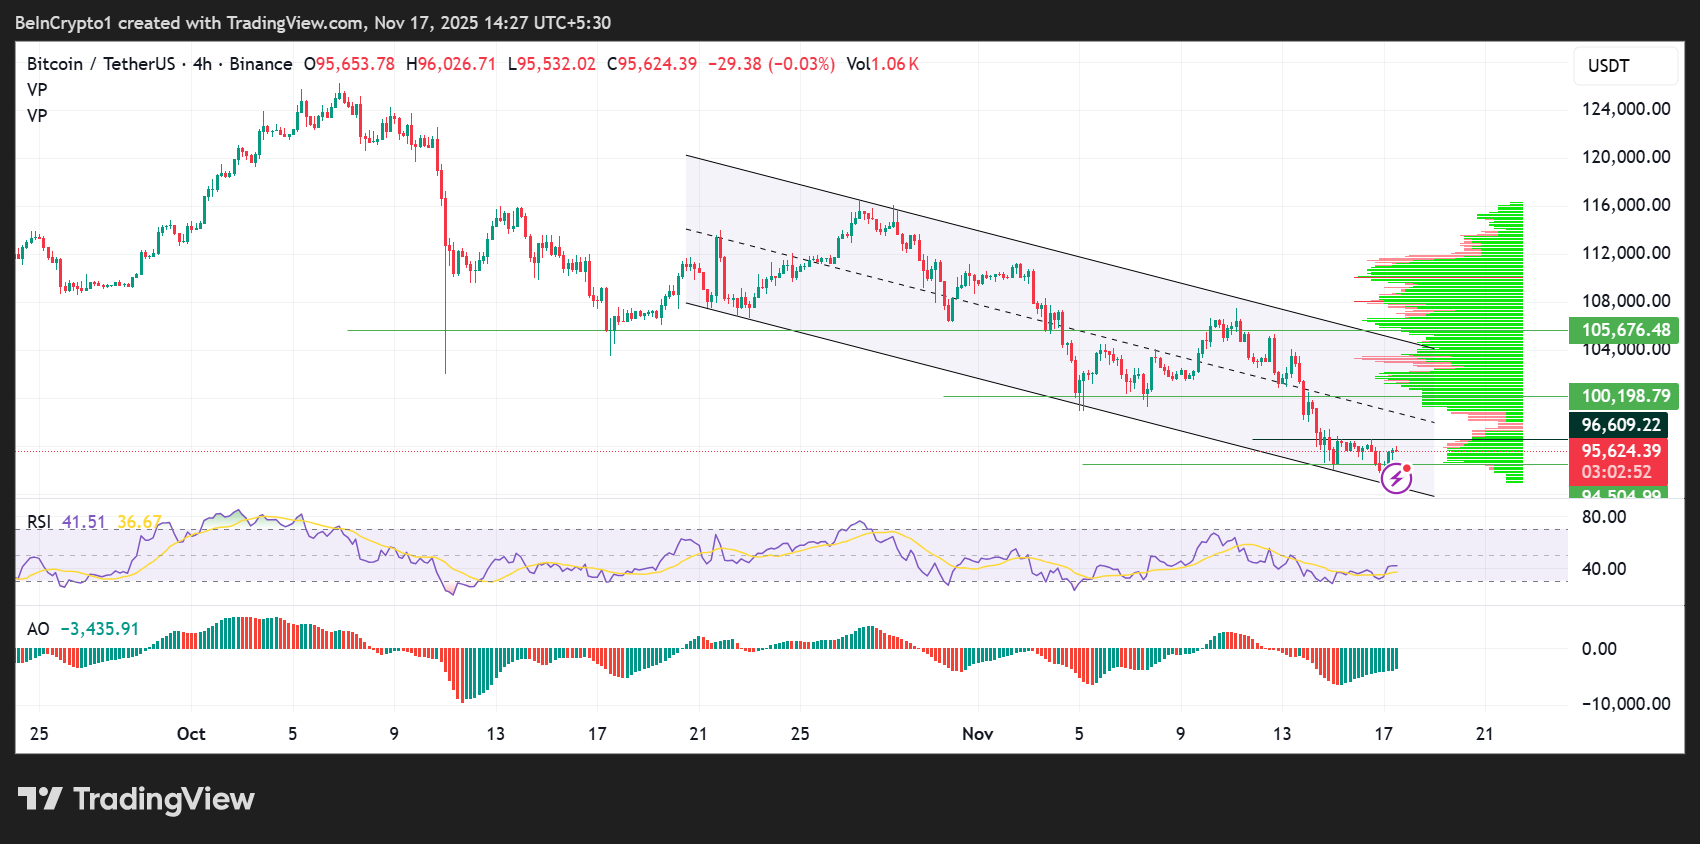
Bitcoin was trading for $95,624 as of this writing, continuing its descent within a well-defined descending channel that has governed price action since early October.
Each attempt to break above the upper boundary has failed, and the price is now testing the lower channel support. The consolidation at current levels suggests that BTC is preparing for a decisive move.
The Volume Profile highlights a major liquidity cluster at $100,000–$105,600, which could present an overhead resistance. However, with the green horizontal bars representing bullish volume profiles, bulls are waiting to interact with the BTC price in these areas. Such bullish dominance could see the pioneer crypto.
BTC repeatedly rejected the $100,200 level, signaling strong sell pressure from trapped longs and larger players distributing near the psychological six-figure mark.
The RSI (Relative Strength Index) at 41 indicates bearish momentum, but with the potential for bullish divergence forming as the price nears the channel bottom. The Awesome Oscillator (AO) remains negative but is moderating, indicating weakening downside strength. This is a typical precursor to a relief rally.
 Bitcoin (BTC) Price Performance. Source:
TradingView
Bitcoin (BTC) Price Performance. Source:
TradingView
Immediate support lies at $94,504, marking the lower boundary of the channel. A breakdown risks a deeper decline toward $92,000–$90,000, where the next VPVR (Volume Profile Visible Range) support band sits.
However, if bulls defend this zone and force a rebound, BTC could overcome the immediate resistance at $98,000, followed by the critical breakout zone at $100,198.
The next major trend shift hinges on whether Bitcoin holds the channel support. A confirmed breakout above $100,000–$102,000 would signal a bullish trend shift, while a breakdown risk accelerates the downtrend.
Gold Needs to Fill the Imbalance due to the FVG
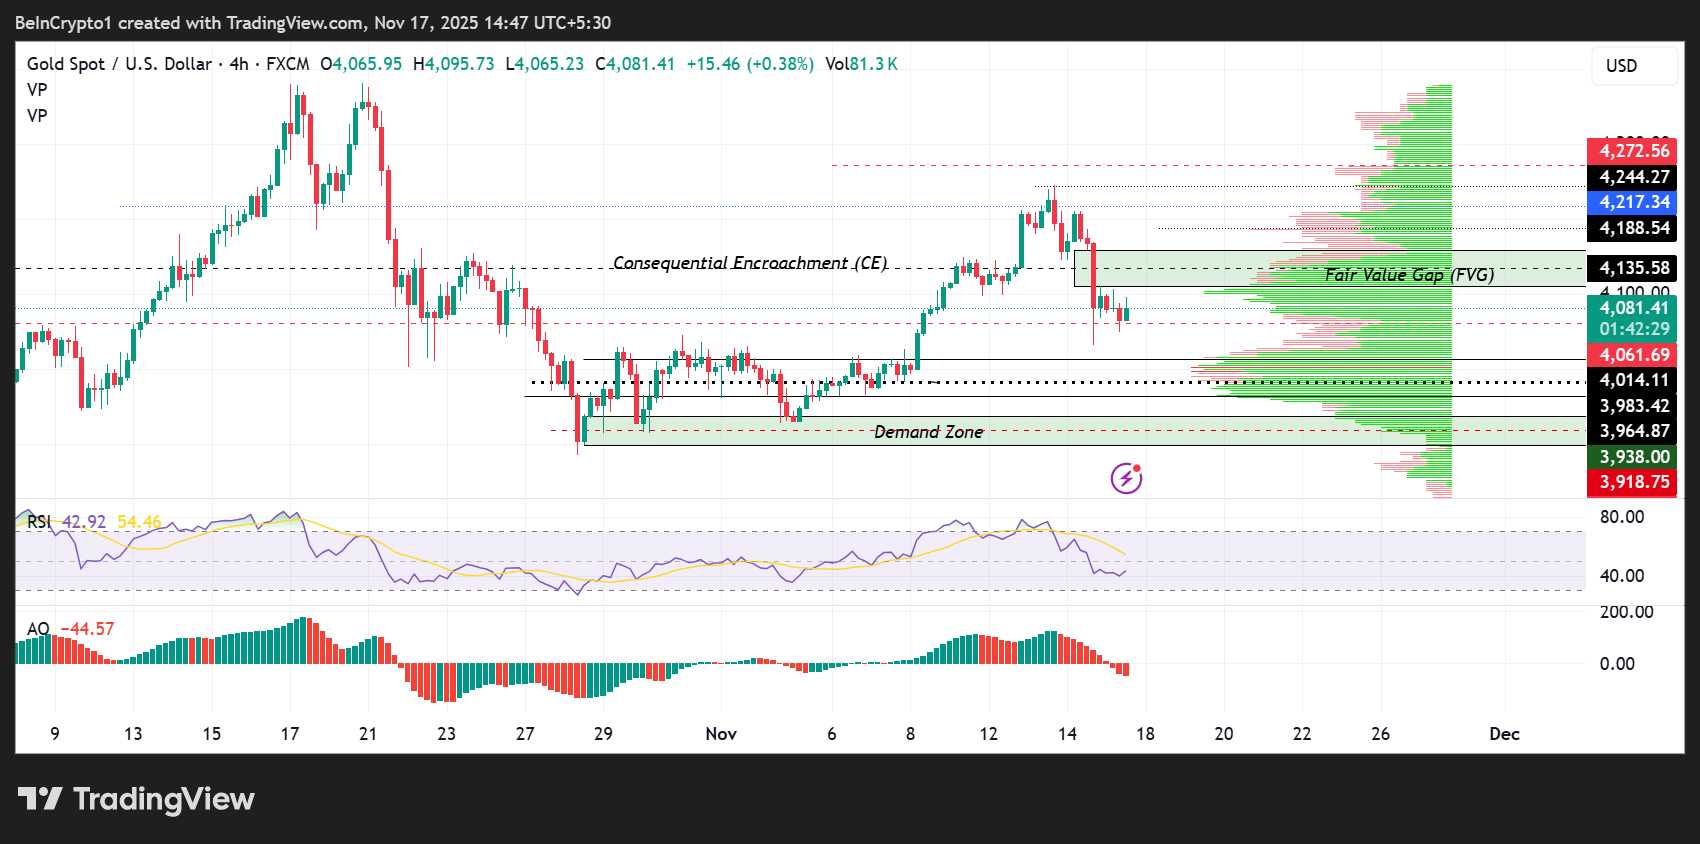
Gold trades near $4,081, consolidating after a brief price drop on November 14, as indicated by the long red candlestick. This drop resulted in a Fair Value Gap (FVG) of approximately $4,135–$4,188, representing an inefficiency in the XAU/USD market that needs to be addressed.
The chart shows a textbook example of a supply overhang, where bearish volume profiles (red horizontal bars) overlap with the midline of the FVG (Consequential Encroachment or CE) at $4,135.
A break and close above this midline on the 4-hour timeframe will confirm the continuation of the uptrend.
The gold price is now trading at $4,081, with bullish volume profiles (green horizontal bars) overhanging above it, indicating XAU is in the hands of the bulls. This adds credence to the thesis that the gold price could extend its rally to fill the imbalance due to the FVG.
 Gold (XAU) Price Performance. Source:
TradingView
Gold (XAU) Price Performance. Source:
TradingView
Beneath this sits a deeper Demand Zone at $3,983–$3,938, which historically attracted strong buying. If the price dips into this zone, a sharp bullish reaction is likely.
Momentum remains soft. The RSI at 42 is attempting a mild recovery but remains below the equilibrium level, indicating sellers still dominate.
The AO is deeply negative, confirming ongoing bearish momentum, although the histogram bars are shrinking, showing early signs of exhaustion.
For upside continuation, gold must reclaim the FVG at $4,135. A clean break and candle close above this zone would signal a bullish continuation toward $4,188 and the macro resistance at $4,244–$4,272. Conversely, failure to hold $4,061 risks a slide into the demand zone before any recovery.
Silver Risks Losing Support Due to the Trendline
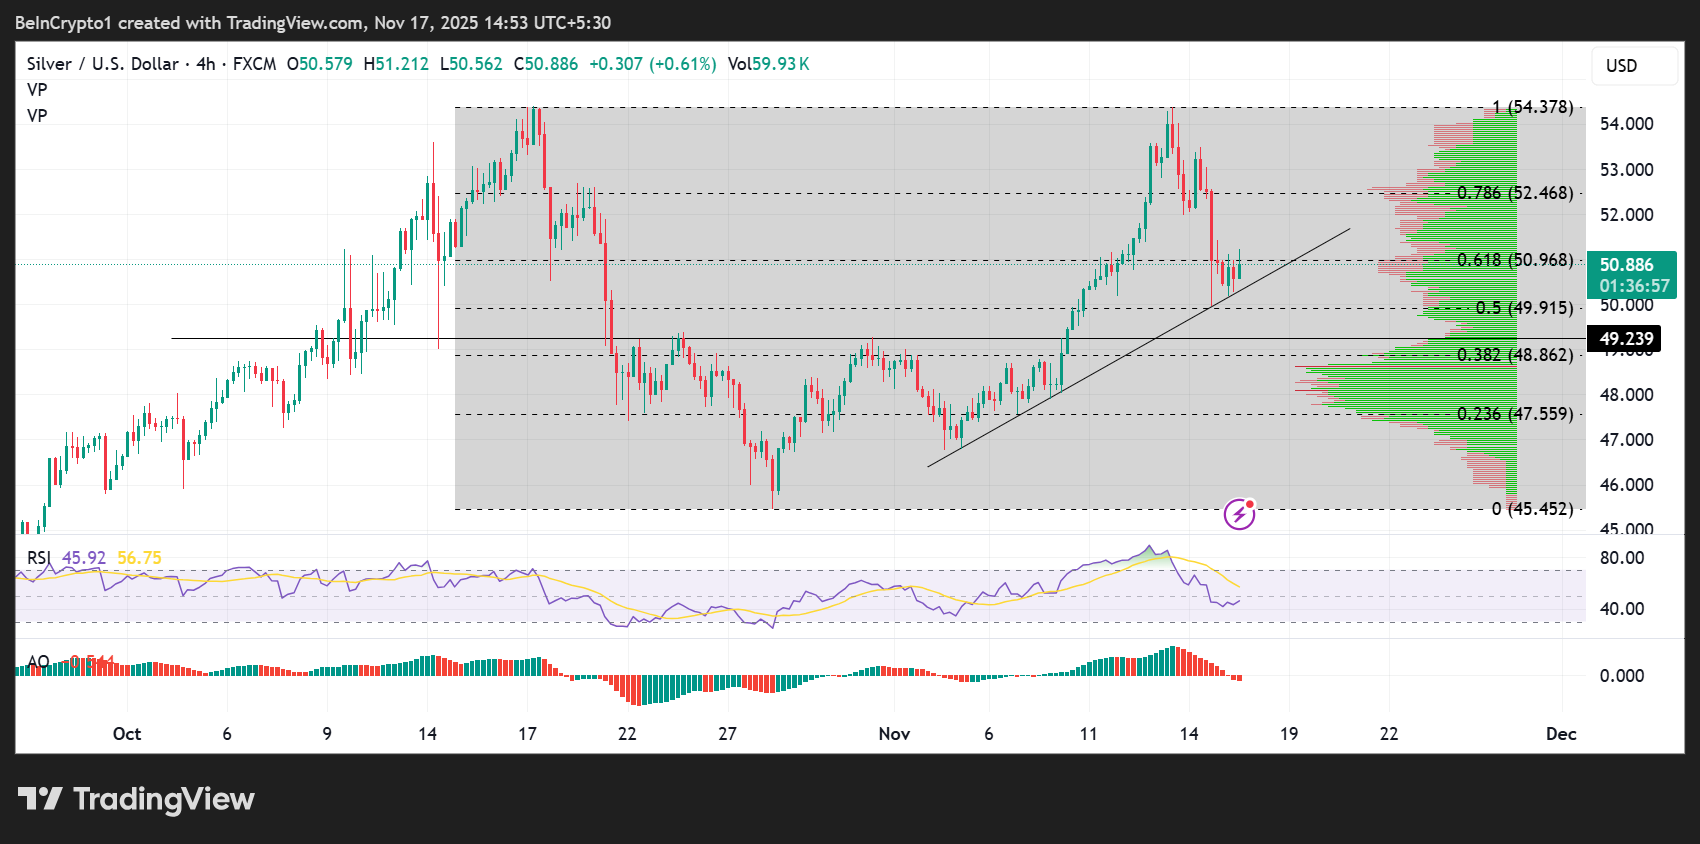
Silver is currently trading around $50.88, attempting to stabilize after a sharp pullback from the recent high at $54.37.
The correction found temporary support near the 61.8% Fibonacci retracement at $50.96, which has now turned into resistance, aligning with a rising trendline of support. This suggests buyers and sellers are defending this zone aggressively.
The Volume Profiles show a heavy node between $49.80–$51.20, indicating high liquidity and strong interest; this zone acts as a magnet for price.
A decisive close above the 61.8% Fibonacci retracement level could open the door back toward the 78.6% Fibonacci level at $52.46 and ultimately retest $54.37.
 Silver (XAG) Price Performance. Source:
TradingView
Silver (XAG) Price Performance. Source:
TradingView
However, a breakdown below the trendline would expose key supports at the 50% midrange of the Fibonacci indicator, at $49.91, and the 38.2% Fibonacci retracement level, at $48.86, both of which sit within strong previous consolidation.
Momentum indicators lean neutral-bearish. The RSI at 45 indicates a recovery attempt but remains below its midline, suggesting indecision following recent selling pressure.
The Awesome Oscillator is printing red bars, hinting that bearish momentum remains in control but is weakening.
Overall, silver is at a critical support, where bulls must hold the trendline. A bounce from here could fuel a new rally, while a breakdown risks a deeper correction toward $48–$49.
Disclaimer: The content of this article solely reflects the author's opinion and does not represent the platform in any capacity. This article is not intended to serve as a reference for making investment decisions.
You may also like
Dogecoin Latest Updates: Crypto ETF Boom Begins with 21Shares Launching Enhanced Dogecoin Exposure
- 21Shares launches leveraged Dogecoin ETF, doubling daily returns, following its FalconX merger to expand institutional crypto access. - The product joins a surge of U.S. altcoin ETFs like Grayscale's Dogecoin Trust, signaling growing institutional confidence in crypto assets. - FalconX's $8B-asset acquisition of 21Shares combines trading infrastructure with ETP innovation, aiming to accelerate digital asset adoption globally. - Analysts highlight leveraged ETFs' appeal to sophisticated investors despite
Bitcoin News Update: Whale's $28.7 Million Profit Highlights Leverage Issues in Crypto
- A crypto whale earned $28.7M via a 20x leveraged short as Bitcoin fell 29% from $126K to $90K. - Market turmoil saw $2.9B ETF outflows and $19B in liquidations during October's "black Friday" volatility. - Leveraged trading amplified Bitcoin's decline, erasing $1.2T in value through cascading margin calls. - Institutional leverage via derivatives and $74B in crypto loans deepened systemic risks during the selloff. - Analysts warn of ongoing liquidation risks as Bitcoin nears $91K with whale selling inten
Bitcoin Updates: The HODL Barrier Faces a Crucial Moment—Bitcoin’s $95,000 Challenge May Determine the Path Toward $85,000
- Bitcoin's drop below $100,000 tests the $95,000 HODL wall, where 65% of invested USD remains concentrated. - Sharp sell-offs ($655M liquidations) and ETF outflows ($961M since Nov) expose fragile market structure. - STHs hold 30% of LTH supply above $95,000, with 80% of recent sales at a loss as profit-loss ratios fall below 0.21. - A break below $95,000 could trigger a path to $85,000, contrasting with 2022's sharper $45K-to-$36K collapse. - LTH resolve determines whether the HODL wall stabilizes or acc
Internet Computer (ICP) Price Soars: An In-Depth Look at the Forces Driving the Surge
- Internet Computer (ICP) surged over 6% in 2025, driven by institutional partnerships, infrastructure upgrades, and speculative trading. - TVL hit $237B via DeFi growth, while Fission/Chain Fusion upgrades boosted scalability and cross-chain interoperability with Bitcoin/Ethereum. - November 2025 saw 261% transaction volume spike, but DApp engagement fell 22.4%, highlighting adoption gaps despite technical progress. - Speculative fervor and AI platform Caffeine's launch fueled momentum, though security ri