Bitcoin Slides Toward $95,000, Long-Term Metrics Say ‘Undervalued’

Bitcoin nears a decisive point as bearish divergence forms and valuation metrics turn undervalued. BTC prepares for either breakdown or reversal.
Bitcoin is trading near $95,000 after a steady decline that erased recent gains and pushed the crypto king toward a crucial psychological level.
The market now waits for investors to make the next decisive move, one that could determine whether BTC rebounds or extends its downward trajectory in the coming days.
Bitcoin Faces Bearish Divergence
Bitcoin’s dominance has been falling for weeks, creating a clear bearish divergence with the Stochastic RSI. Dominance now sits at 59.37%, down from 65.71% in June. At the same time, the Stoch RSI recorded a bearish crossover as the D line moved above the K line, signaling a shift in market strength.
This divergence, paired with RSI entering overbought territory earlier, signals weakening bullish momentum. Historically, such conditions often precede price reversals or notable corrections. With dominance slipping and momentum softening, traders face increased uncertainty about Bitcoin’s ability to hold support at current levels.
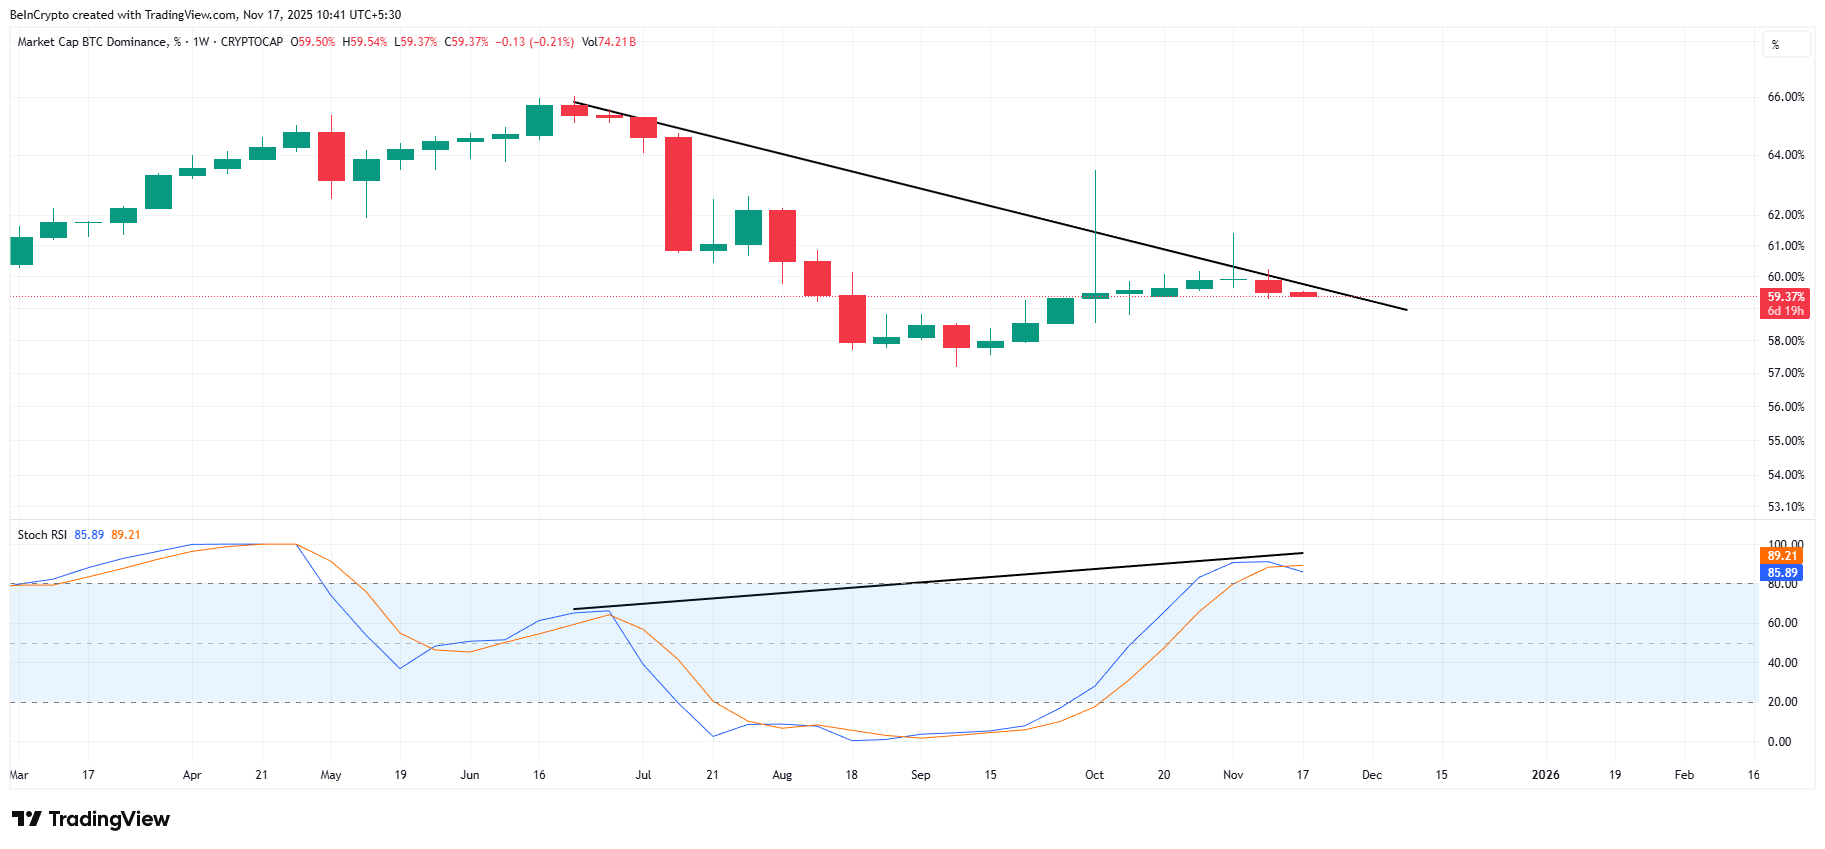 Bitcoin Dominance. Source:
TradingView
Bitcoin Dominance. Source:
TradingView
Bitcoin’s MVRV Z-Score has dropped to a 14-month low, indicating the asset is undervalued relative to historical norms. This metric evaluates when Bitcoin is trading above or below its fair value. At present, the indicator suggests BTC is firmly in undervalued territory, which has often marked major accumulation phases.
When the MVRV Z-Score hits similar lows, long-term investors typically begin accumulating. This behavior supports price recovery as fresh demand enters the market. If accumulation increases at current levels, Bitcoin could gain the momentum needed to stabilize and reverse its recent downtrend.
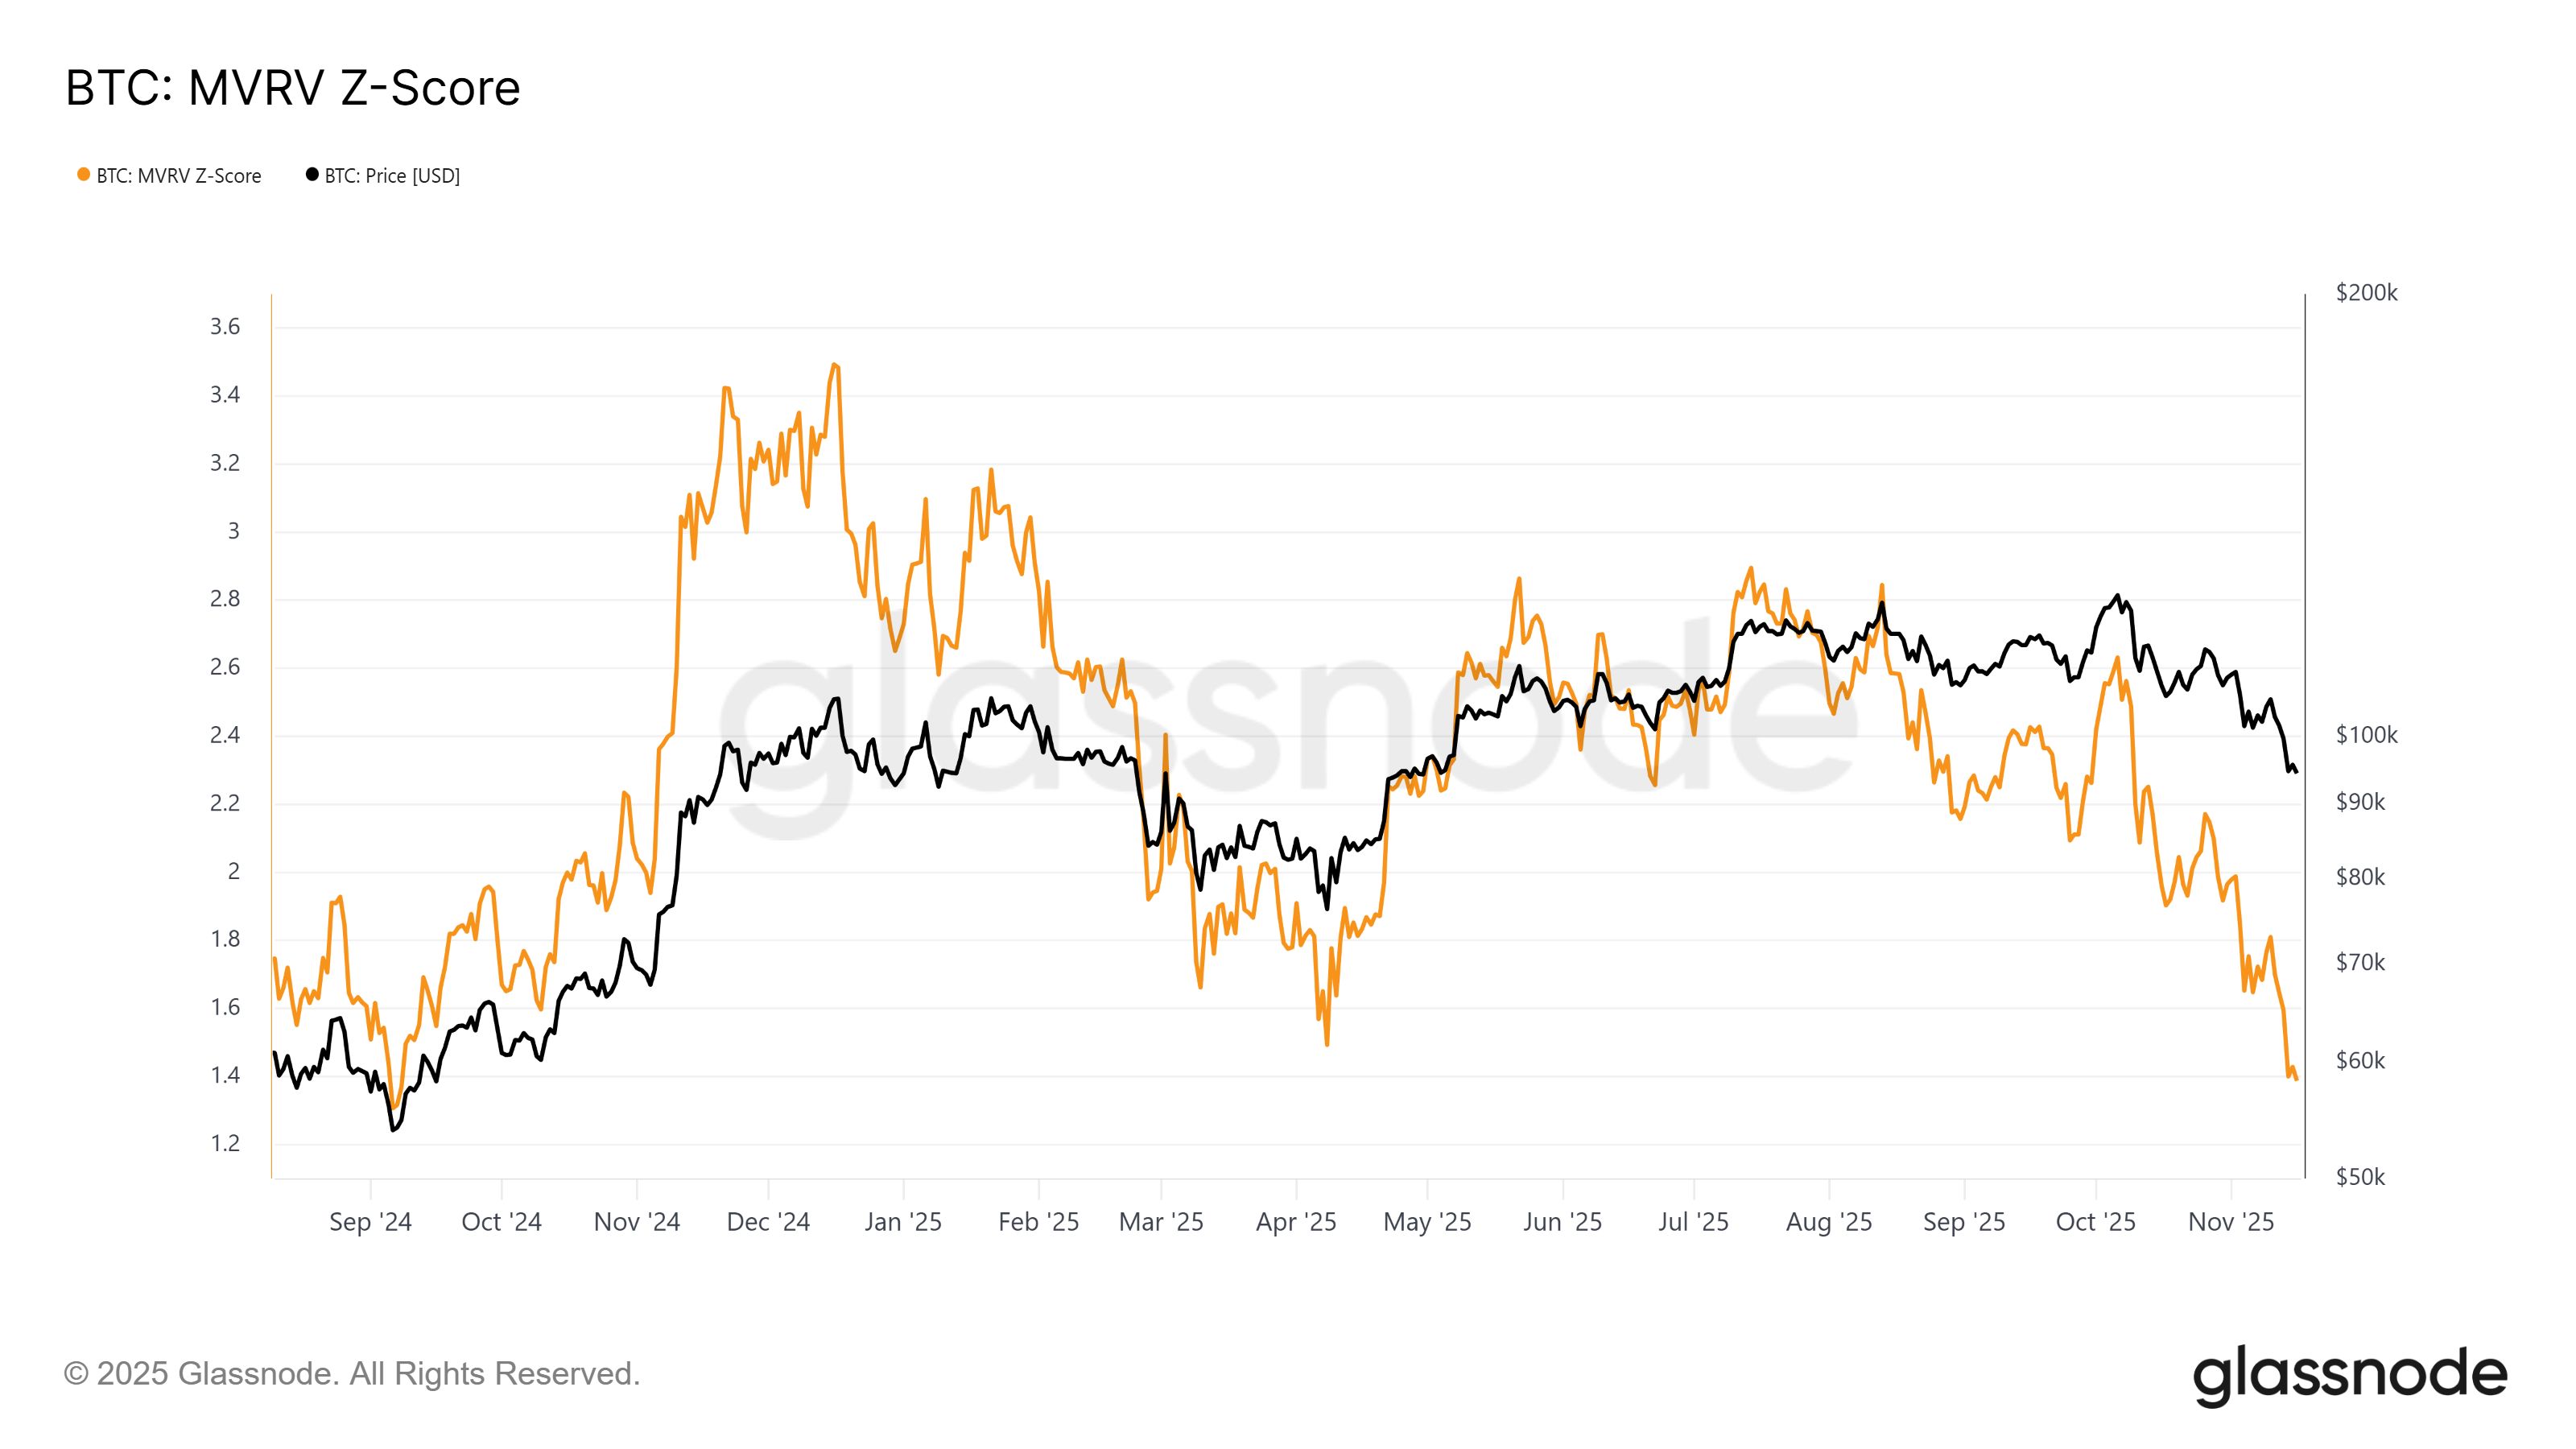 Bitcoin MVRV Z-Score. Source:
Glassnode
Bitcoin MVRV Z-Score. Source:
Glassnode
Can Bitcoin Price Make a Reversal?
Bitcoin trades at $95,040, hovering around a crucial psychological level. The decline intensified after BTC broke below a head and shoulders pattern last week. This breakdown has fueled bearish expectations.
The head and shoulders pattern points to a 13.6% decline, placing the target at $89,407. If investors remain bearish, Bitcoin could slip toward $90,000 and eventually reach the projected target. The combination of falling dominance and bearish crossovers strengthens the case for this downside move.
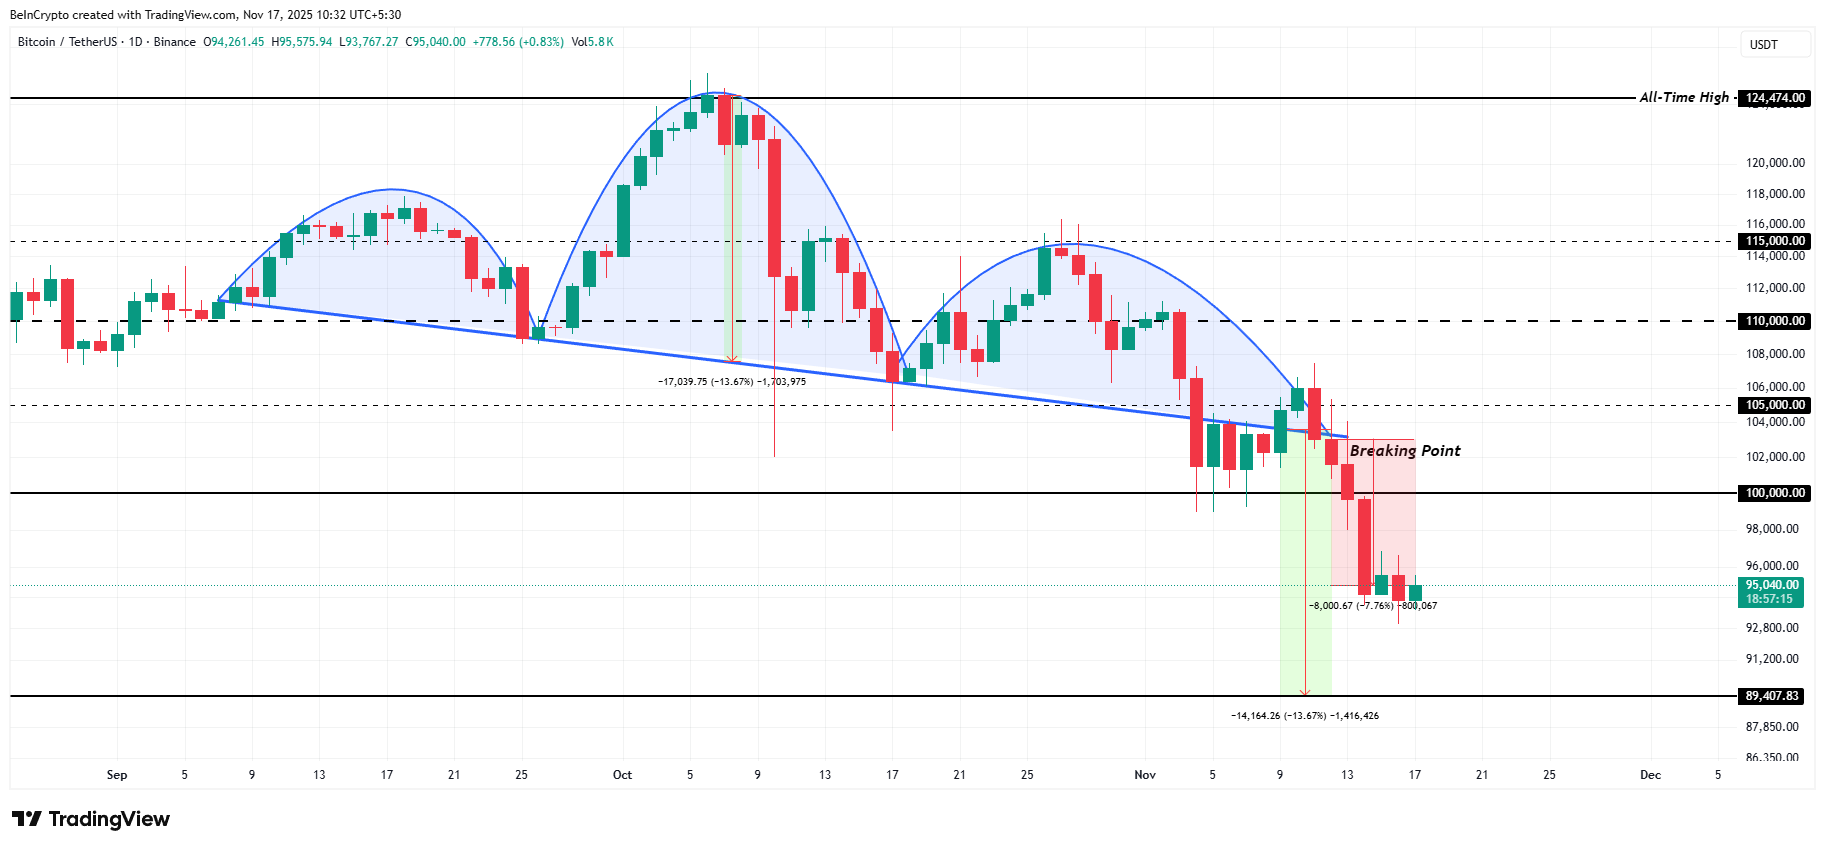 Bitcoin Price Analysis. Source:
TradingView
Bitcoin Price Analysis. Source:
TradingView
However, if investors step in and accumulate at undervalued levels, Bitcoin could rebound toward $100,000. A successful recovery would invalidate the bearish thesis and result in a reversal, pushing the price closer to $105,000. This move would also invalidate the head and shoulders pattern.
Disclaimer: The content of this article solely reflects the author's opinion and does not represent the platform in any capacity. This article is not intended to serve as a reference for making investment decisions.
You may also like
EU introduces new crypto data-sharing rules for crypto-asset service providers

Trust Wallet integrates Apple Pay to streamline cryptocurrency purchases

Crypto ETP provider Bitcoin Capital launches a BONK ETP on SIX Swiss Exchange

Arthur Hayes Wagers on DeFi Returns Amid Rising Institutional Embrace of Crypto
- Arthur Hayes, ex-BitMEX CEO, acquired 2.01M ENA , 218K PENDLE, and 33K ETHFI tokens in 30 minutes, signaling strategic DeFi yield focus. - Recent ENA trades show Hayes bought $245K worth after selling $1.38M earlier, highlighting his liquidity provider role in volatile markets. - U.S. SEC's Bitcoin ETF approval and Abu Dhabi's Ripple stablecoin adoption reflect growing institutional crypto infrastructure and regulatory clarity. - Experts caution single-address activity may not represent broader trends, u