Date: Tue, Oct 14, 2025 | 10:30 AM GMT
The cryptocurrency market is once again turning lower after showing brief signs of recovery on Monday that lifted Ethereum (ETH) to a 24-hour high of $4,292, before sliding back into the red near $3,950 today.
Following this reversal, several altcoins are also flashing bearish setups — including Celestia (TIA), which, despite trading slightly in green, has confirmed a bearish breakdown from a key technical pattern that could shape its next move.
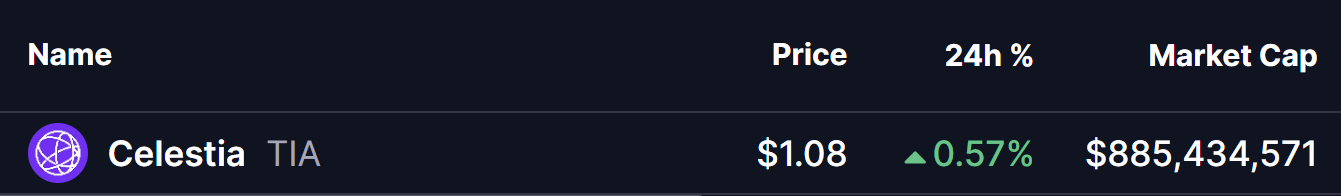 Source: Coinmarketcap
Rising Wedge Breakdown
On the 1-hour chart, TIA had been moving within a rising wedge pattern, a classic bearish reversal formation that typically develops when price action shows higher highs and higher lows within narrowing trendlines — signaling weakening momentum.
After facing repeated rejections along the wedge’s upper resistance line, TIA eventually broke below the key support zone near $1.15, confirming a technical breakdown. This shift triggered increased selling pressure and dragged the token down toward the $1.08 region.
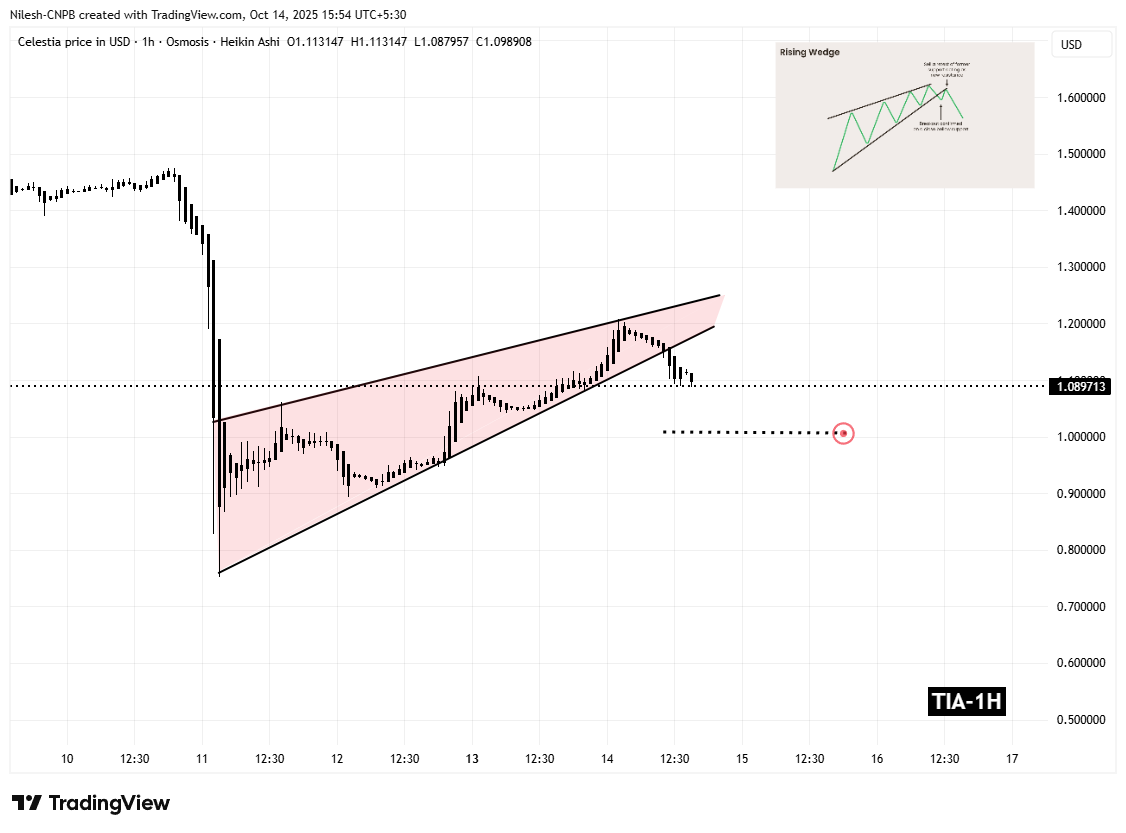 Celestia (TIA) 1H Chart/Coinsprobe (Source: Tradingview)
The breakdown marks a notable change in structure, suggesting that short-term bullish momentum has faded.
What’s Next for TIA?
If buyers fail to reclaim the $1.15 level, the breakdown could remain intact and pave the way for a deeper move toward $1.00, aligning with the measured target of the wedge pattern.
However, if bulls manage to push prices back above $1.15, a short-term relief rally could unfold — although the overall outlook would stay cautious unless TIA reclaims the wedge structure convincingly.
For now, the bias remains bearish.