Hedera (HBAR) Price Awaits a Break to Escape Sideways Trap

Hedera’s HBAR token remains range-bound with weakening volatility. Traders await a breakout from the $0.2109–$0.2237 trap for direction.
Since September 1, Hedera Hashgraph’s native token HBAR has been locked in a sideways trading pattern. It has repeatedly faced resistance at $0.2237 while finding reliable support at $0.2109.
Now trading at the $0.2202 mark, the weakening volatility across its spot market signals that price stagnation could continue in the near term. The key question is: What does this mean for HBAR holders?
HBAR in Balance — Neither Bulls Nor Bears Can Take Control
Readings from the HBAR/USD one-day chart show the token’s flattening Relative Strength Index. This indicates a relative balance between buying and selling pressures, with neither bulls nor bears having managed to take control. As of this writing, the RSI stands at 43.77.
For token TA and market updates: Want more token insights like this? Sign up for Editor Harsh Notariya’s Daily Crypto Newsletter.
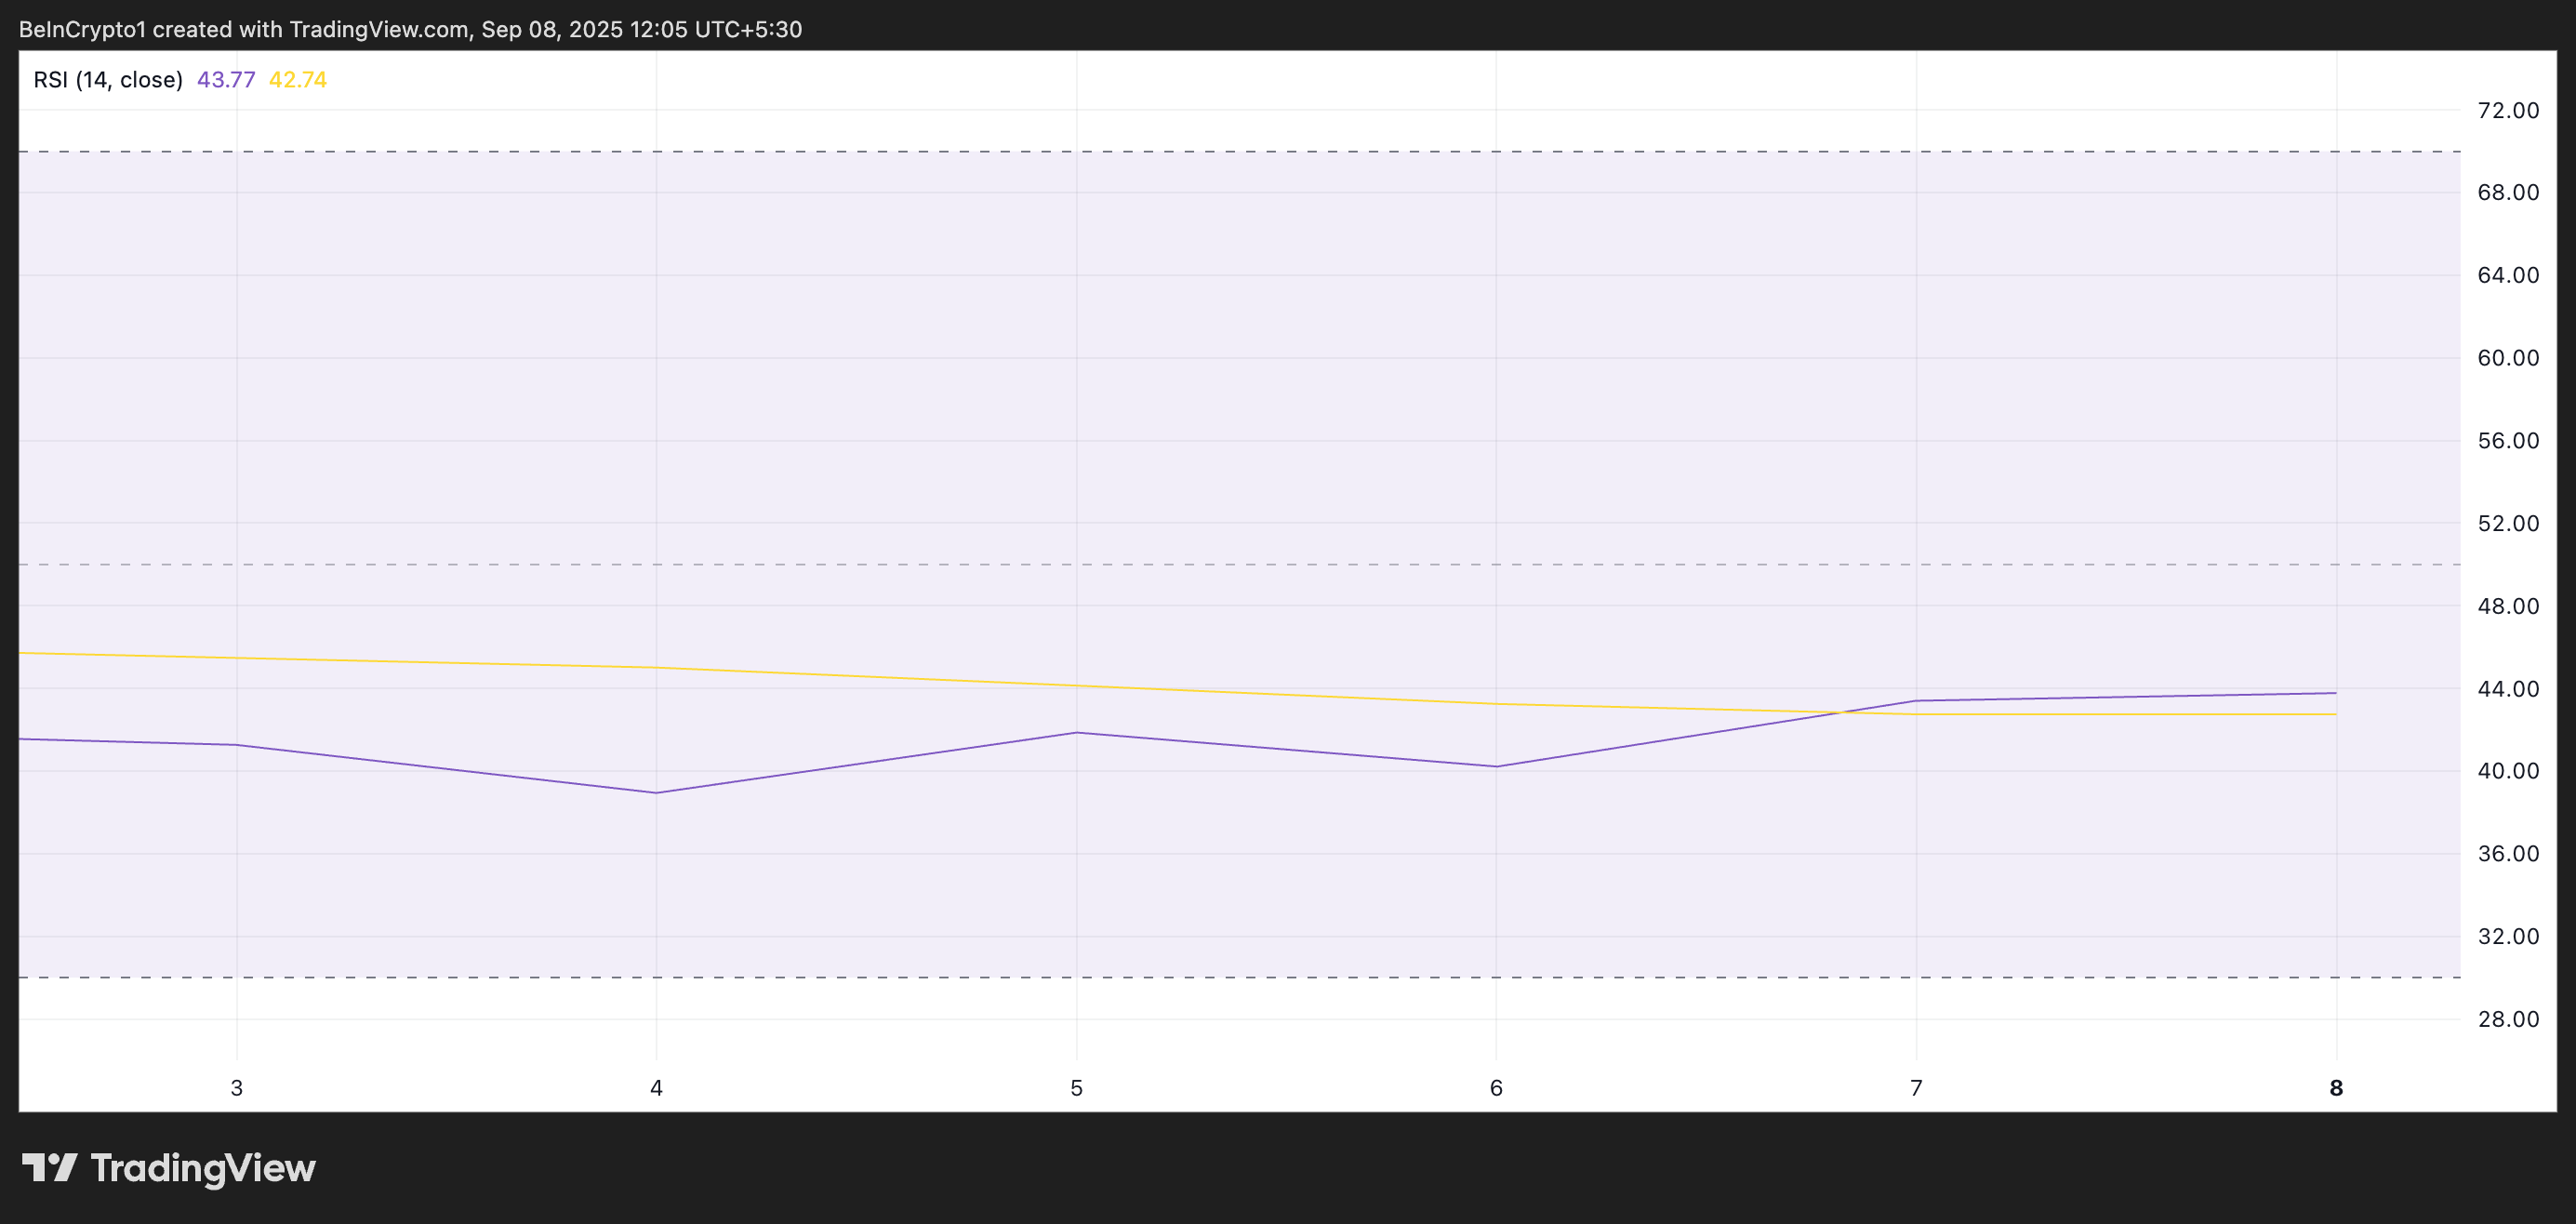 Hedera RSI. Source:
TradingView
Hedera RSI. Source:
TradingView
The RSI indicator measures an asset’s overbought and oversold conditions. It ranges between 0 and 100, with values above 70 indicating that the asset is overbought and due for a pullback. On the other hand, RSI readings below 30 suggest that the market is oversold and a rebound is on the horizon.
A flat RSI like this indicates the market lacks strong conviction in either direction. This pattern signals that HBAR traders are hesitant to commit to significant buy or sell positions and are waiting for a catalyst.
Furthermore, HBAR’s Average True Range (ATR) has been steadily declining since August 3, reflecting a steady drop in market volatility. At press time, it sits at 0.0122.
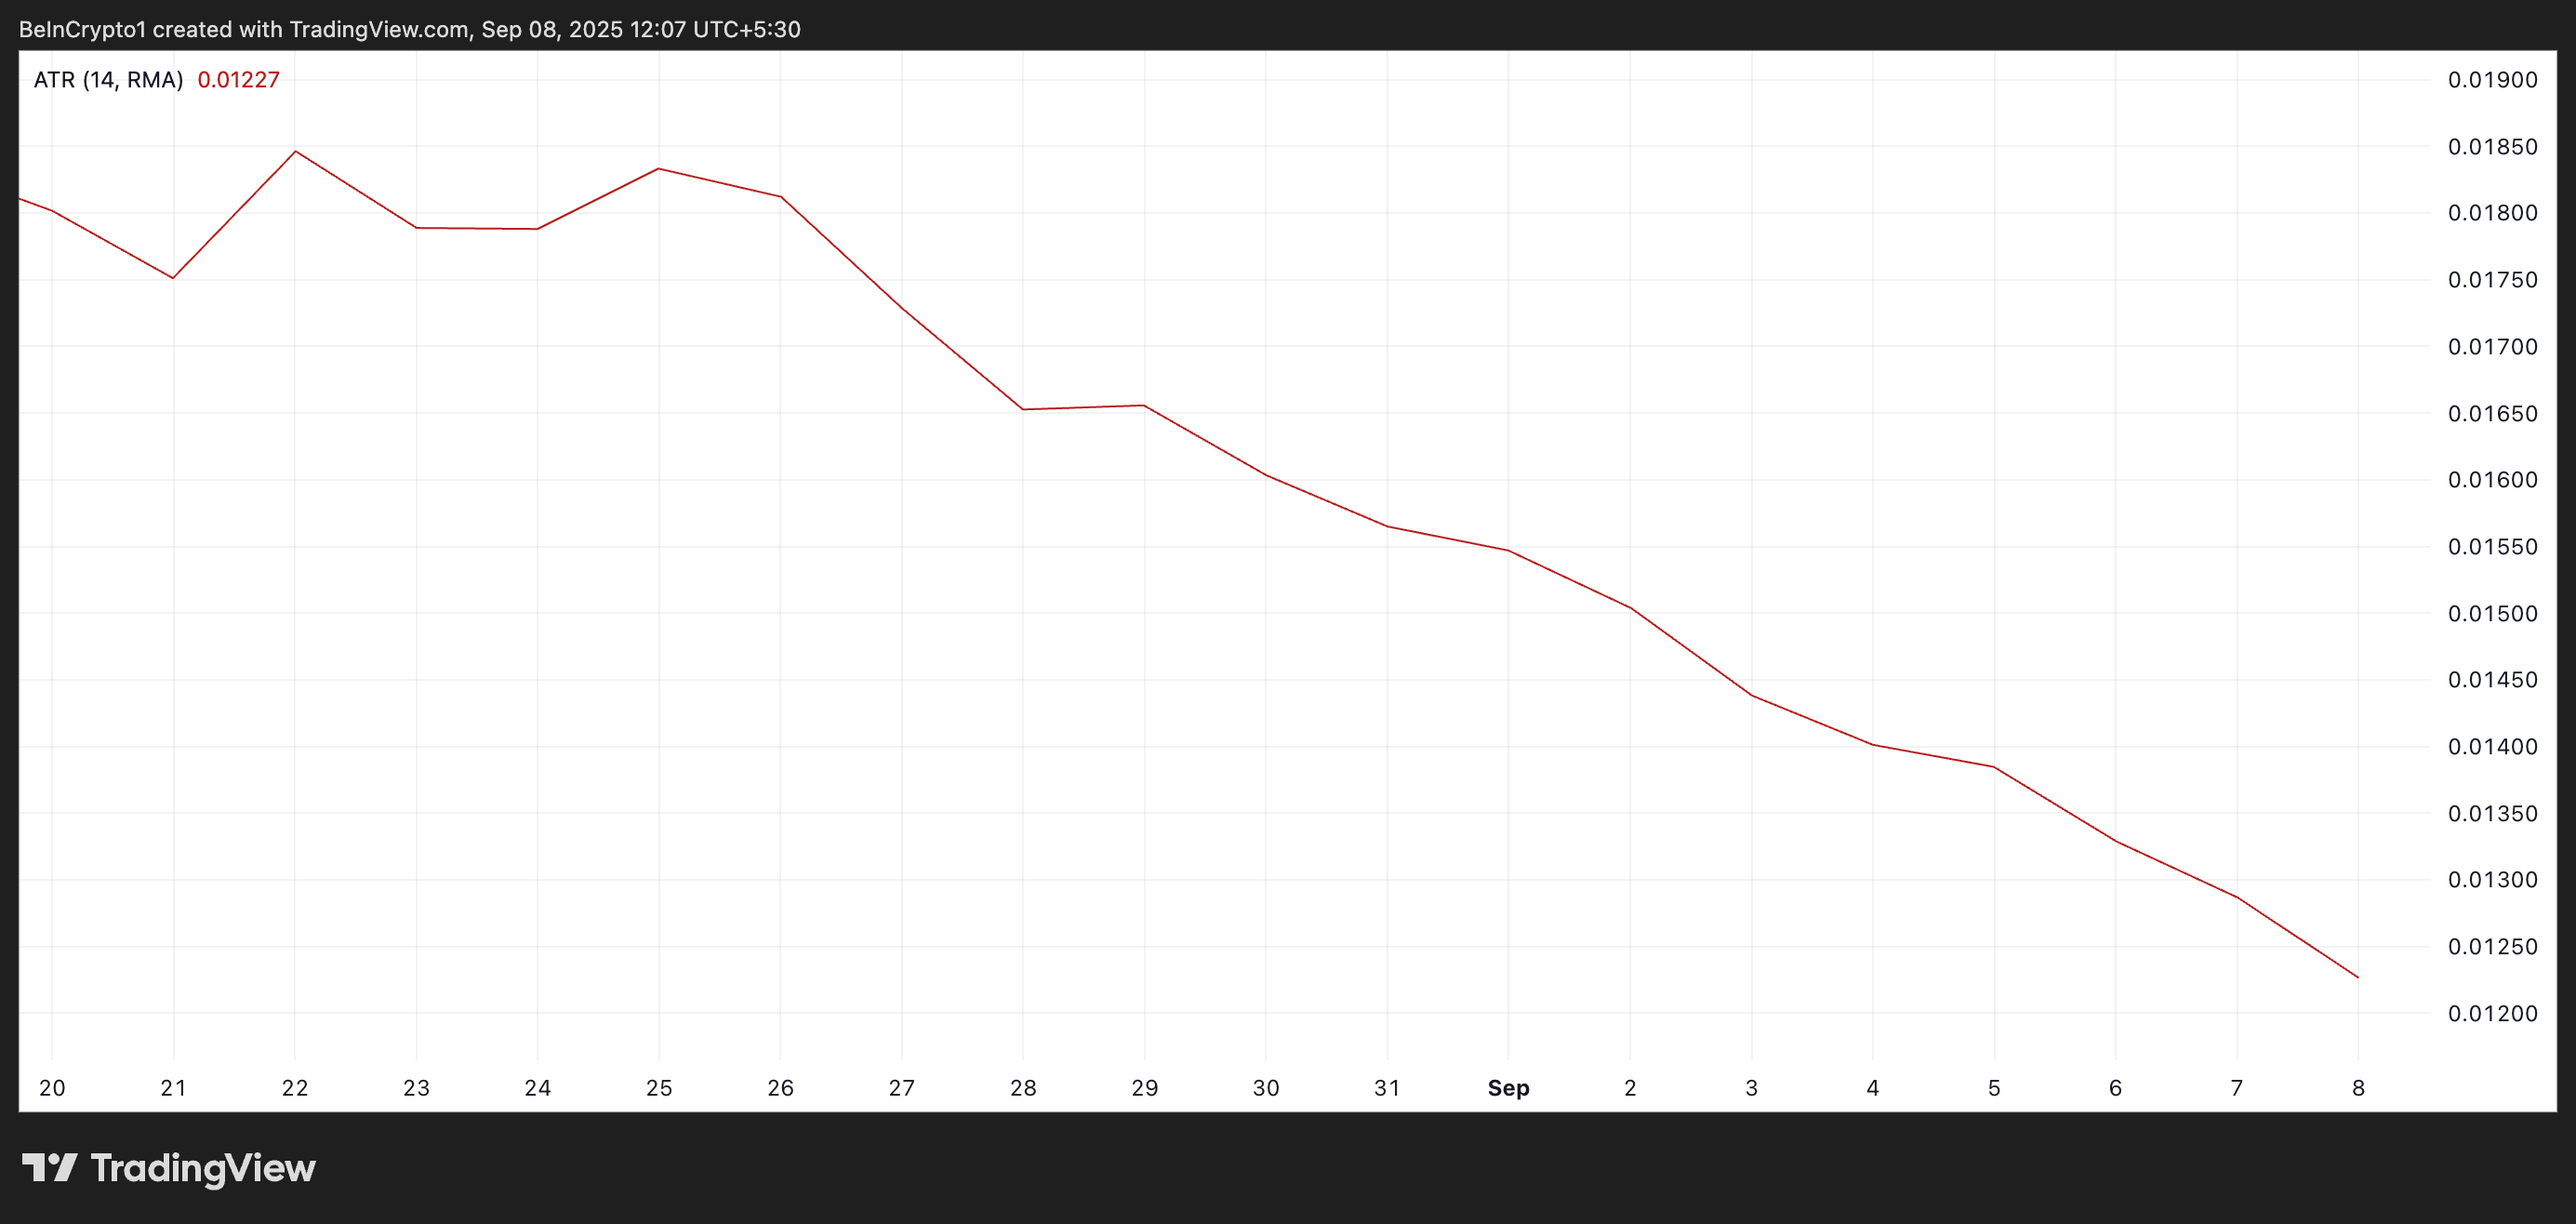 Hedera ATR. Source:
TradingView
Hedera ATR. Source:
TradingView
The ATR tracks the degree of price movement over a set period. When the indicator climbs, it signals widening price swings and heightened market activity. Conversely, when the ATR declines, it points to shrinking fluctuations and a lack of market momentum.
This puts HBAR at risk of extended sideways movements unless fresh catalysts emerge.
Will Bulls Push Higher or Bears Drag Lower?
HBAR’s falling volatility reflects a lackluster trading environment, as the token shows little energy to push beyond its established $0.2109–$0.2237 range. If demand rockets, and HBAR breaks above the $0.2237 resistance, its price could climb toward $0.2368.
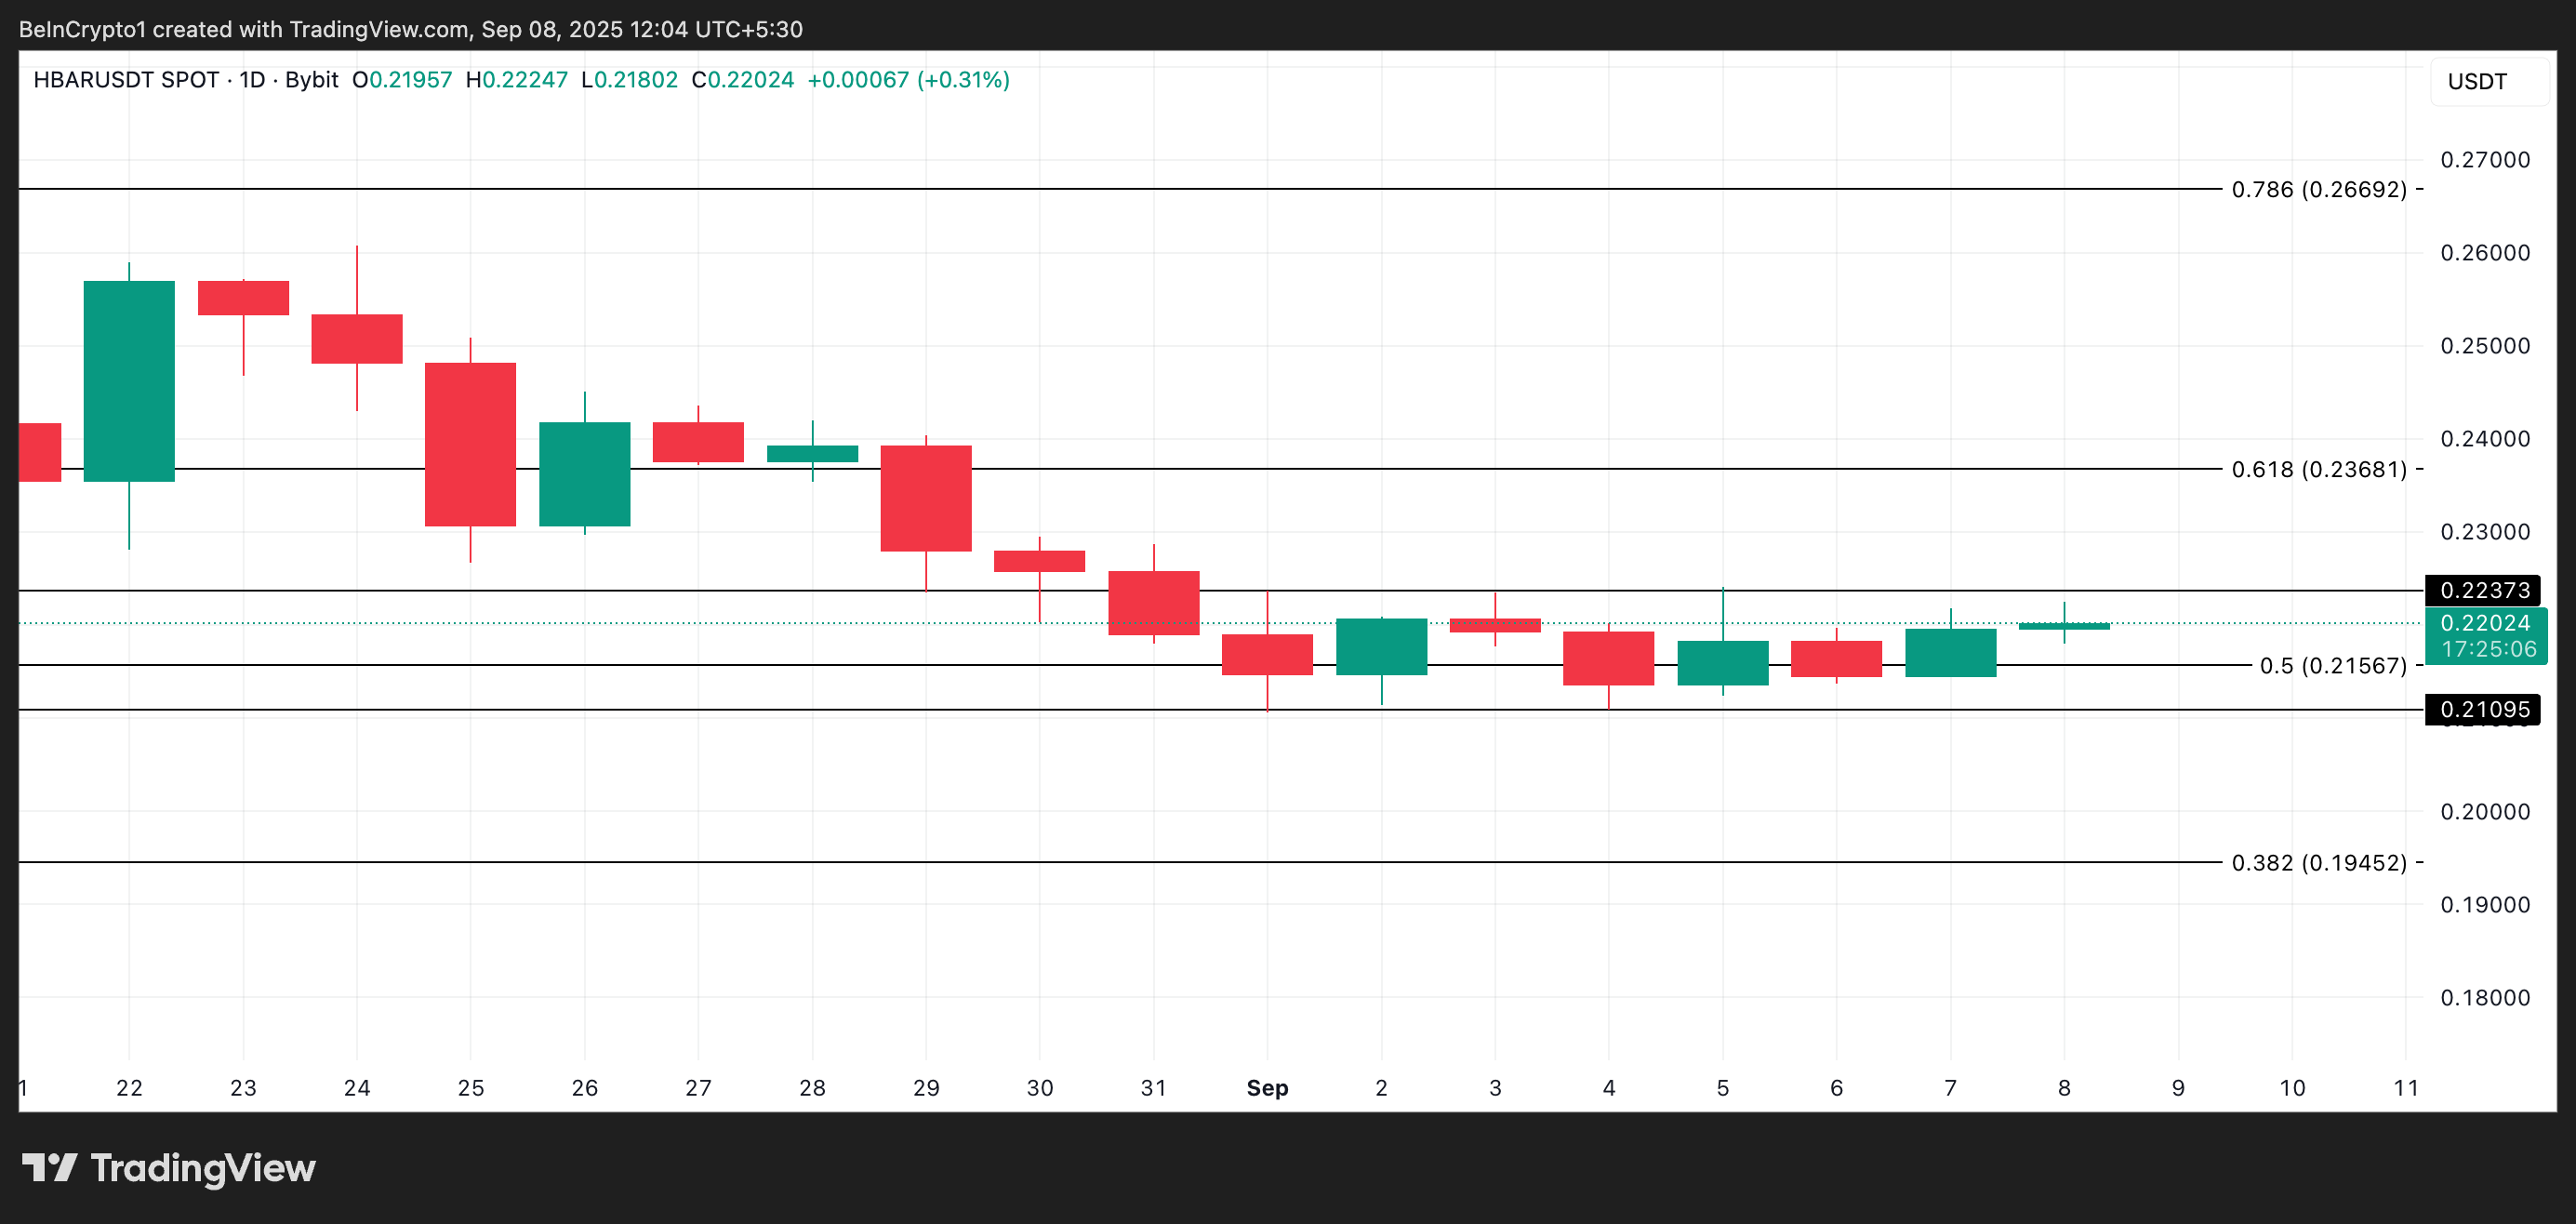 Hedera Price Analysis. Source:
TradingView
Hedera Price Analysis. Source:
TradingView
However, if a bearish trend drives a breach of the $0.2109 support level, the token’s price could plunge to $0.1945.
Disclaimer: The content of this article solely reflects the author's opinion and does not represent the platform in any capacity. This article is not intended to serve as a reference for making investment decisions.
You may also like
Stacks Nakamoto Upgrade
STX has never missed out on market speculation surrounding the BTC ecosystem, but previous hype was more like "castles in the air" without a solid foundation. After the Nakamoto upgrade, Stacks will provide the market with higher expectations through improved performance and sBTC.
Do Kwon Wants Lighter Sentence After Admitting Guilt

Bitwise Expert Sees Best Risk-Reward Since COVID
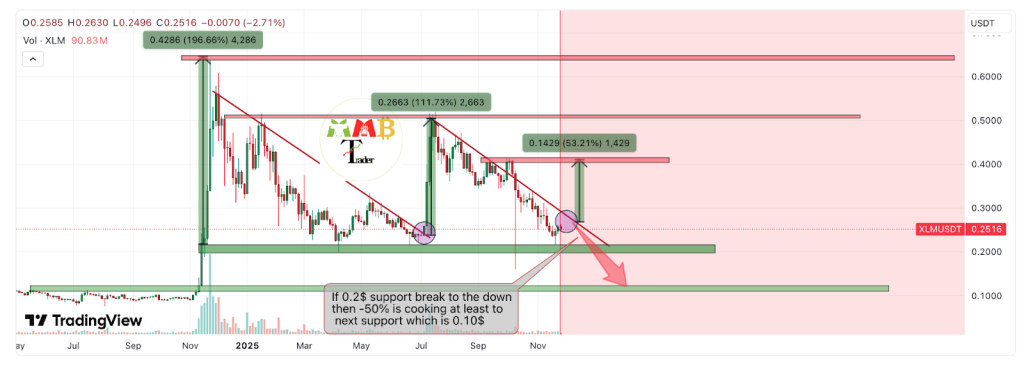
Stellar (XLM) Price Prediction: Can Bulls Push Toward $0.30 in December?