- The total crypto market cap chart has formed a bullish falling wedge pattern.
- The analyst also highlighted a bullish divergence on the altcoin market cap chart.
- The last time such a setup was seen, a massive altcoin rally was seen in 2020.
After months of stagnation and bearish sentiment, the winds might finally be shifting in favor of altcoins.
Expert analysts who have analysed the chart patterns suggest the long-awaited “altcoin season” could be approaching.
What Historical Pattern Signals an Altcoin Surge?
Renowned crypto analyst Michaël van de Poppe recently shared a compelling chart highlighting a massive bullish divergence on the altcoin market capitalization against Bitcoin (TOTAL3/BTC).
In his post, van de Poppe noted that the bullish divergence on the altcoin market capitalization “remains to be valid.”
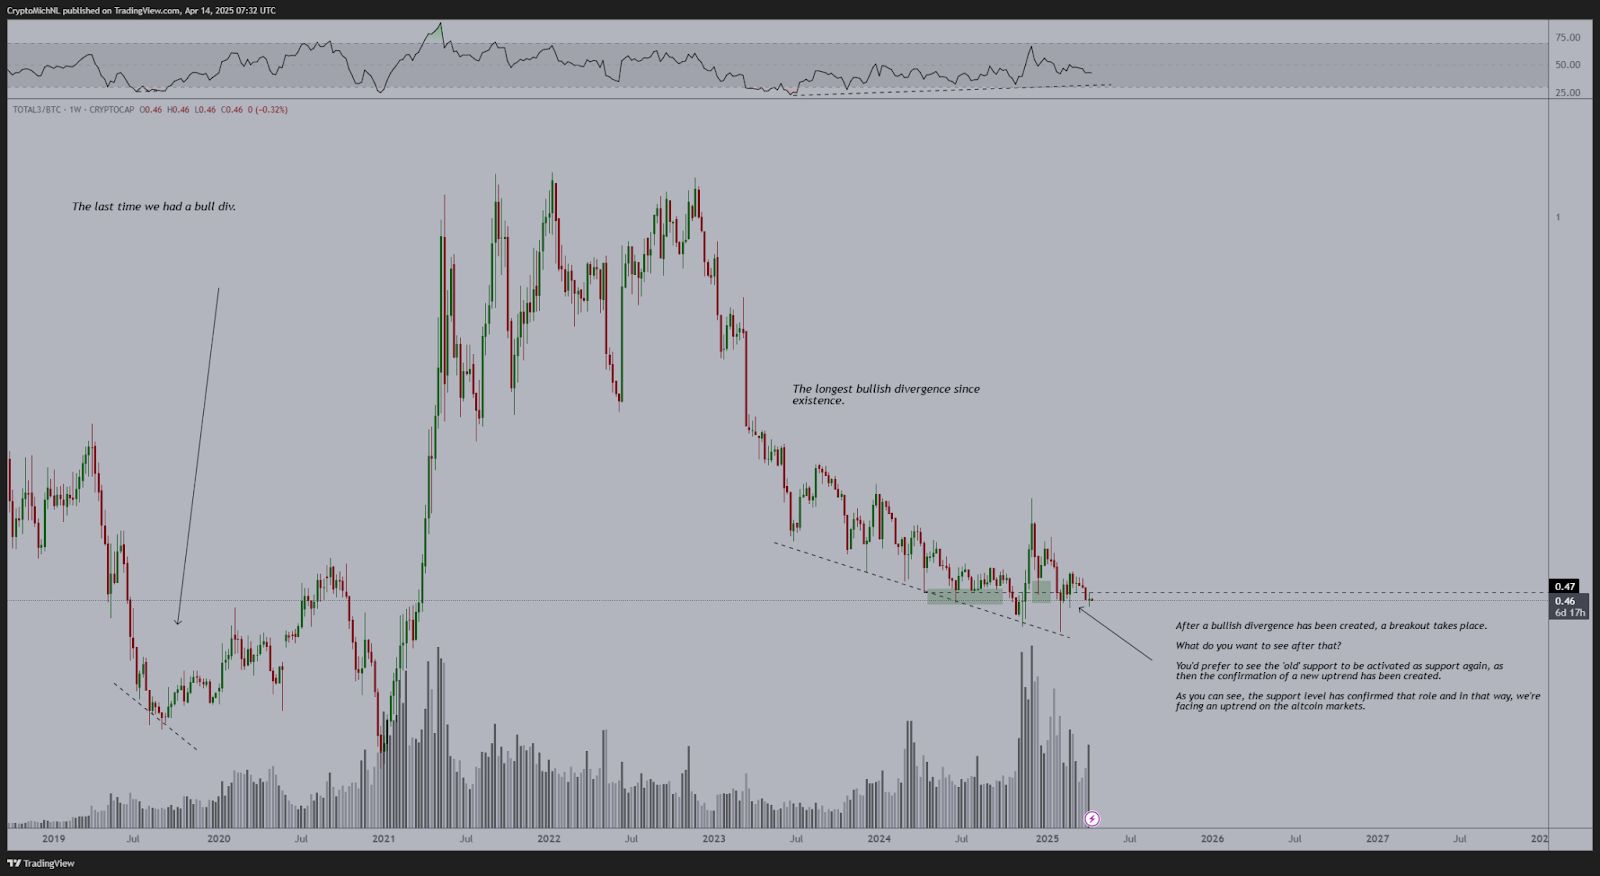
Van de Poppe identified a multi-year falling wedge pattern – a structure often signaling a bullish price reversal. The last time such a bullish divergence occurred, it was followed by a parabolic surge in 2020 that marked the beginning of one of the biggest altcoin bull runs.
The analyst also stressed that the current market features the longest bullish divergence in altcoin history. The RSI (Relative Strength Index) consistently formed higher lows while price made lower lows – a classic setup hinting at a price reversal.
Importantly, a breakout has already taken place, with price reclaiming the wedge resistance and retesting it as support. This retest seems to be holding, which van de Poppe argues could be a confirmation of a new uptrend in the altcoin market.
How Does the Altcoin Market Cap Chart Look?
The TOTAL2 chart (total crypto market cap excluding Bitcoin) shows that as of April 14, TOTAL2 has bounced from the $830 billion zone and is now hovering near the $960 billion mark, showing signs of life after weeks of sideways action.
This price action has reclaimed the 0.382 Fibonacci retracement level, and is attempting to push above the key 0.5 and 0.618 levels — commonly watched for trend reversals.
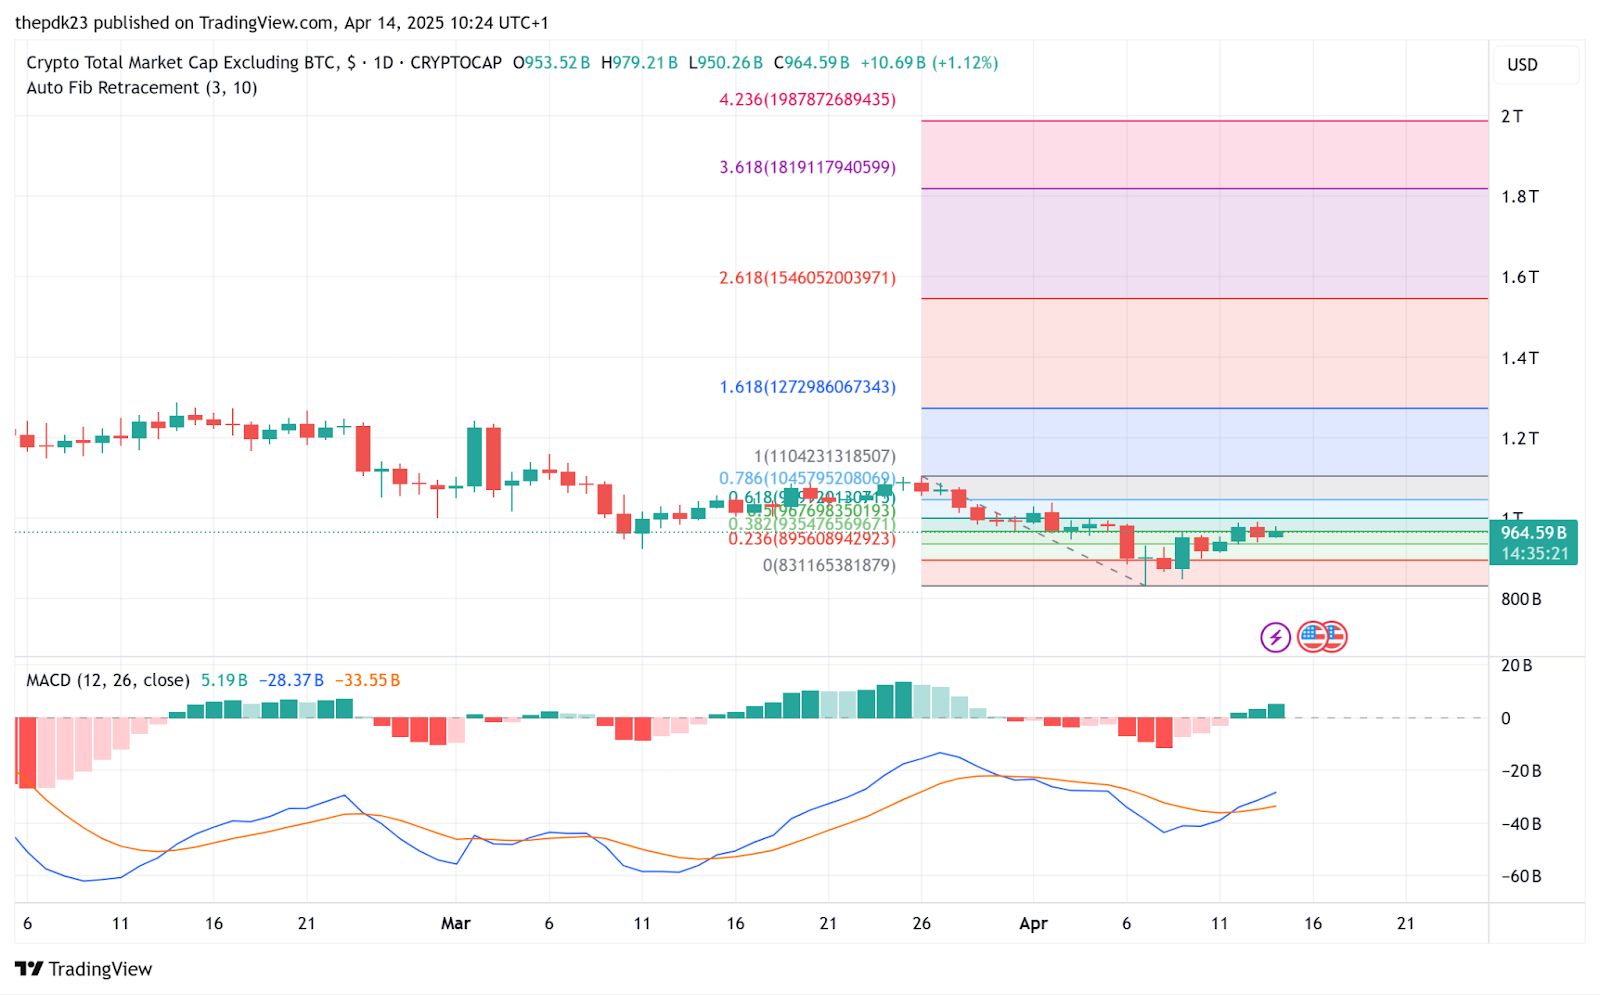
Also, the MACD (Moving Average Convergence Divergence) has crossed bullish, with histogram bars flipping green and momentum shifting upward, indicating a potential continuation if follow-through volume enters the market.
If the TOTAL2 market cap can decisively break and hold above the $1.02 trillion mark (0.618 Fib), analysts see potential for a rally toward $1.27 trillion (the 1.618 Fibonacci extension). This scenario becomes more likely if Bitcoin’s price stabilizes or consolidates.
In a bullish case, TOTAL2 could retest all-time highs near $1.6–2 trillion in the next 6–12 months. On the other hand, the bearish case would involve another rejection at the 0.618 fib, sending prices back toward the $830B support.
Disclaimer: The information presented in this article is for informational and educational purposes only. The article does not constitute financial advice or advice of any kind. Coin Edition is not responsible for any losses incurred as a result of the utilization of content, products, or services mentioned. Readers are advised to exercise caution before taking any action related to the company.