
Ethereum Price Stuck Near $3K, Indicators Show Risk of Downside Break
Ethereum price is still facing many hurdles near $3,200. ETH could start another major decline if the price stays below $3,200 and $3,280.
- Ethereum is struggling to recover above the $3,200 resistance zone.
- The price is trading below $3,200 and the 100-hourly Simple Moving Average.
- There is a key bearish trend line forming with resistance at $3,120 on the hourly chart of ETH/USD (data feed via Kraken).
- The pair could start another decline if there is a close below the $2,900 support zone.
Ethereum Price Consolidates
Ethereum price found support and attempted a recovery wave above the $3,000 resistance zone. ETH was able to climb above the $3,200 level. However, the bears were active near the $3,280 resistance zone.
A high was formed at $3,278 and the price reacted to the downside, like Bitcoin . It dipped below the 23.6% Fib retracement level of the upward move from the $2,536 swing low to the $3,278 high. Ethereum is now trading below $3,200 and the 100-hourly Simple Moving Average.
Immediate resistance is near the $3,100 level. There is also a key bearish trend line forming with resistance at $3,120 on the hourly chart of ETH/USD. The first major resistance is near the $3,200 level and the 100-hourly Simple Moving Average.
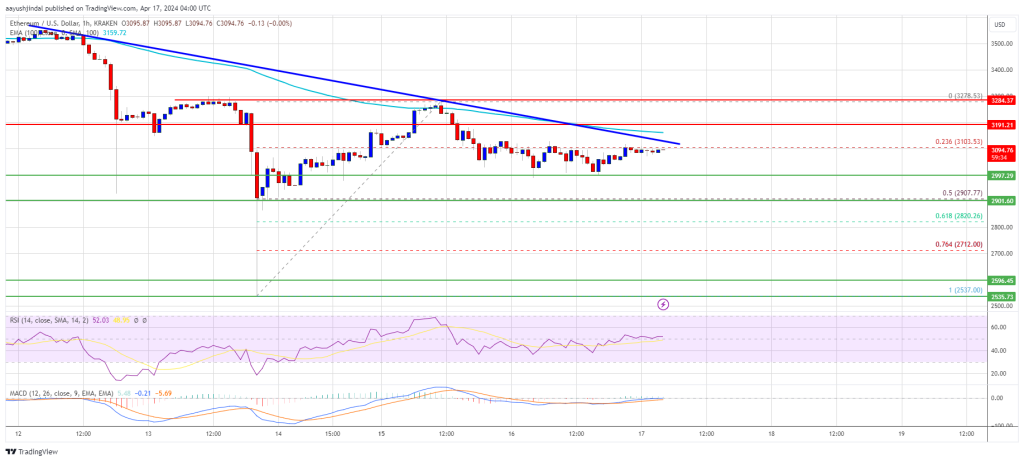
Source: ETHUSD on TradingView.com
The next key resistance sits at $3,280, above which the price might rise toward the $3,350 level. The key hurdle could be $3,500, above which Ether could gain bullish momentum. In the stated case, the price could rise toward the $3,620 zone. If there is a move above the $3,620 resistance, Ethereum could even climb toward the $3,750 resistance.
Another Decline In ETH?
If Ethereum fails to clear the $3,200 resistance, it could start another decline. Initial support on the downside is near the $3,000 level.
The first major support is near the $2,900 zone or the 50% Fib retracement level of the upward move from the $2,536 swing low to the $3,278 high. The next key support could be the $2,710 zone. A clear move below the $2,710 support might send the price toward $2,650. Any more losses might send the price toward the $2,550 level.
Technical Indicators
Hourly MACD – The MACD for ETH/USD is losing momentum in the bearish zone.
Hourly RSI – The RSI for ETH/USD is now above the 50 level.
Major Support Level – $2,900
Major Resistance Level – $3,200
Disclaimer: The content of this article solely reflects the author's opinion and does not represent the platform in any capacity. This article is not intended to serve as a reference for making investment decisions.
You may also like
After bitcoin returns to $90,000, is Christmas or a Christmas crash coming next?
This Thanksgiving, we are grateful for bitcoin returning to $90,000.

Bitcoin security reaches a historic high, but miner revenue drops to a historic low. Where will mining companies find new sources of income?
The current paradox of the Bitcoin network is particularly striking: while the protocol layer has never been more secure due to high hash power, the underlying mining industry is facing pressure from capital liquidation and consolidation.

What are the privacy messaging apps Session and SimpleX donated by Vitalik?
Why did Vitalik take action? From content encryption to metadata privacy.

The covert war escalates: Hyperliquid faces a "kamikaze" attack, but the real battle may have just begun
The attacker incurred a loss of 3 million in a "suicidal" attack, but may have achieved breakeven through external hedging. This appears more like a low-cost "stress test" targeting the protocol's defensive capabilities.
