

RNDR, the native token of Render, is once again in the limelight as the broader crypto market is showing signs of a new surge.
In addition to the optimistic mood concerning both AI and decentralized computing, RNDR price has begun to trend upwards after several months of consolidation.
The recent sharp reversal, backed by increasing volume indicates that traders are setting up a possible continuation move instead of an immediate spike.
Currently, the price movement of RNDR shows confidence in its continued rise, yet the market continues to test key points that will determine the direction.
What Render (RNDR) Charts Reveal About the Next Move
Following several weeks of sideways movement, RNDR succeeded to break out of a key resistance zone of $1.80-$2.
At press time, Render price was trading at $2.20, noting a weekly rise of over 60%. Its market cap has sharply surged to $1.14 Billion, denoting capital influx in the market.
Furthermore, Render (RNDR) price is eyeing to smash the $3-$4 zone where bears have positioned themselves.
However, after a sharp buying a retracement may be possible since traders usually book profits at key levels.
On the upside, a break above the $3 mark could open the doors toward the $5, whereas a drop below $2 may pause the bullish momentum.
In addition to it, Analyst LLuciano BTC gave a bullish call in his recent post. He articulated that the Render price flipped from the demand zone and entered into the bullish trend. A continuation of the upmove may push the token toward $10-$12 in the next few weeks.
As long as RNDR is trading beyond the $2 support zone, the larger rally could be possible.
What Do Market Sentiment and Derivatives Data Hints?
Data from Coinglass shows that Render’s future open interest has increased rapidly from $30M to $59M in this week.
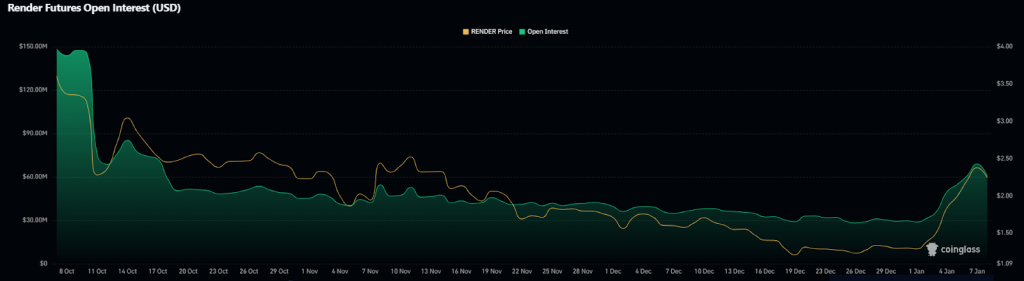 Source: Coinglass
This significant surge hints that large institutions have made long positions. Amidst the OI surge, bearish traders were trapped.
 Source: Coinglass
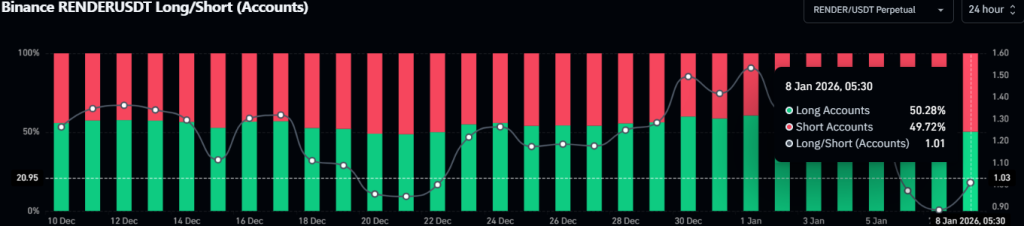
Furthermore, the OI-weighted funding rate stayed in the positive zone, replicating the bullish sentiment. Also, the long to short ratio stands above 1 hints that more traders are taking long positions.