Bitcoin structure turns bearish, structural indicators turn negative

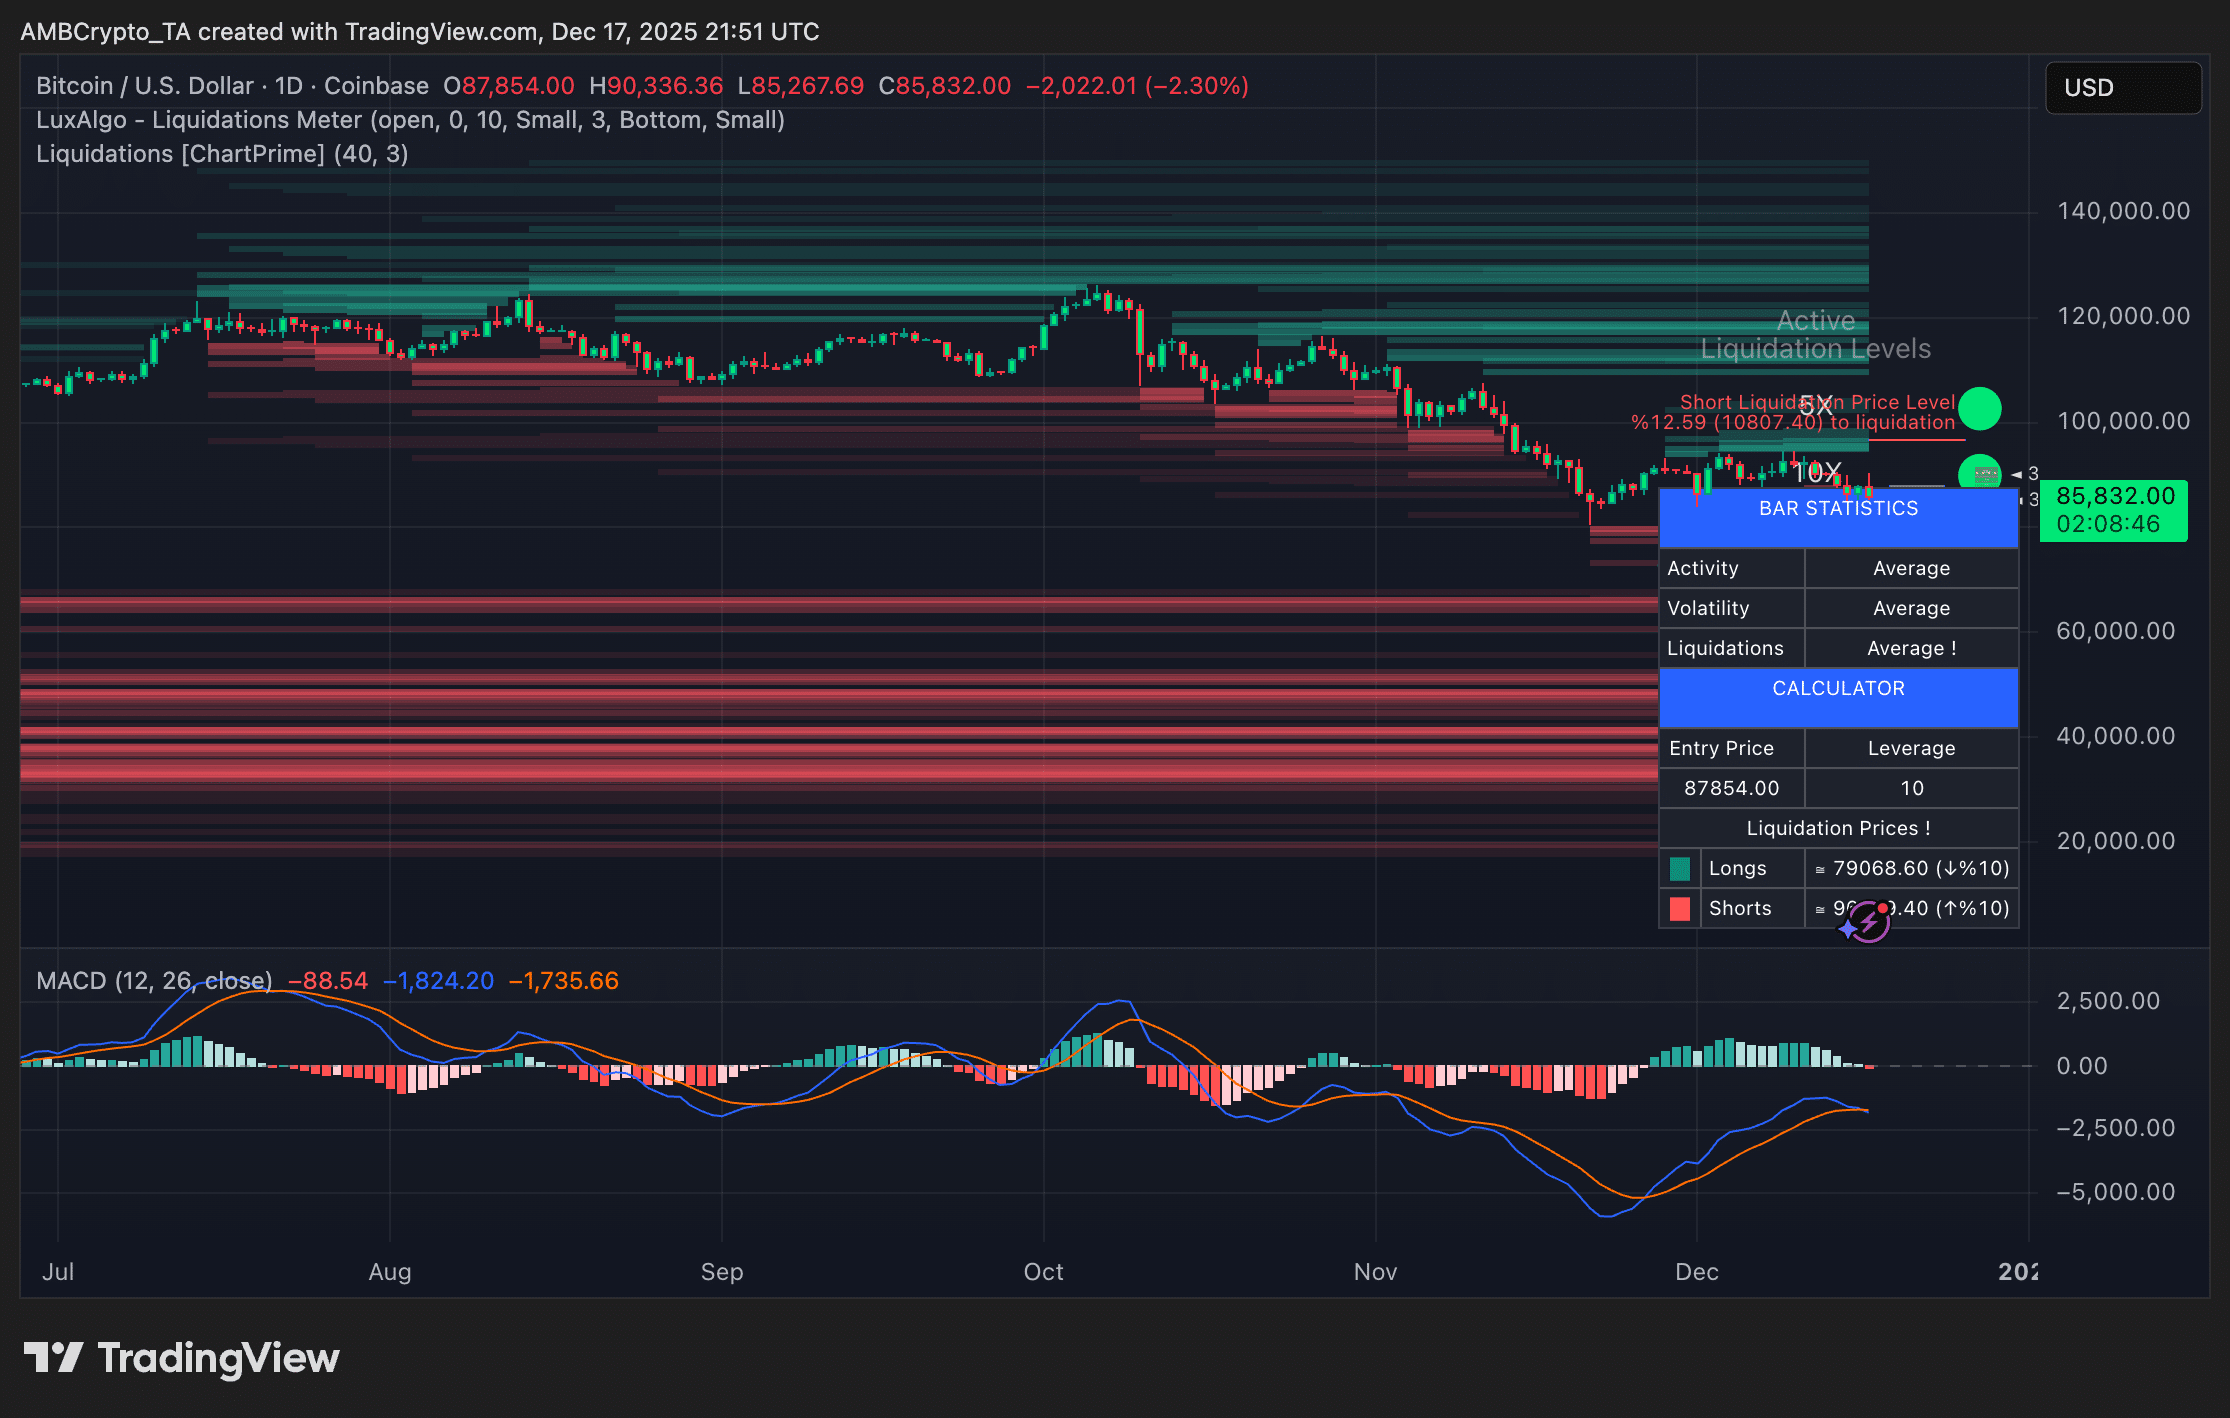
Bitcoin is striving to return to the $90,000 mark, while continuously testing the key demand area near $86,000. After several weeks of price pullbacks, it is becoming increasingly difficult for bulls to find convincing reasons to justify the continuation of the trend.
Upward momentum has clearly faded, with repeated failed attempts to rally, and market confidence is weakening. As a result, more and more analysts are openly discussing the possibility that Bitcoin may be entering a broader bear market phase, rather than just a temporary pullback within a larger upward trend.
This narrative shift is supported by structural data. In a recent analysis report, Axel Adler pointed out that Bitcoin's price action coincides with a clear deterioration in market structure. By combining comprehensive structural shift signals and Donchian Channel charts, he shows that this indicator has clearly entered negative territory.
The comprehensive structural shift indicator ranges from -1 to +1, with values below zero indicating bearish dominance. Currently, the indicator is near -0.5, a level that historically has typically signaled sustained downward pressure rather than a brief pullback.
Meanwhile, Bitcoin's price has fallen to the lower band of the 21-day Donchian Channel and is hovering above the $85,000 support area. These signals collectively indicate that the market is in a... risk-averse environment, and unless the structure improves substantially, downside risks remain high.
Bitcoin structure confirms bear market trend.
Adler notes that the current position of the comprehensive structural shift indicator confirms that Bitcoin has firmly entered a bearish structural zone. The indicator is below the zero axis, indicating that the market is no longer in a neutral or transitional phase, but is instead in a sustained downtrend.
According to this framework, the main trigger for improvement would be a decisive rebound of the comprehensive signal above the zero threshold; ideally, the price should continue to hold support within the Donchian Channel. Otherwise, any short-term rebound may only be a corrective bounce rather than a trend reversal.
The Bitcoin bull-bear market structure index reinforces this bearish structure. This index measures the dynamics of the derivatives market through both fast and slow components. The latest data shows that the bullish component has plummeted to just 5%, an extremely low value reflecting an almost complete lack of bullish momentum. Meanwhile, the fast bearish component has further fallen into negative territory, indicating that selling pressure, mainly driven by the futures market, is on the rise.
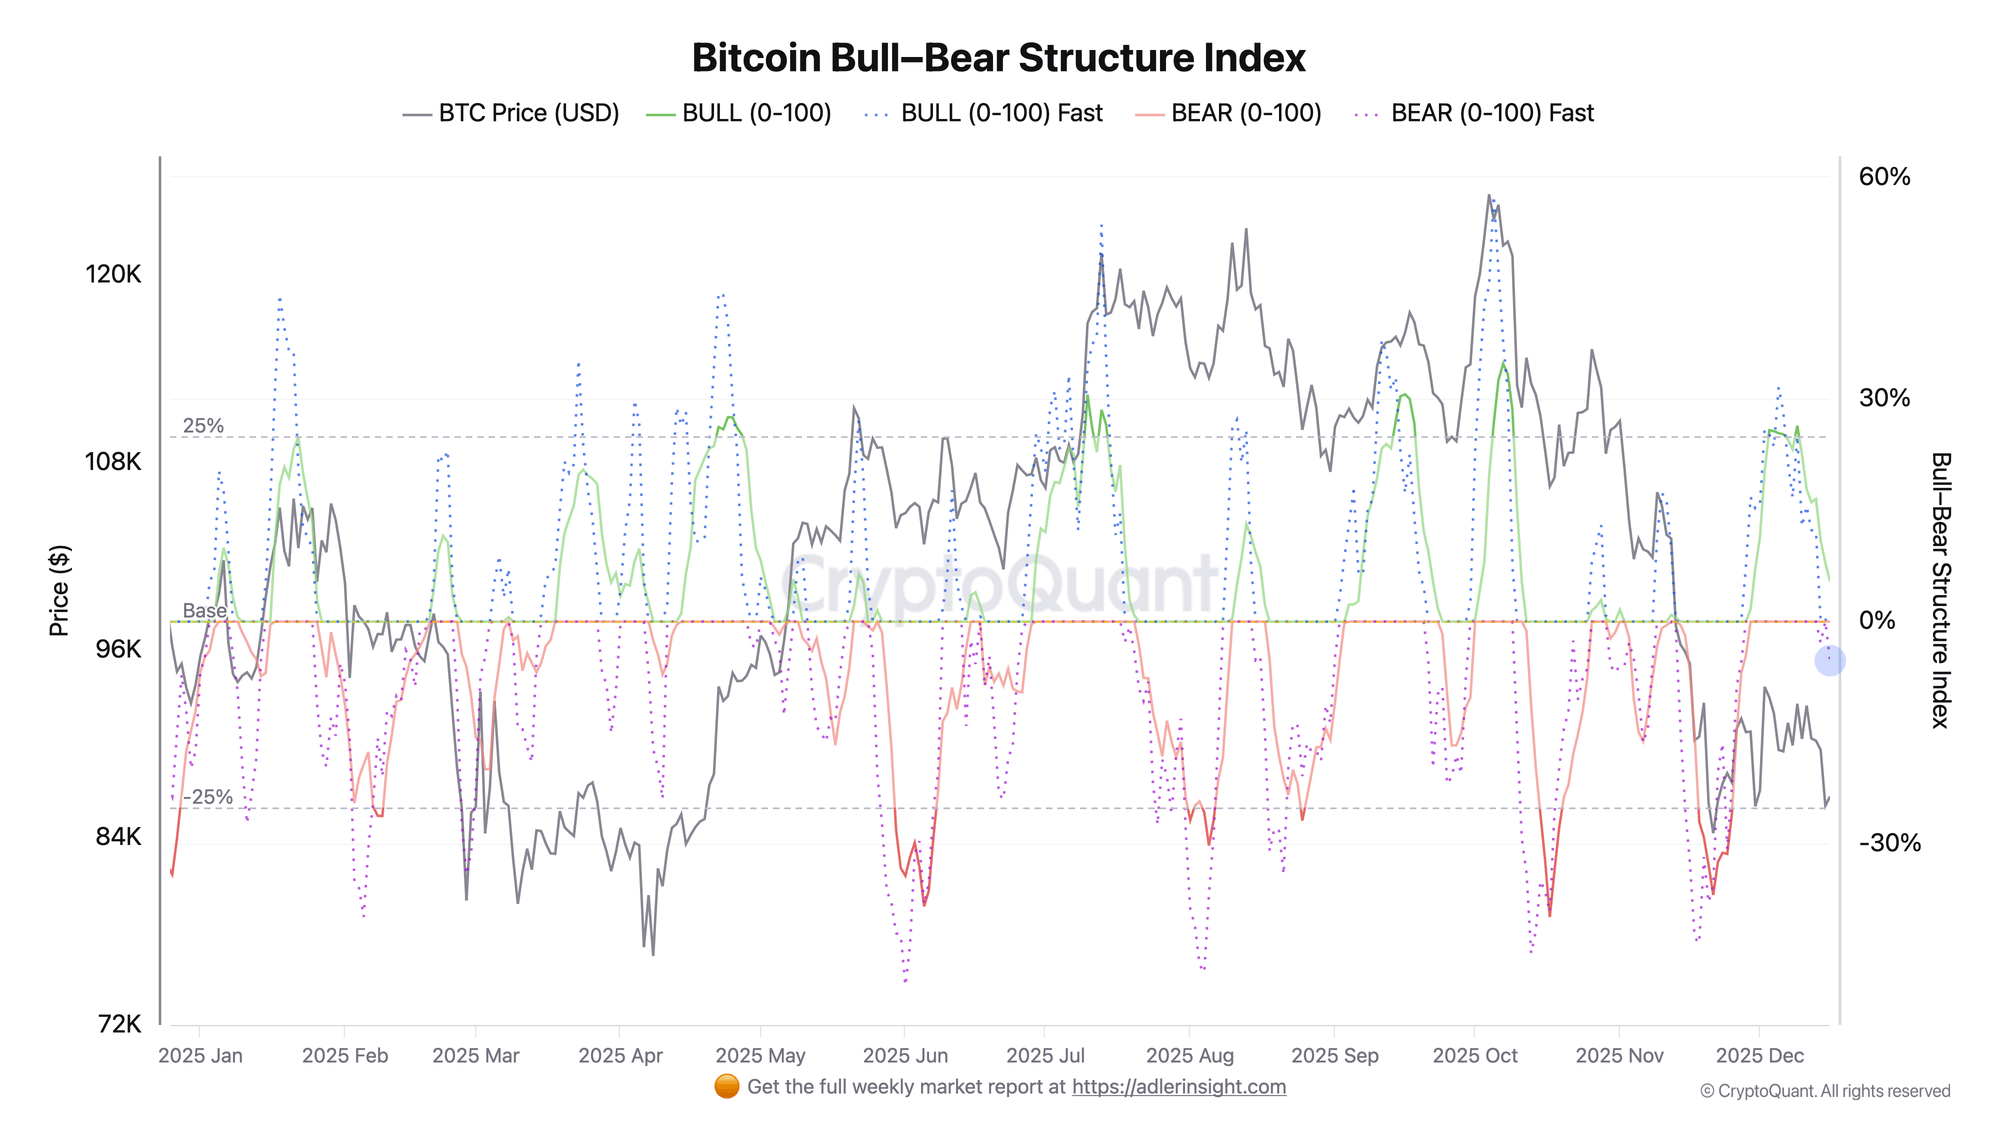 Bitcoin Bull-Bear Structure Index | Source: Crypto Quantitative
 This pattern highlights a critical imbalance. Short-term momentum is firmly in the hands of the bears, while spot demand so far has been insufficient to absorb the selling pressure triggered by derivatives. To improve market conditions, the bullish portion of the index needs to rebound significantly, indicating buyers are re-entering the market.
Overall, both indicators point to the same conclusion: Bitcoin has undergone a local structural shift and entered bearish territory. The main risk remains the continued downward pressure from derivatives, especially in the absence of strong spot market accumulation.
Bitcoin price tests key support, downtrend continues.
Bitcoin continues to face significant downward pressure. After failing to reclaim higher resistance levels, the price is currently hovering around $86,500. Charts show that Bitcoin's price has fallen below both short- and medium-term moving averages, and is well below the 50-day and 100-day moving averages. These levels previously acted as support during the uptrend, but have now turned into resistance, further reinforcing the bearish pattern.
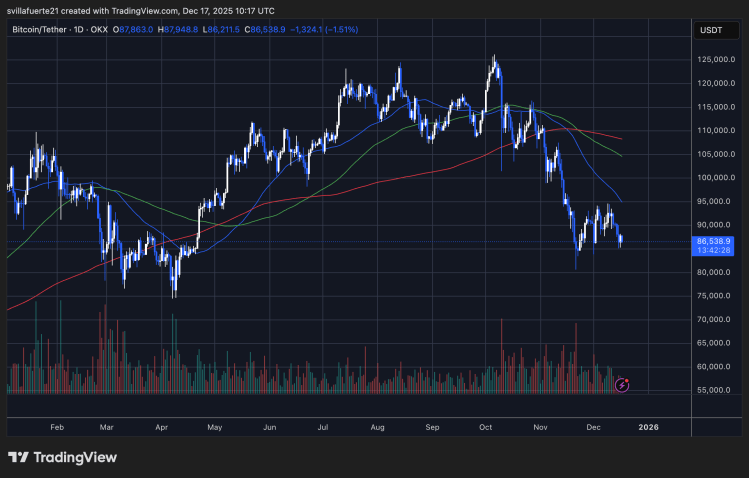
The most noteworthy technical move is Bitcoin's interaction with the 200-day moving average (shown in red on the chart). The price briefly tested this long-term support level, but remains fragile, with a clear lack of follow-up buying. Historically, when the price stays below the fast moving averages and consolidates near the 200-day moving average, it usually signals a prolonged consolidation phase, or, if demand fails to materialize, the risk of further declines.
Structurally, since the October high near $125,000, Bitcoin has been in a trend of lower lows. As long as the price continues to be capped below the $90,000 to $95,000 resistance zone, downside risks remain. For bulls to regain control of the market, Bitcoin must first stabilize above current demand and reclaim key moving averages, indicating that sellers are losing dominance.
Cover image from ChatGPT, charts from TradingView.com.
Disclaimer: The content of this article solely reflects the author's opinion and does not represent the platform in any capacity. This article is not intended to serve as a reference for making investment decisions.
You may also like
Santa Rally Hopes Fade as Bitcoin Jumps to $90K, Then Falls Even Harder
Nexo Initiates Multi-Year Global Collaboration with Tennis Australia