Bitcoin holds support but lacks confidence, daily momentum remains fragile.

The daily chart of bitcoin continues to reflect that the market is struggling to regain bullish dominance.
Recent closing prices show that bitcoin has been unable to sustain upward momentum, repeatedly failing to reclaim short-term trend levels. This price action suggests that even as downward pressure begins to ease, sellers still dominate the overall structure. The market appears to be entering a consolidation phase rather than experiencing aggressive sell-offs, with both buyers and sellers testing each other's confidence.
Moving averages indicate a weak trend environment
On the 1-day timeframe, bitcoin remains below its short-term and medium-term exponential moving averages. This price position typically indicates that rebounds are more likely to be sold into rather than develop into a sustained trend reversal.
However, the trend of prices gradually narrowing towards these moving averages is noteworthy. This suggests that bearish momentum is weakening and the market may be preparing for a period of range-bound trading. Only when the daily closing price decisively rises above these moving averages will market sentiment shift to a more optimistic outlook.
Bitcoin momentum indicators show selling pressure is easing
Momentum indicators further confirm the view that downward pressure is diminishing.
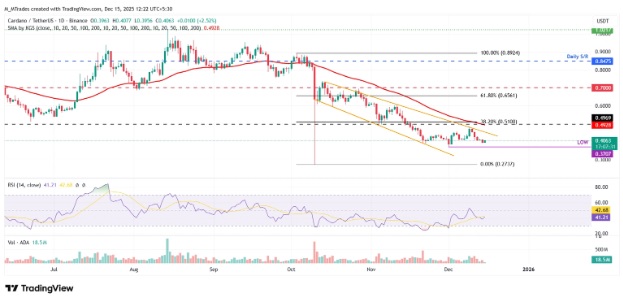
BTC/USDT daily chart (Source: TradingView)
The MACD indicator remains below its signal line, confirming that the overall trend is still bearish, but the weakening downward momentum suggests that sellers are no longer pushing prices down with the same intensity. This situation typically occurs in the later stages of a pullback, when the market begins to seek balance rather than continuing to fall sharply.
The Relative Strength Index (RSI) remains below the neutral midpoint, reflecting low bullish participation and weak buying interest. Meanwhile, the RSI is still above the severely oversold region, indicating that selling pressure is under control rather than panic-driven. This combination supports the view that bitcoin is stabilizing, even if a clear upward reversal has not yet emerged.
Key resistance levels continue to limit upside potential
From a price structure perspective, the area above $87,000 constitutes direct resistance. Multiple failed attempts to break through this area have further solidified its role as a short-term ceiling. After breaking through this area, the next major resistance is just below $91,000, followed by a stronger resistance near the mid-$92,000s. Unless market sentiment improves significantly, sellers are likely to regain control at these price levels.
Order book data further reinforces this resistance area. Multiple clusters of sell-side liquidity are concentrated above the current price, indicating that sellers are actively defending this region. For bitcoin to rise even slightly, these orders must be cleared, but without strong trading volume, this could be very difficult.
Support zones and order book demand provide short-term stability
On the downside, bitcoin receives substantial demand support below the current price level. The presence of multiple buy walls suggests that buyers are willing to absorb the selling pressure in the $87,000 region, reducing the likelihood of an immediate price plunge. As long as this demand persists, the price may continue to fluctuate within a narrow range.
However, if these support levels are breached, downside risk increases to the mid-$86,000 region, with deeper support near the mid-$84,000s. If the daily closing price clearly falls below these levels, it would indicate that the consolidation phase has failed and the bearish trend is being re-established.
Possible trading scenarios for bulls and bears
For bullish traders, the risk of long opportunities remains high when bitcoin is below its daily moving averages. Any long setups are better suited near strong support zones, ideally accompanied by signs of stabilization or strengthening momentum. In this case, upside targets should be conservative, focusing on nearby resistance levels rather than expecting a full trend reversal.
Bearish setups are more in line with the current market structure. If the price fails to break through the resistance zone, further shorting opportunities may arise, especially if momentum indicators remain weak. At this point, downside targets will coincide with existing support areas, but if the trend suddenly reverses, risk should be strictly controlled.
Outlook: Range-bound market awaits confirmation
Overall, bitcoin's daily chart shows the market is in a transitional phase rather than displaying a clear directional trend. Bears still dominate, but weakening momentum and a clear rebound in demand near support levels suggest that buyers and sellers are reaching a balance.
Until bitcoin firmly reclaims key trend levels or decisively breaks below support, price action may continue to oscillate, with traders waiting for confirmation of the next sustained move.
Disclaimer: The content of this article solely reflects the author's opinion and does not represent the platform in any capacity. This article is not intended to serve as a reference for making investment decisions.
You may also like
Altseason canceled? "Lack of liquidity" means holders will suffer until 2026
Google deepens consumer credit push in India with UPI-linked card

Cardano (ADA) Bagholders Switch Strategies As This Under $0.05 Token Offers Fresh Hope for Recovery Gains