Key points:
Bitcoin has been facing selling near $89,000, but the bulls have not given up much ground, suggesting a rally to $93,500.
Several major altcoins have started a recovery, but they are likely to face selling at higher levels.
Bitcoin’s ( BTC ) recovery is losing steam as bears attempt to sustain the price below the $88,000 level. Veteran trader Peter Brandt said in a post on X that BTC’s current recovery was a dead cat bounce .
In comparison, network economist Timothy Peterson was slightly more optimistic. Peterson said in a post on X that, according to an AI-based prediction tool, BTC only has a 15% chance of closing below $84,500 by the end of this year. On the way up, there was less than a 50% possibility of BTC reclaiming $100,000 by Dec. 31.
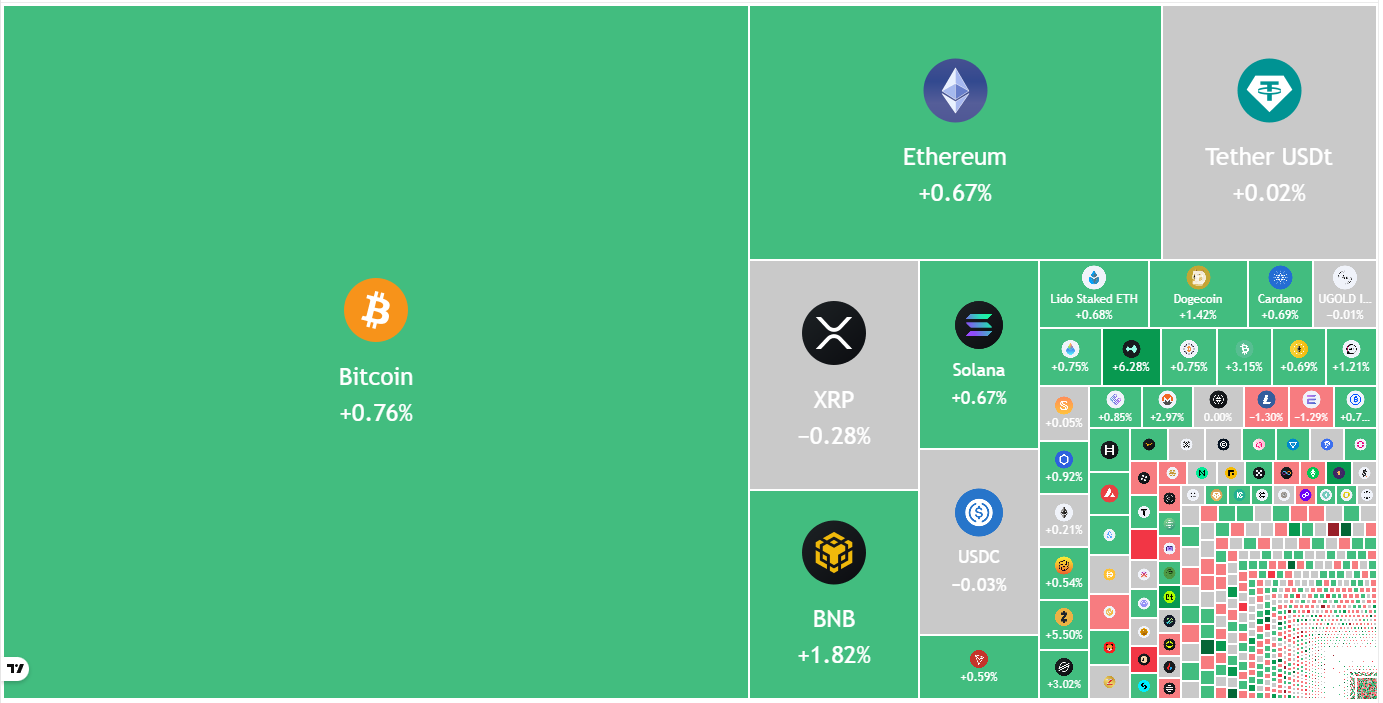 Crypto market data daily view. Source: TradingView
Another positive projection came from SignalPlus head of insights Augustine Fan who told Cointelegraph that BTC may have formed “local lows for now.” Fan anticipates BTC to range from $82,000 to $92,000 , with the next major downside opening if the price sustains below $78,000.
What are the crucial support and resistance levels to watch for in BTC and major altcoins? Let's analyze the charts of the top 10 cryptocurrencies to find out.
Bitcoin price prediction
BTC’s recovery is expected to face selling at the 20-day exponential moving average ($93,431).
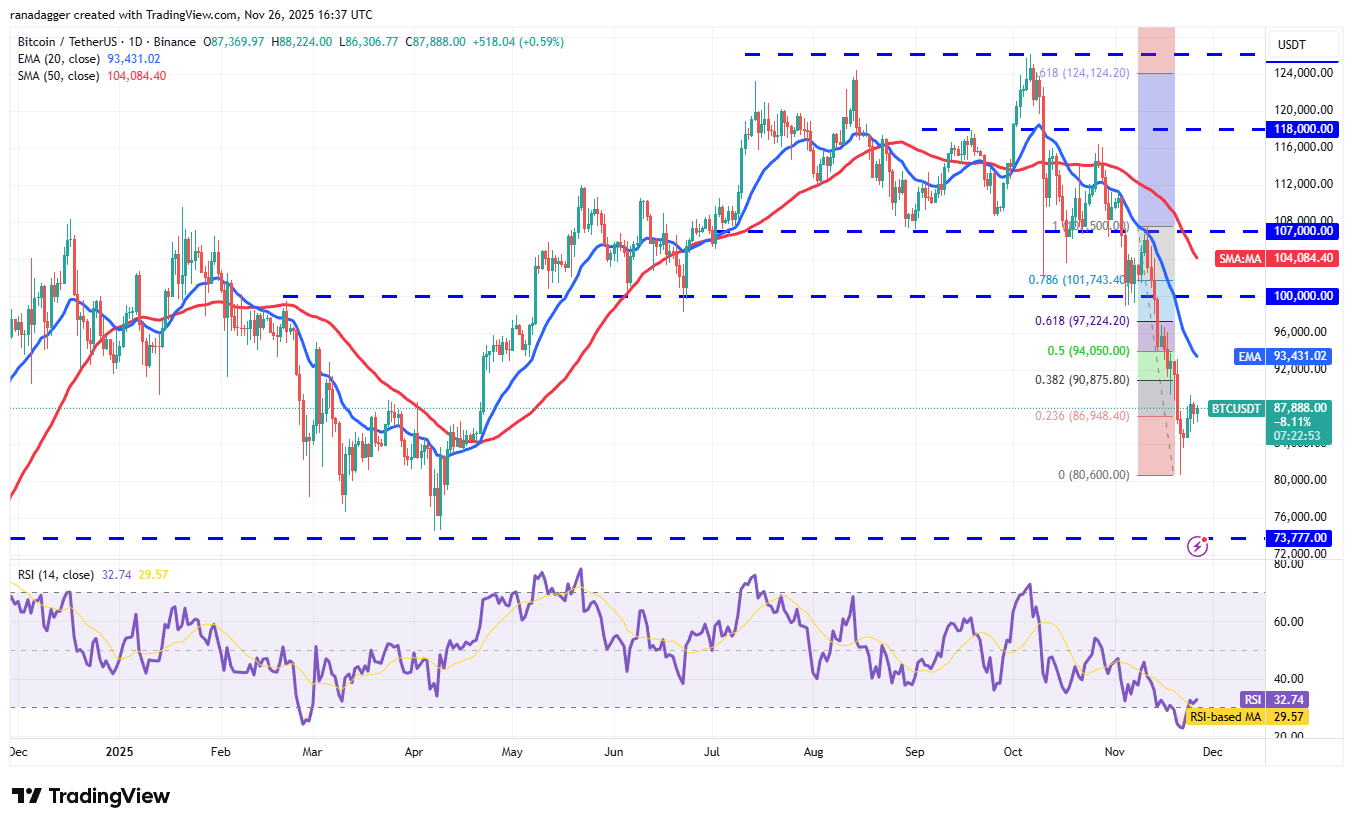 BTC/USDT daily chart. Source: Cointelegraph/ TradingView
If the price turns down from the 20-day EMA, it suggests that the sentiment remains negative and traders are selling on rallies. The BTC/USDT pair may then retest the $80,600 level. If the support cracks, the Bitcoin price could drop to $73,777.
This negative view will be invalidated in the near term if the price continues higher and breaks above the 20-day EMA. The pair could then climb to the psychological level of $100,000.
Ether price prediction
Ether’s ( ETH ) recovery is facing selling near $3,000, but a positive sign is that the bulls have not ceded much ground to the bears.
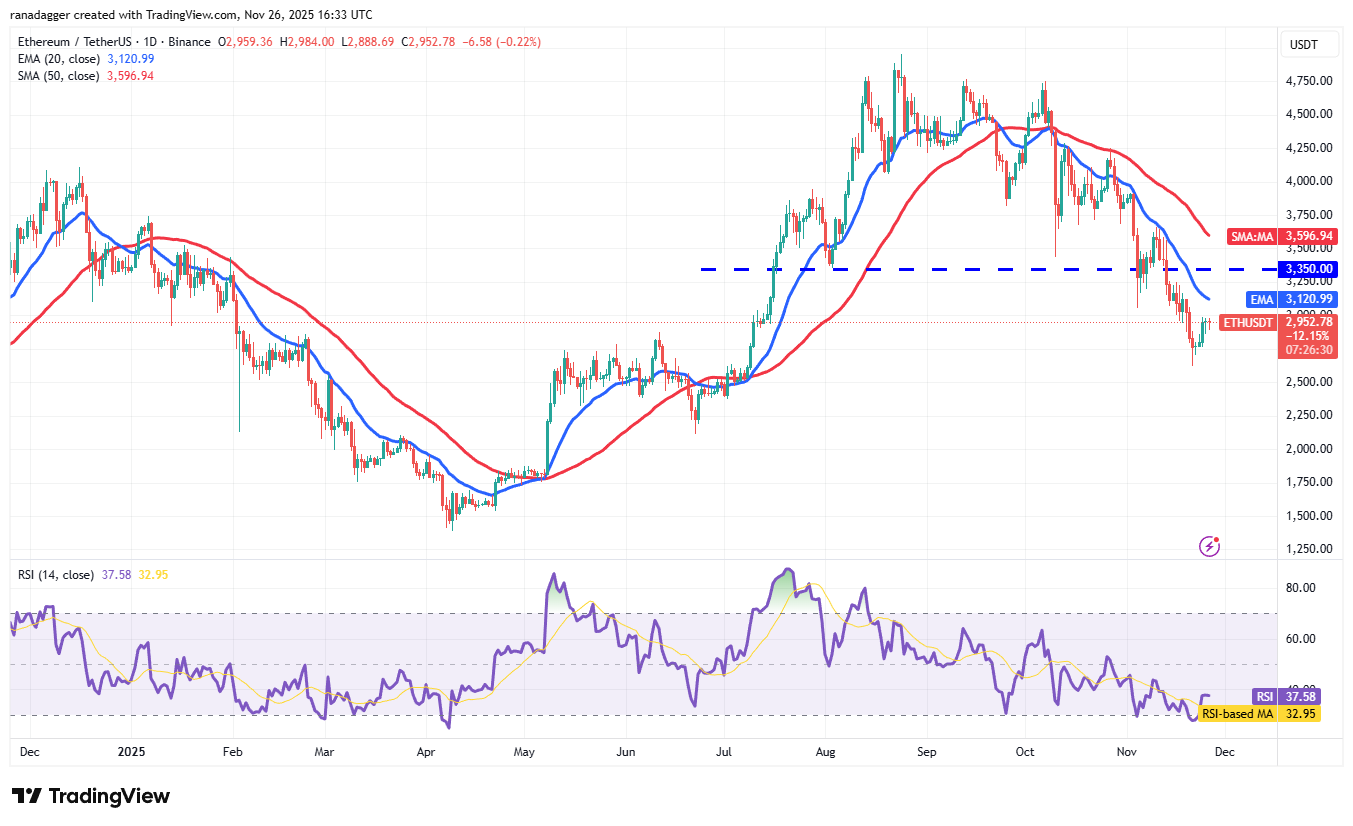 ETH/USDT daily chart. Source: Cointelegraph/TradingView
That indicates the relief rally could reach the 20-day EMA ($3,120) and then to the breakdown level of $3,350. If the price turns down from the overhead resistance zone, the bears will attempt to sink the ETH/USDT pair below $2,623. If that happens, the Ether price could collapse to $2,400.
Buyers will have to push and maintain the price above the 50-day simple moving average ($3,596) to signal that the downtrend may be over.
XRP price prediction
XRP’s ( XRP ) recovery is facing selling at the 20-day EMA ($2.20), but the bulls have kept up the pressure.
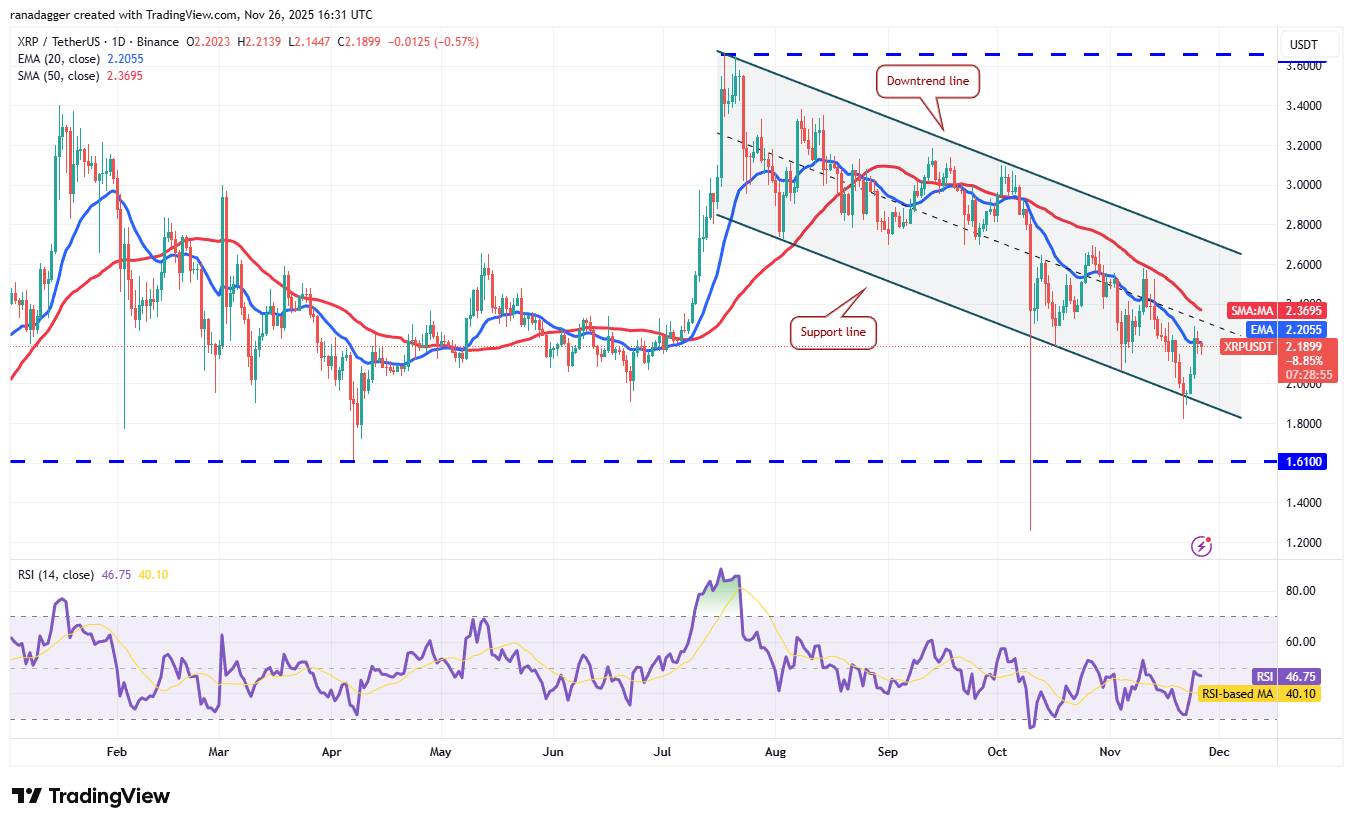 XRP/USDT daily chart. Source: Cointelegraph/TradingView
If the price closes above the 20-day EMA, it suggests that the XRP/USDT pair could extend its stay inside the descending channel pattern for some time. A potential trend change will be signaled after buyers drive the XRP price above the downtrend line.
Alternatively, if the price turns down sharply from the 20-day EMA, the bears will attempt to sink the pair below the support line. If they manage to do that, the XRP price could descend to the vital support at $1.61.
BNB price prediction
BNB ( BNB ) has been witnessing a tough battle between buyers and sellers at the breakdown level of $860.
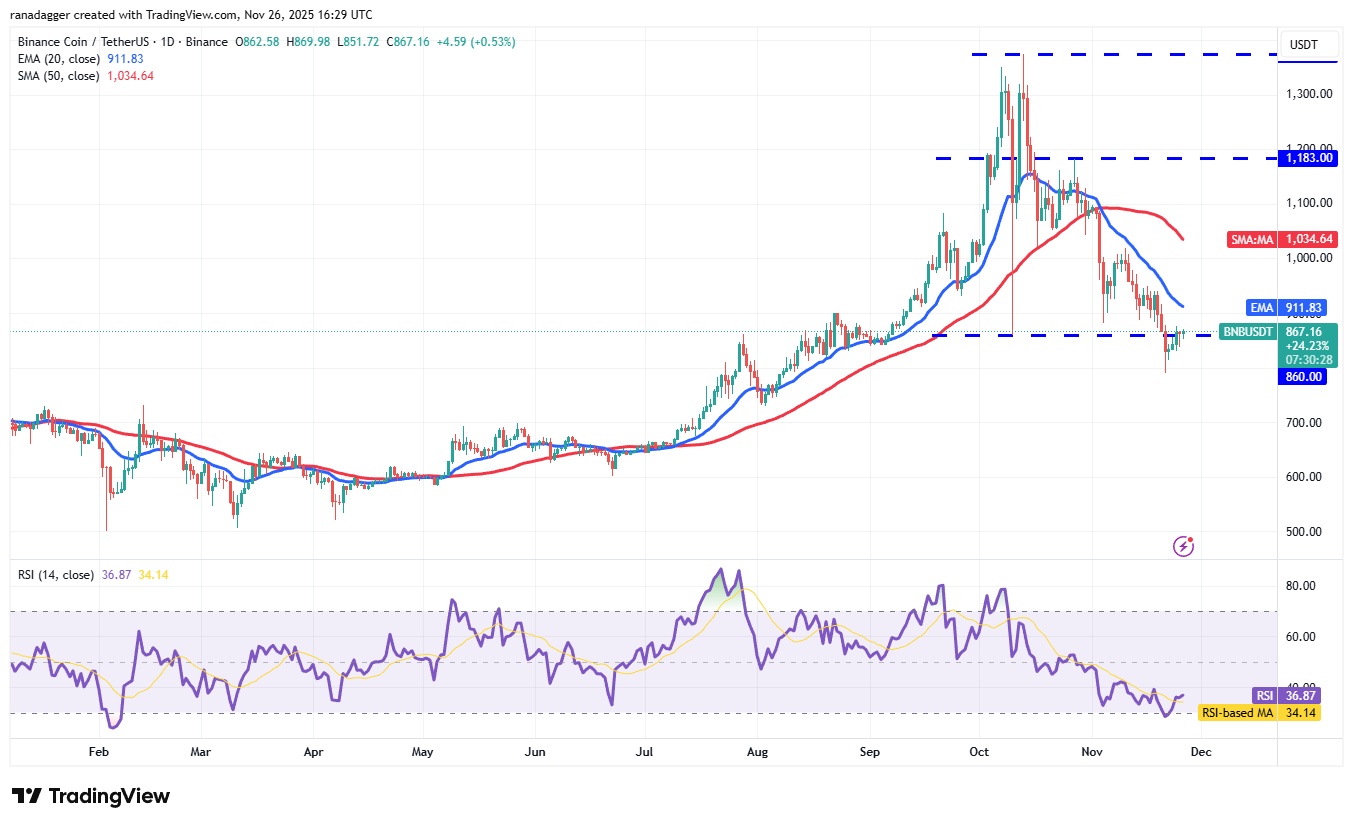 BNB/USDT daily chart. Source: Cointelegraph/TradingView
If the price turns down from the current level or the 20-day EMA ($911), it signals that the bears continue to sell on rallies. That increases the risk of a break below $790, opening the gates for a drop to $730.
Instead, if the BNB price turns up and breaks above the 20-day EMA, it indicates that the market rejected the breakdown below the $860 level. The BNB/USDT pair could then rally to the 50-day SMA ($1,034).
Solana price prediction
Solana ( SOL ) is facing selling near the 20-day EMA ($144), indicating that the bears remain active at higher levels.
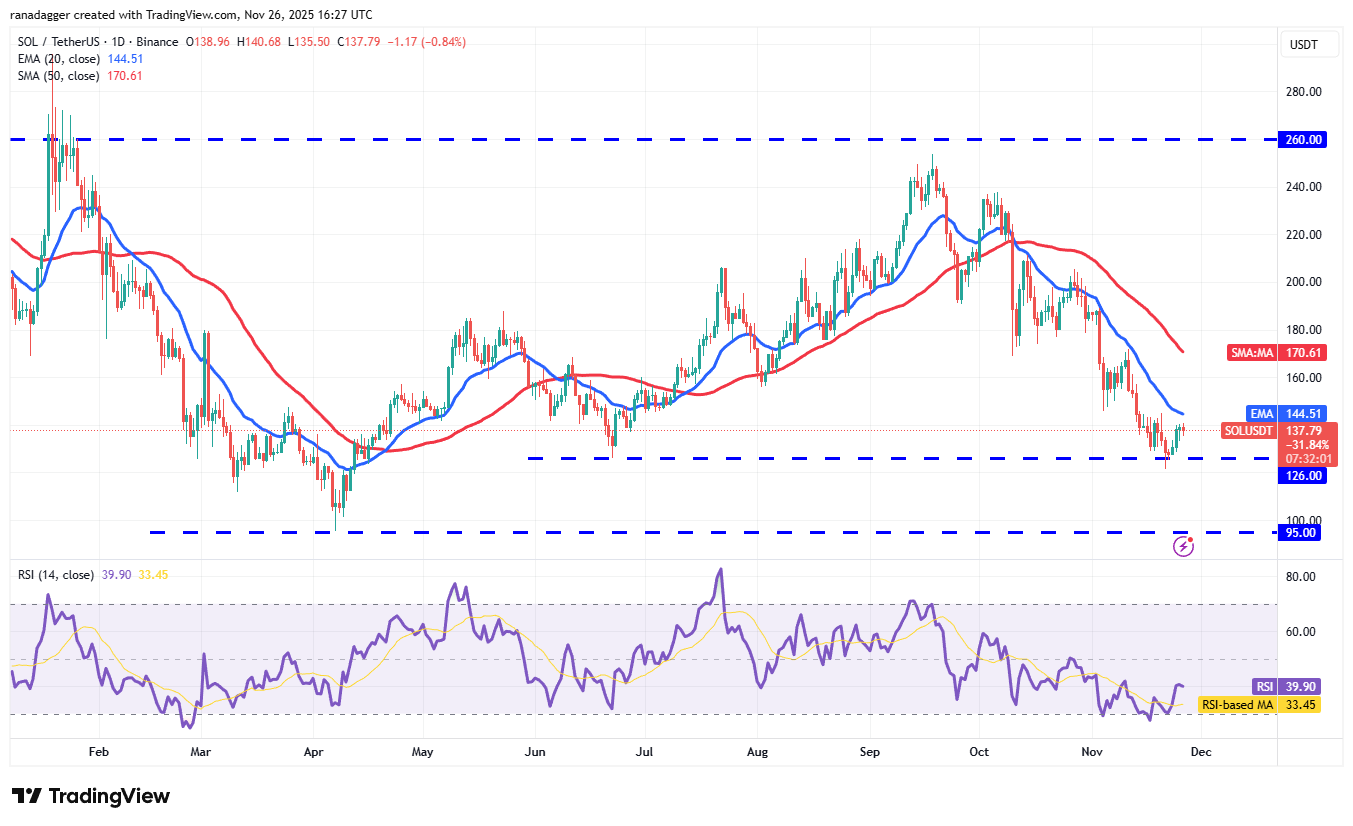 SOL/USDT daily chart. Source: Cointelegraph/TradingView
Sellers will attempt to pull the Solana price below the $126 support. If they succeed, the SOL/USDT pair could plunge to $110 and subsequently to $95. Buyers are expected to fiercely defend the $95 support.
On the way up, the bulls will have to clear the 20-day EMA hurdle to gain the upper hand. The pair could then rally to the 50-day SMA ($170), where the bears are expected to pose a substantial challenge.
Dogecoin price prediction
Dogecoin’s ( DOGE ) bounce off the $0.14 support is facing resistance at the 20-day EMA ($0.16), indicating that the bears are attempting to retain control.
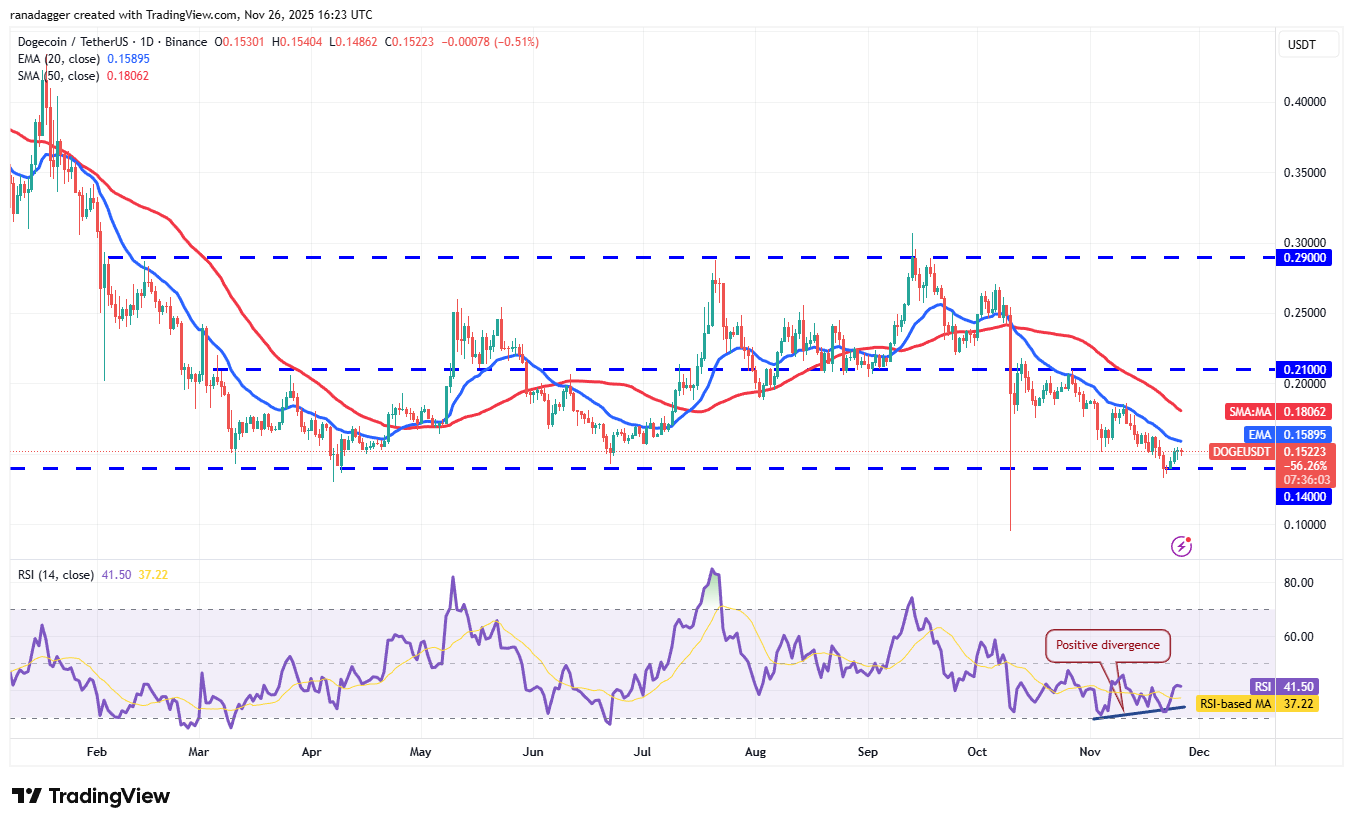 DOGE/USDT daily chart. Source: Cointelegraph/TradingView
If the price turns down sharply from the 20-day EMA, it heightens the risk of a break below the $0.14 support. The Dogecoin price could then plummet to the Oct. 10 low of $0.10, which could attract buyers.
Contrarily, a break and close above the 20-day EMA suggests that the bears are losing their grip. The DOGE/USDT pair could then rally to the 50-day SMA ($0.18), signaling that the price may remain inside the large range between $0.14 and $0.29 for a while longer.
Cardano price prediction
Cardano’s ( ADA ) shallow bounce off the $0.38 level indicates a lack of aggressive buying by the bulls.
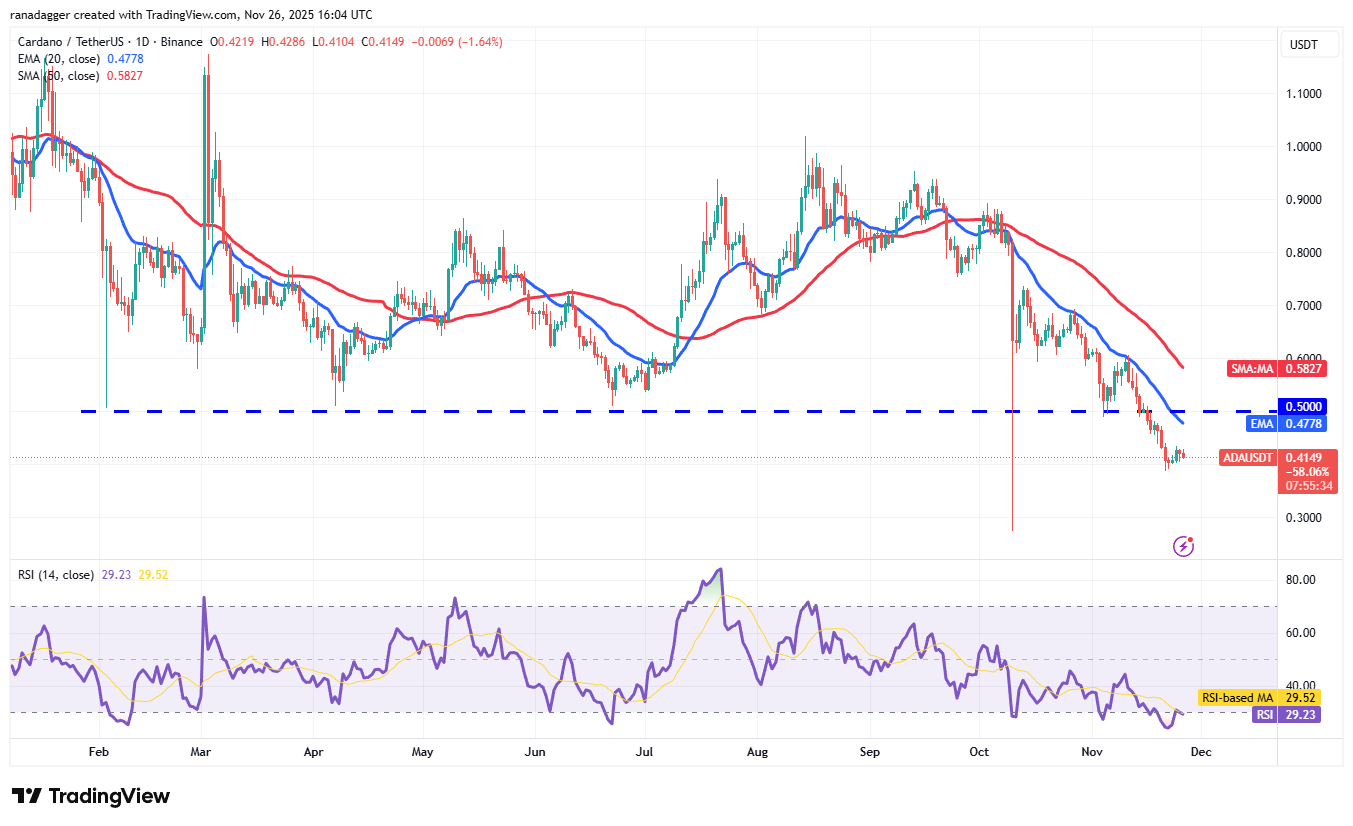 ADA/USDT daily chart. Source: Cointelegraph/TradingView
The bears will try to resume the downtrend by pulling the price below the $0.38 level. If they can pull it off, the ADA/USDT pair could collapse to the Oct. 10 panic low of $0.27.
Buyers have an uphill task ahead of them. Any recovery attempt is expected to face selling at the breakdown level of $0.50, but if the bulls prevail, the Cardano price could rally to the 50-day SMA ($0.58). A close above the 50-day SMA suggests that the downtrend has ended.
Related: Four reasons why Ethereum price remains bullish above $2,800
Hyperliquid price prediction
Hyperliquid (HYPE) has recovered to the breakdown level of $35.50, where the bears are expected to mount a strong defense.
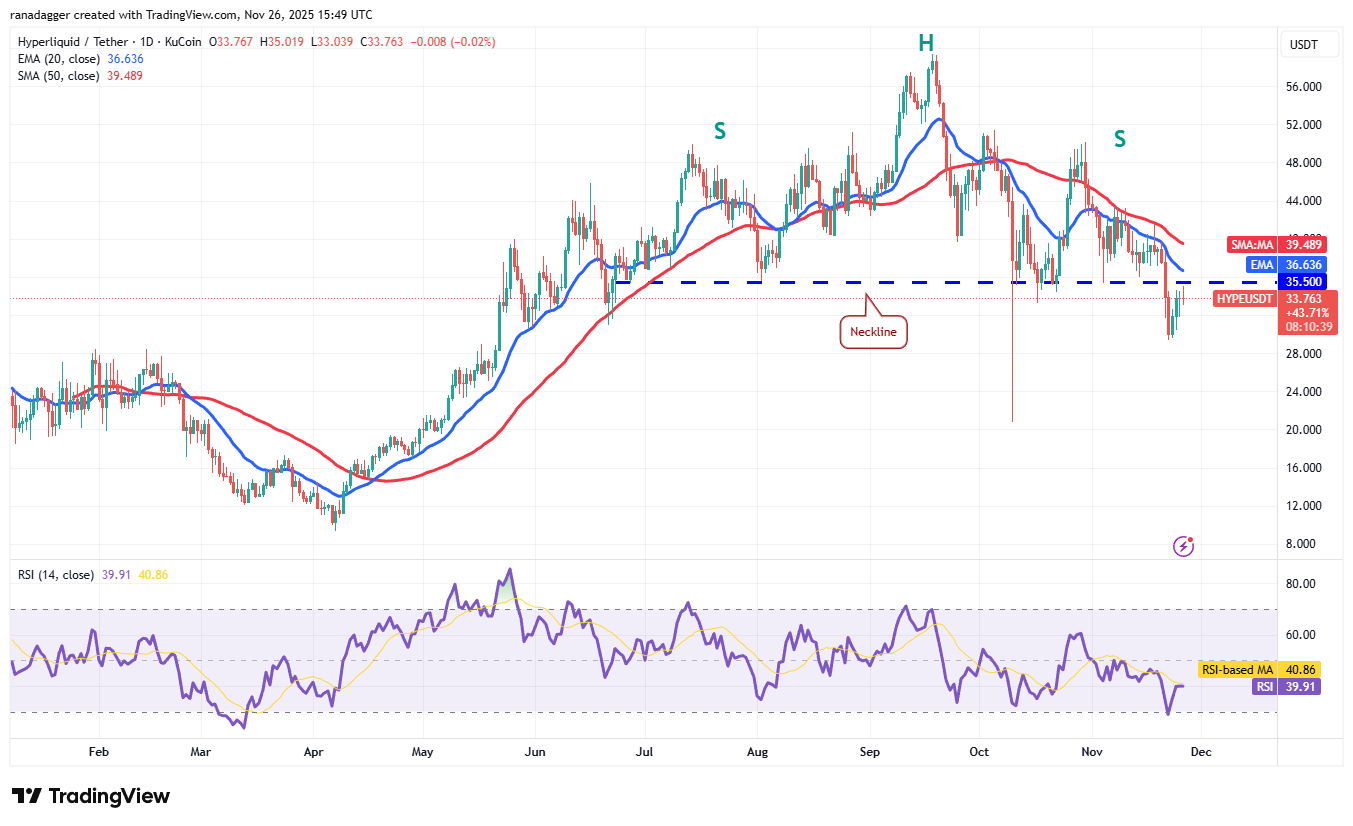 HYPE/USDT daily chart. Source: Cointelegraph/TradingView
If the price turns down sharply from the current level, it suggests that the bears have flipped the $35.50 level into resistance. That increases the risk of a break below the $29.30 level. The HYPE/USDT pair may then tumble to $24.
Buyers will have to drive and maintain the Hyperliquid price above the 50-day SMA ($39.48) to signal a comeback. If they do that, the pair could surge to $44 and eventually to $51.50.
Bitcoin Cash price prediction
Buyers are attempting to maintain Bitcoin Cash ( BCH ) above the resistance line, but the bears continue to exert pressure.
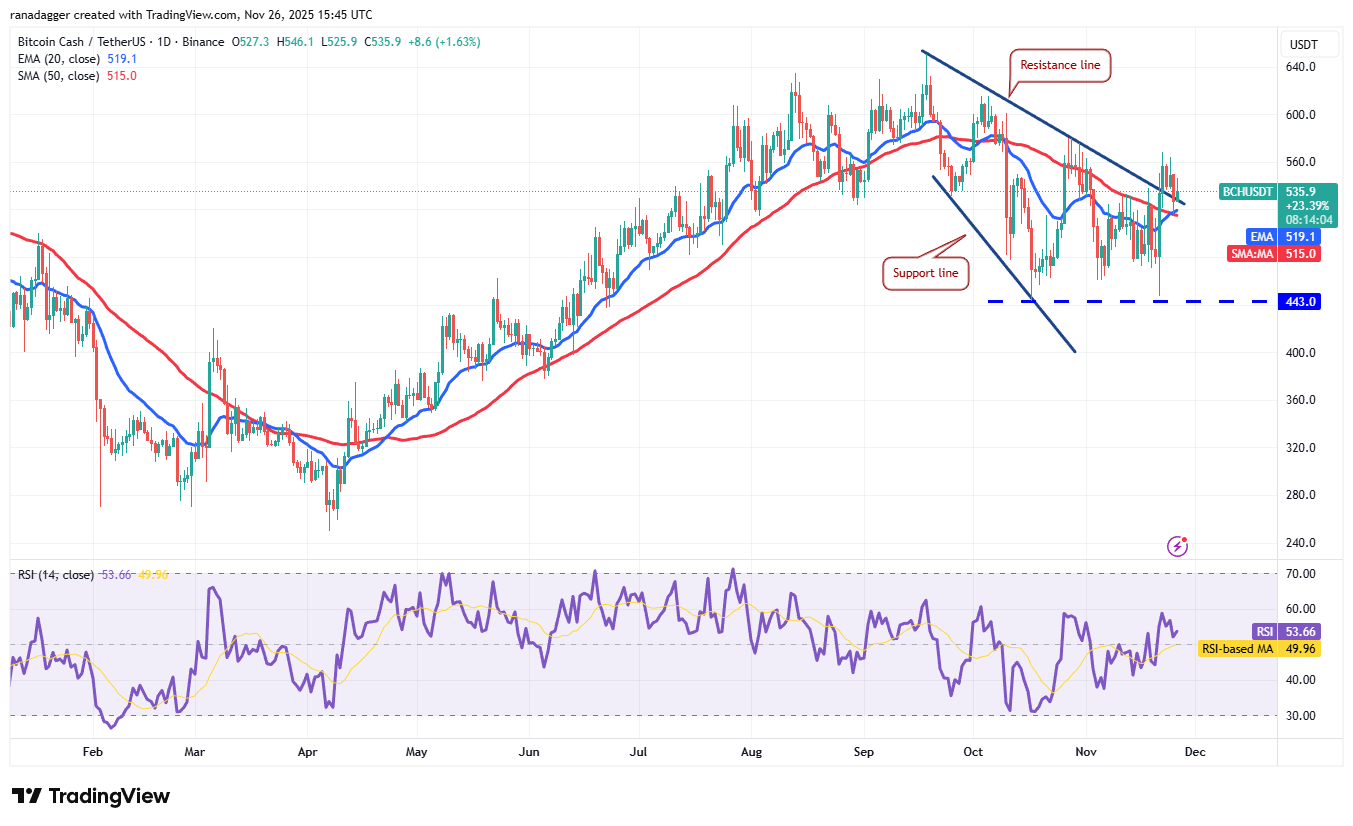 BCH/USDT daily chart. Source: Cointelegraph/TradingView
If the price dips below the moving averages, it suggests that the break above the resistance line may have been a bull trap. The bears will then try to pull the BCH/USDT pair to the solid support at $443.
On the other hand, a strong bounce off the moving averages signals that the bulls are buying on dips. That increases the possibility of a break above the $568 level. The Bitcoin Cash price may then soar to the $606 levels.
Chainlink price prediction
Chainlink ( LINK ) has risen close to the 20-day EMA ($13.88), where the bears are expected to pose a strong challenge.
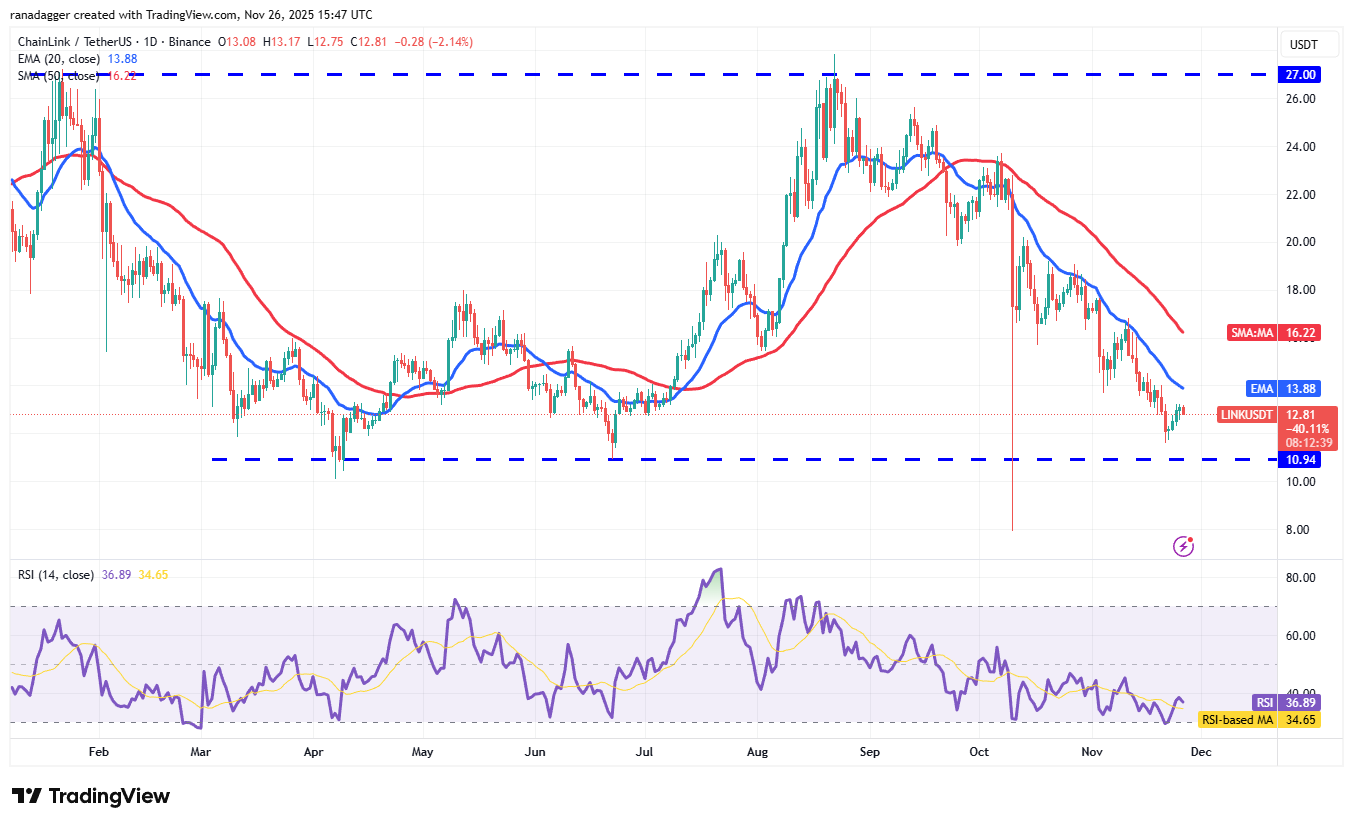 LINK/USDT daily chart. Source: Cointelegraph/TradingView
If the price turns down from the 20-day EMA, the bears will try to pull the LINK/USDT pair to the solid support at $10.94. Buyers are expected to defend the $10.94 level with all their might, as a break below it may sink the pair to $7.90.
Conversely, a break and close above the 20-day EMA suggests that the selling pressure is reducing. The pair may then rise to the 50-day SMA ($16.22). A close above the 50-day SMA indicates that the Chainlink price may remain inside the $10.94 to $27 range for some more time.