Bitcoin plunges 30%. Has it really entered a bear market? A comprehensive assessment using 5 analytical frameworks

Further correction, with a dip to 70,000, has a probability of 15%; continued consolidation with fluctuations, using time to replace space, has a probability of 50%.
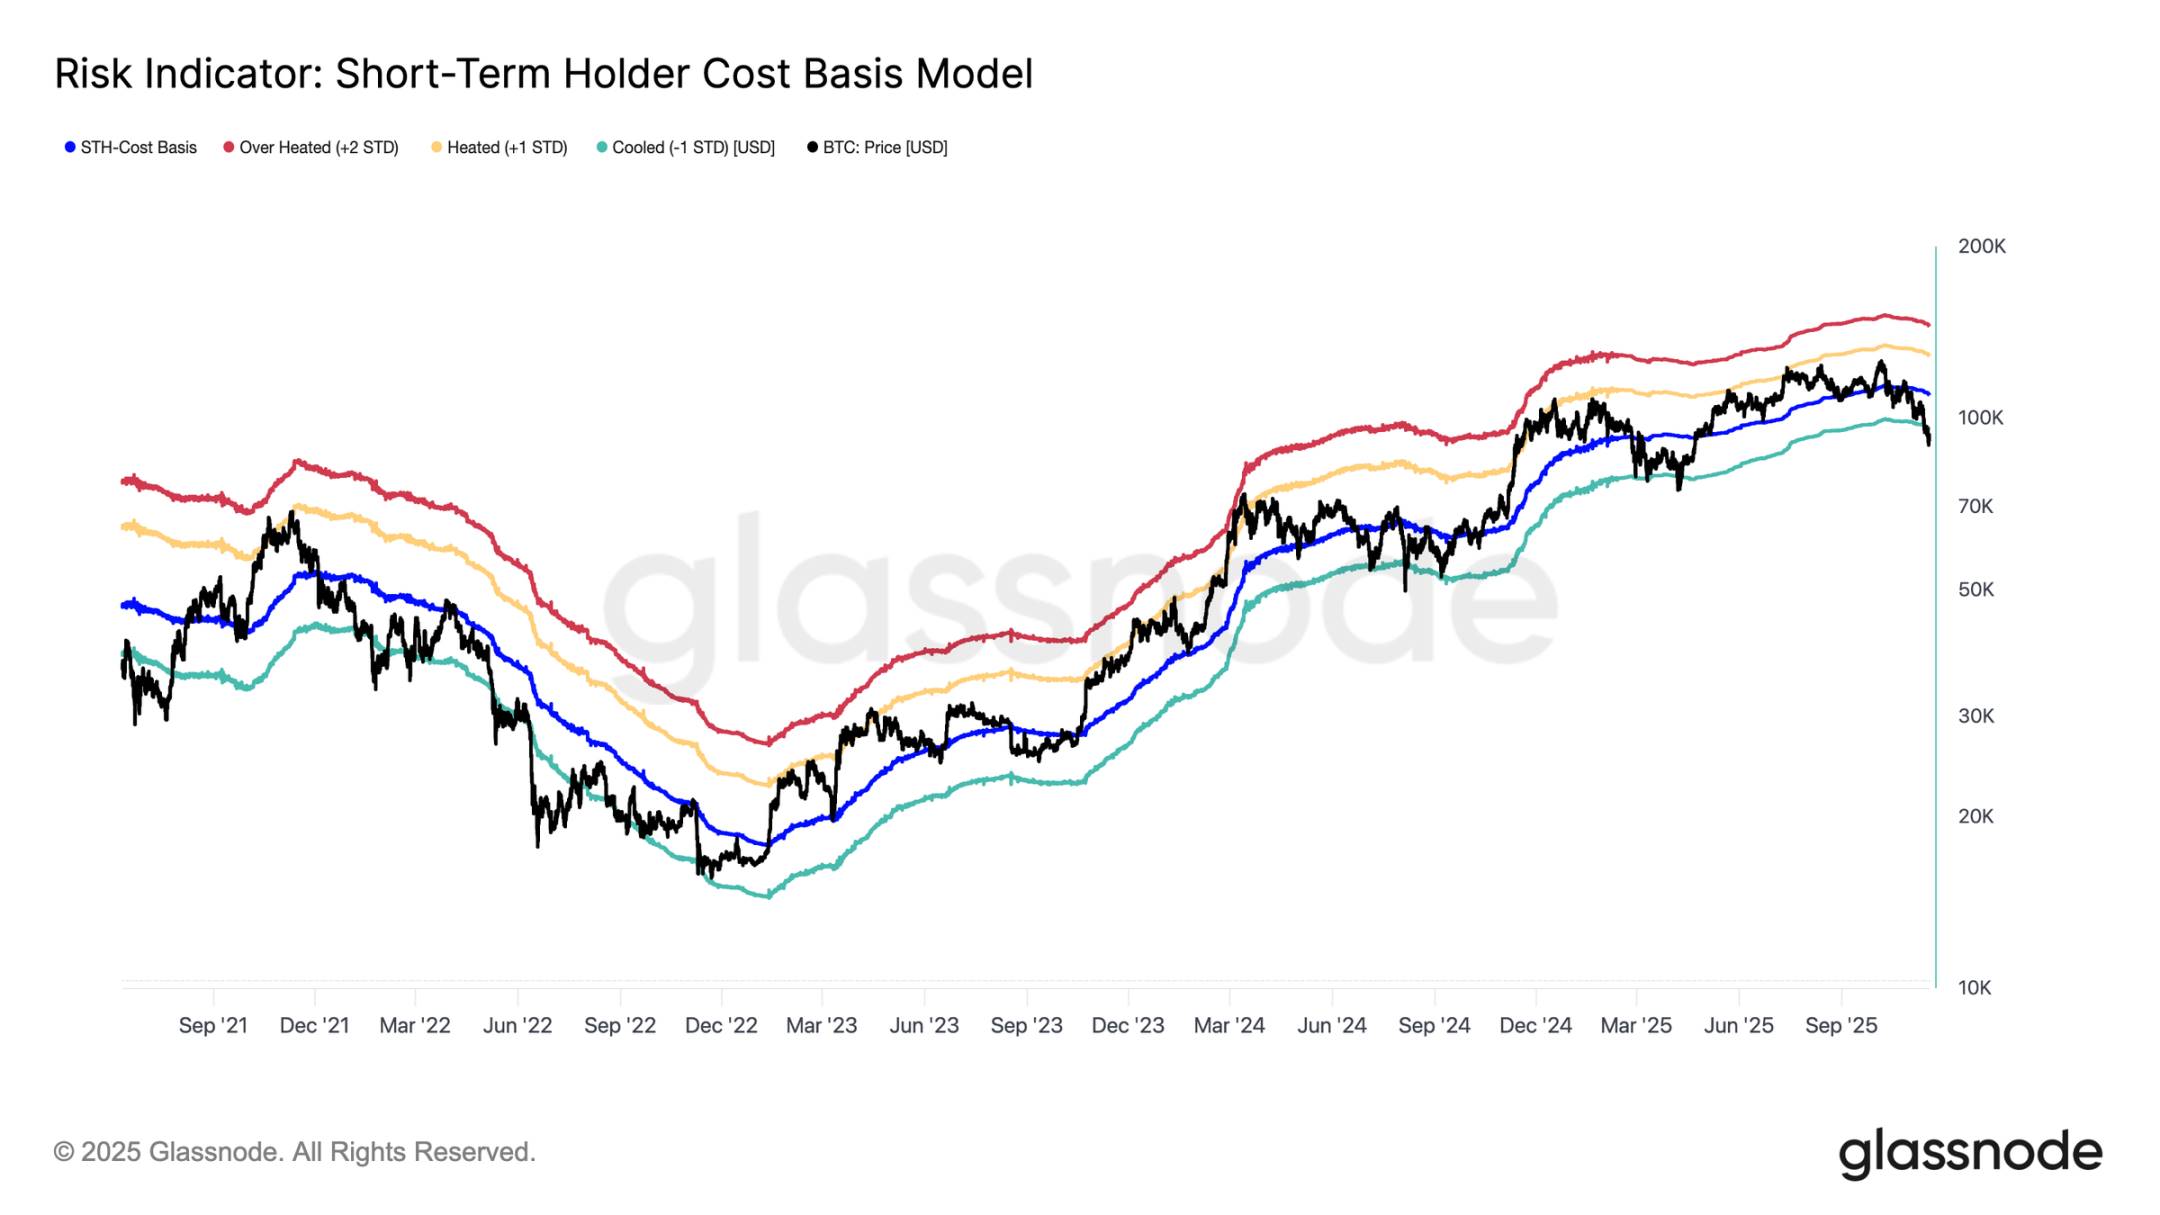
Further correction, testing the bottom at 70k, probability is 15%; continued consolidation, oscillating up and down, using time to trade for space, probability is 50%.
Written by: Yue Xiaoyu
The price of bitcoin has dropped nearly 30% from 120,000 to 90,000.
I have been dollar-cost averaging into bitcoin for three years, yet I still haven’t sold at the top.
Lately, I keep regretting not selling at 120,000,
Now my profits have pulled back significantly,
I am very afraid I will ride a rollercoaster of wealth,
If the four-year cycle theory of the bitcoin market is not broken,
This means I will have to wait another 4 years.
How many four years are there in a lifetime?
So, have we really entered a bear market now?
I believe I’m not the only one; many people want to know the answer.
To avoid various market noise affecting my judgment—and honestly, to give myself some psychological comfort—I used various analytical frameworks for a comprehensive assessment, and the conclusion is still quite optimistic.
Everyone can join in for a bit of psychological comfort
Fear and Greed Index
The current index is 15 (Extreme Fear), and market panic has lasted for a month.
Extreme fear is often accompanied by a selling cycle, reinforcing downward pressure.
If the index remains below 20, it may trigger further liquidations.
But from historical data, extreme fear is a buying opportunity.
The current panic may be close to the bottom, and a short-term rebound is likely.
This analytical framework suggests we are in a short-term bear market, but not a full bull-to-bear transition.
Technical Analysis
The 50-day/200-day MA indicator, the death cross (short-term MA crossing below long-term MA) has been confirmed, similar to the start of the 2022 bear market.
Technically, this is a strong bear market signal, the trend is reversing, and the downside target is $74,000–$80,000.
The RSI (14-day) indicator dropped rapidly from 70+ (overbought) to 35 (oversold), accompanied by high volatility. Short-term oversold suggests a rebound, but unless it breaks below 30, there is no strong reversal.
So, from technical indicators, it’s clearly a bear market, but the oversold condition suggests a rebound may occur within 1–2 weeks.
Fundamental Analysis
ETF inflows: $61.9 billions inflow for the year, but turned to outflows after Q3. Institutions (such as MicroStrategy) are still accumulating, but retail panic is increasing selling pressure.
Market liquidity: First, the US government shutdown, Treasury funds not injected into the market, and then intensified disagreements over a December rate cut, overall uncertainty has increased.
Bitcoin’s correlation with traditional markets has risen to 0.6–0.7, affected by interest rates, inflation, and liquidity. 2025 will mainly be macro tightening.
From a fundamental perspective, it’s still a bull market, even a long-term bull. The big liquidity injection hasn’t arrived yet, but short-term outflows are a market correction.
On-chain Data Analysis
Active addresses: Down 20% from the peak.
Transaction volume: Plummeted 30%.
Holding addresses: Long-term holders (>1 year) now account for 65%. UTXO age distribution still shows accumulation, not panic selling.
On-chain weakness shows the market is very bearish now, but holding behavior data shows it’s not a total collapse.
Market Cycle Analysis
The traditional 4-year cycle driven by bitcoin halving was deformed in 2025, mainly due to ETF influence and traditional capital entering.
19 months after the halving, historically the all-time high should be higher, but ETF absorption of supply has changed the dynamics, and the peak impact has weakened.
Similar to the late 2017 cycle, there will be a rebound after a 20% drop.
Therefore, the bull market may extend to 2026, with a target price still at 200,000.
To summarize
Have we really entered a bear market now?
In the short term (1–3 months), we have entered a bear market correction. Technical, on-chain, and macro factors all show downward pressure, with a target range of 70–80k, probability 40%.
But we have not entered a full bear market. Institutional ETF and on-chain holding behavior show the fundamentals are still solid, no risk of collapse, and the cycle may extend to 2026.
How will the market develop next?
Further correction, testing the bottom at 70k, probability is 15%;
Continued consolidation, oscillating up and down, using time to trade for space, probability is 50%;
Subsequent rebound, returning above 100k or even reaching new highs, probability is 35%.
Disclaimer: The content of this article solely reflects the author's opinion and does not represent the platform in any capacity. This article is not intended to serve as a reference for making investment decisions.
You may also like
Data Insight: Bitcoin's Year-to-Date Gains Turn Negative, Is a Full Bear Market Really Here?
Spot demand remains weak, outflows from US spot ETFs are intensifying, and there has been no new buying from traditional financial allocators.
Why can Bitcoin support a trillion-dollar market cap?
The only way to access the services provided by bitcoin is to purchase the asset itself.
Crypto Has Until 2028 to Avoid a Quantum Collapse, Warns Vitalik Buterin

Crypto ETF See Mixed Flows Amid BTC Recovery