ArkStream Capital: Q3 Upswing Comes to an End, Q4 Enters Repricing Phase

Entering the fourth quarter, the market faced both macroeconomic uncertainties and the eruption of structural risks within the crypto market itself. The market rhythm reversed sharply, shattering previous optimistic expectations.
Original Title: "ArkStream Capital: Q3 Uptrend Ends, Q4 Enters Repricing Range"
Original Author: ArkStream Capital
The third quarter of 2025 holds critical significance for the crypto market as a transitional period: it continued the rebound of risk assets since July and further confirmed a macro turning point after the interest rate cut in September. However, entering the fourth quarter, the market was simultaneously hit by macro uncertainties and structural risks within the crypto market itself, causing a sharp reversal in market rhythm and shattering previous optimistic expectations.
As the pace of inflation decline slowed, coupled with the longest government shutdown in US history in October and escalating fiscal disputes, the latest FOMC meeting minutes clearly signaled "caution against premature rate cuts," causing market judgment on policy paths to swing violently. The previously clear narrative of "the rate-cut cycle has begun" was quickly weakened, and investors began to reprice potential risks such as "higher rates for longer" and "soaring fiscal uncertainty." The repeated speculation around rate-cut expectations significantly increased volatility in risk assets. Against this backdrop, the Federal Reserve also deliberately suppressed excessive market expectations to avoid premature easing of financial conditions.
As policy uncertainty increased, the prolonged government shutdown further intensified macro pressures, exerting a dual squeeze on economic activity and financial liquidity:
• GDP growth was significantly dragged down: The Congressional Budget Office estimated that the government shutdown would lower the actual annualized GDP growth rate for Q4 2025 by 1.0% - 2.0%, equivalent to billions of dollars in economic losses.
• Key data missing and liquidity contraction: The shutdown led to the inability to release key data such as non-farm payrolls, CPI, and PPI on schedule, plunging the market into a "data blind spot" and increasing the difficulty of policy and economic judgment; at the same time, the interruption of federal spending passively tightened short-term liquidity, putting pressure on risk assets across the board.
Entering November, debate within the US stock market over whether the AI sector is experiencing a stage of overvaluation has continued to heat up, with volatility in high-valuation tech stocks rising and overall risk appetite being affected, making it difficult for crypto assets to gain spillover support from the US stock beta end. Although the early pricing in of rate cuts in Q3 had significantly boosted risk appetite, this "liquidity optimism" was clearly weakened in Q4 due to the government shutdown and repeated policy uncertainty, and risk assets generally entered a new round of repricing.
While macro uncertainty was rising, the crypto market also faced its own structural shocks. In July and August, bitcoin and ethereum both broke historical highs (bitcoin surged above $120,000; ethereum reached around $4,956 at the end of August), and market sentiment turned positive for a period.
However, the large-scale liquidation event at Binance on October 11 became the most severe systemic shock in the crypto industry:
• As of November 20, both bitcoin and ethereum had experienced significant pullbacks from their highs, market depth was weakened, and the long-short divergence widened.
• The liquidity gap caused by the liquidation weakened overall market confidence, market depth dropped significantly in early Q4, and the spillover effect of the liquidation intensified price volatility and increased counterparty risk.
Meanwhile, inflows into spot ETFs and coin-stock DATs slowed significantly in Q4, institutional buying was insufficient, making it difficult to hedge the selling pressure from liquidations, causing the crypto market to gradually enter a high turnover and choppy phase from late August, eventually evolving into a more pronounced correction.
Looking back at Q3, the crypto market's rise was partly due to an overall rebound in risk appetite and partly due to the positive impact of listed companies promoting DAT (Digital Asset Treasury) strategies. Such strategies increased institutional acceptance of crypto asset allocation and improved the liquidity structure of some assets, becoming one of the core narratives of the quarter. However, as the liquidity environment tightened and price corrections intensified in Q4, the sustainability of DAT-related buying began to weaken.
The essence of the DAT strategy is that companies include some token assets on their balance sheets and use on-chain liquidity, yield aggregation, and staking tools to improve capital efficiency. As more listed companies and funds attempt to cooperate with stablecoin issuers, liquidity protocols, or tokenization platforms, this model is gradually moving from conceptual exploration to practical implementation. In this process, assets such as ETH, SOL, BNB, ENA, and HYPE have shown a trend of "token-equity-asset" boundary integration in different dimensions, reflecting the bridging role of digital asset treasuries in the macro liquidity cycle.
However, in the current market environment, innovative asset valuation frameworks related to DAT (such as mNAV) have generally fallen below 1, indicating a market discount on the net value of on-chain assets. This phenomenon reflects investors' concerns about the liquidity, yield stability, and sustainability of valuations for related assets, and also means that the asset tokenization process faces some adjustment pressure in the short term.
At the sector level, several segments have shown sustained growth momentum:
• The stablecoin sector continues to expand in market capitalization, with total market cap surpassing $297 billion, further strengthening its role as a capital anchor in a macro-uncertain environment.
• The Perp sector, represented by HYPE and ASTER, has achieved significant activity growth through trading structure innovations (such as on-chain matching, funding rate optimization, and tiered liquidity mechanisms), becoming a major beneficiary of capital rotation during the quarter.
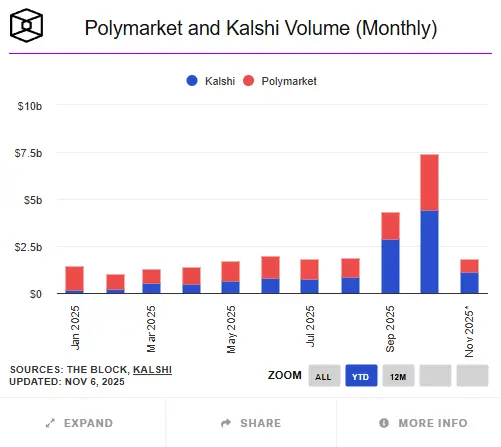
• The prediction market sector has become active again amid macro expectation volatility, with Polymarket and Kalshi reaching record trading volumes, serving as real-time indicators of market sentiment and risk appetite.
The rise of these sectors indicates that capital is shifting from single price speculation to structured allocation around the three core logics of "liquidity efficiency—yield generation—information pricing."
Overall, the misalignment of rhythms between the crypto and US stock markets in Q3 2025 transformed in Q4 into a concentrated exposure of structural risks and a comprehensive rise in liquidity pressure. The government shutdown delayed the release of key macro data and exacerbated fiscal uncertainty, weakening overall market confidence; debates over AI valuations in US stocks increased volatility, while the crypto market faced more direct liquidity and depth shocks after the Binance liquidation event. At the same time, DAT strategy inflows slowed, mNAVs generally fell below 1, showing that the market remains highly sensitive to the liquidity environment during institutionalization, with obvious fragility. Whether the market can stabilize going forward will mainly depend on the speed at which the impact of liquidation events is digested and whether liquidity and sentiment stability can gradually recover in an environment of increased long-short divergence.
Rate Cut Expectations Realized, Market Enters Repricing Phase
In Q3 2025, the key variable in the global macro environment was not the "rate cut" event itself, but the generation, trading, and consumption of rate cut expectations. The market began pricing in a liquidity inflection point as early as July, and the actual policy action became a node to verify existing consensus.
After two quarters of gamesmanship, the Federal Reserve lowered the federal funds rate target range by 25 basis points to 4.00%–4.25% at the September FOMC meeting, and then made another small rate cut at the October meeting. However, since the market had already heavily bet on rate cuts, the policy move itself had limited marginal impact on risk assets, and the signaling effect of the rate cut had already been largely priced in. Meanwhile, as the pace of inflation slowed and economic resilience exceeded expectations, the Fed began to clearly express concerns about "the market pricing in consecutive rate cuts next year in advance," causing the probability of a further rate cut in December to drop significantly after October. This communication stance became a new variable dragging down market risk appetite.
Macro data in Q3 showed a "moderate cooling" trend:
• Core CPI annual rate fell from 3.3% in May to 2.8% in August, confirming the downward trend in inflation;
• Non-farm payrolls increased by less than 200,000 for three consecutive months;
• Job vacancy rate fell to 4.5%, the lowest level since 2021.
This set of data indicates that the US economy has not fallen into recession but has entered a moderate slowdown, providing the Fed with policy space for "controllable rate cuts." As a result, the market had already formed a consensus on "certain rate cuts" as early as July.
According to the CME FedWatch tool, the probability of a 25 basis point rate cut in September had exceeded 95% by the end of August, meaning the market had almost fully priced in the expectation in advance. The bond market also reflected this signal:
• 10-year US Treasury yield fell from 4.4% at the start of the quarter to 4.1% at the end;
• 2-year yield fell even more, by about 50bps, showing that bets on policy shifts were more concentrated.
The macro turning point in Q3 was more about "digesting expectations" than "policy change." Pricing for liquidity repair was basically completed in July–August, and the actual rate cut in September was just a formal confirmation of existing consensus. For risk assets, the new marginal variable shifted from "whether to cut rates" to "the pace and sustainability of rate cuts."
However, when the rate cut actually happened, the marginal effect of expectations had been fully consumed, and the market quickly entered a vacuum phase of "no new catalysts."
From mid-September, changes in macro indicators and asset prices became noticeably muted:
• US Treasury yield curve flattened: As of the end of September, the 10-year–3-month Treasury spread was only about 14 basis points, indicating that while term premium still existed, the inversion risk had been eliminated.
• US Dollar Index fell to the 98–99 range, significantly weaker than the year's high (107), but dollar funding costs remained tight at quarter-end settlement.
• Marginal contraction in US stock market liquidity: The Nasdaq continued to rise, but ETF inflows slowed and trading volume growth was weak, indicating that institutions had begun adjusting risk exposure at high levels.
This "vacuum period after expectations are realized" became the most representative macro phenomenon of the quarter. The market traded on "certainty of rate cuts" in the first half, and began pricing in "the reality of slowing growth" in the second half.
The dot plot (SEP) released at the Fed's September meeting showed clear internal disagreement among policymakers on the future rate path:
• The median policy rate expectation for the end of 2025 was lowered to 3.9%;
• Committee members' forecasts ranged from 3.4%–4.4%, reflecting divergent views on inflation stickiness, economic resilience, and policy space.
After the September rate cut and another small cut in October, the Fed's communication gradually shifted to a more cautious tone to avoid premature easing of financial conditions. As a result, the previously highly anticipated probability of another rate cut in December has now dropped significantly, and the policy path has returned to a "data-dependent" rather than "preset pace" framework.
Unlike previous rounds of "crisis-driven easing," this round of rate cuts is a controllable policy adjustment. The Fed continued to shrink its balance sheet while cutting rates, sending a signal of "stabilizing capital costs and curbing inflation expectations," emphasizing a balance between growth and prices rather than actively expanding liquidity. In other words, the interest rate inflection point has been established, but the liquidity inflection point has not yet arrived.
Against this backdrop, the market showed clear differentiation. Lower financing costs provided valuation support for some high-quality assets, but broad liquidity did not expand significantly, and capital allocation became more cautious.
• Sectors with robust cash flow and earnings support (AI, tech blue chips, some DAT-type US stocks) continued their valuation recovery trend;
• Assets with high leverage, high valuation, or lacking cash flow support (including some growth stocks and non-mainstream crypto tokens) saw momentum weaken after expectations were realized, with a marked decline in trading activity.
In general, Q3 2025 was a "period of expectation realization," not a "period of liquidity release." The market priced in rate cut certainty in the first half and shifted to reassessing slowing growth in the second half. The early consumption of expectations kept risk assets at high levels but lacking sustained upward momentum. This macro pattern laid the foundation for subsequent structural differentiation and explains the "breakout—pullback—high-level oscillation" trend seen in the crypto market in Q3: capital flowed to relatively robust, cash flow-verifiable assets rather than systemic risk assets.
DAT Boom and Structural Turning Point for Non-Bitcoin Assets
In Q3 2025, Digital Asset Treasury (DAT) rose from a marginal concept in the crypto industry to the fastest-spreading new theme in global capital markets. For the first time, public market capital entered crypto assets simultaneously in both scale and mechanism: through traditional financing tools such as PIPE, ATM, and convertible bonds, billions of dollars in fiat liquidity flowed directly into the crypto market, forming a "coin-stock linkage" structural trend.
The starting point of the DAT model can be traced back to the traditional market pioneer MicroStrategy (NASDAQ: MSTR). Since 2020, the company has taken the lead in including bitcoin on its corporate balance sheet, and between 2020–2025, it accumulated about 640,000 bitcoins through multiple rounds of convertible bonds and ATM issuances, with a total investment of over $47 billion. This strategic move not only reshaped the company's asset structure but also created a paradigm in which traditional stocks became "secondary carriers" of crypto assets.
Due to systemic differences in valuation logic between the equity market and on-chain assets, MicroStrategy's stock price has long been higher than its bitcoin net value, with mNAV (market cap / on-chain asset net value) maintained at 1.2–1.4 times for years. This "structural premium" reveals the core mechanism of DAT:
Companies use public market financing to hold crypto assets, creating two-way interaction and valuation feedback between fiat capital and crypto assets at the company level.
Mechanistically, MicroStrategy's experiment laid the three pillars of the DAT model:
• Financing channel: Introducing fiat liquidity through PIPE, ATM, or convertible bonds to provide funds for on-chain asset allocation;
• Asset reserve logic: Including crypto assets in financial statements to form a corporate-level "On-Chain Treasury";
• Investor entry: Allowing traditional capital market investors to gain indirect exposure to crypto assets via stocks, reducing compliance and custody barriers.
Together, these three form the "structural loop" of DAT: financing—position holding—valuation feedback. Companies use traditional financial tools to absorb liquidity, form crypto asset reserves, and then create capital accretion through equity market premiums, achieving dynamic rebalancing between capital and tokens.
The significance of this structure is that it is the first time digital assets have entered the balance sheets of the traditional financial system in a compliant manner, and it gives capital markets a brand-new asset form—"tradable on-chain asset mapping." In other words, companies are no longer just on-chain participants but become structural intermediaries between fiat capital and crypto assets.
As this model was validated and rapidly replicated by the market, Q3 2025 marked the second stage of DAT concept diffusion: from a bitcoin-centric "store-of-value treasury" to productive assets such as ethereum (ETH) and solana (SOL) (PoS yield or DeFi yield). This new generation of DAT models uses mNAV (market cap / on-chain asset net value) as the core pricing system, incorporating yield assets into corporate cash flow and valuation logic, forming a "yield-driven treasury cycle." Unlike early bitcoin treasuries, ETH, SOL, etc. have sustainable staking yields and on-chain economic activity, giving their treasury assets not only store-of-value attributes but also cash flow characteristics. This change marks DAT's shift from pure asset holding to a stage of capital structure innovation centered on productive yield, becoming a key bridge connecting the value of productive crypto assets with the valuation system of traditional capital markets.
Note: Entering November 2025, a new round of crypto market declines triggered the most systemic valuation repricing in the DAT sector since its inception. As core assets such as ETH, SOL, and BTC experienced rapid pullbacks of 25–35% in October–November, and some DAT companies accelerated balance sheet expansion via ATM, causing short-term dilution, the mNAV of mainstream DAT companies generally fell below 1. BMNR, SBET, FORD, etc. all experienced varying degrees of "discount trading" (mNAV≈0.82–0.98), and even MicroStrategy (MSTR), which had long maintained a structural premium, briefly saw its mNAV fall below 1 in November, the first time since the bitcoin treasury strategy started in 2020. This phenomenon marks the market's shift from a previous period of structural premium to a defensive stage of "asset-led, valuation discounting." Institutional investors generally regard this as the first comprehensive "stress test" for the DAT industry, also reflecting that capital markets are reassessing the sustainability of on-chain asset yields, the rationality of treasury expansion pace, and the long-term impact of financing structures on equity value.
SBET and BMNR Lead the Ethereum Treasury Wave
In Q3 2025, the ethereum treasury (ETH DAT) market structure was initially established. Among them, SharpLink Gaming (NASDAQ: SBET) and BitMine Immersion Technologies (NASDAQ: BMNR) became two leading companies defining the industry paradigm. They not only replicated MicroStrategy's balance sheet strategy but also achieved a leap "from concept to institution" in financing structure, institutional participation, and information disclosure standards, building the dual pillars of the ETH treasury cycle.
BMNR: The Capital Engineering of Ethereum Treasury
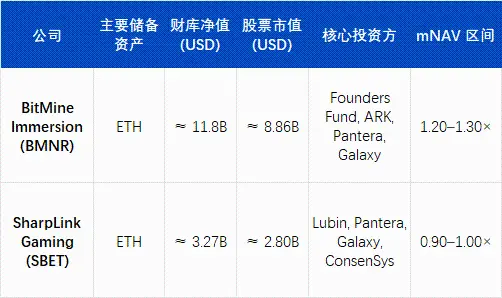
As of the end of September 2025, BitMine Immersion Technologies (BMNR) had established itself as the world's largest ethereum treasury. According to the company's latest disclosure, it holds about 3,030,000 ETH, which, at the October 1 closing price of $4,150/ETH, corresponds to on-chain net assets of about $12.58 billion. Including company cash and other liquid assets, BMNR's total crypto and cash holdings are about $12.9 billion.
By this estimate, BMNR's holdings account for about 2.4–2.6% of ethereum's circulating supply, making it the first listed institution to hold over 3 million ETH. The corresponding stock market cap is about $11.2–11.8 billion, with an estimated mNAV ≈ 1.27×, the highest among all DAT-type listed companies.
BMNR's strategic leap is closely related to its organizational restructuring. Chairman Tom Lee (former Fundstrat co-founder) took full control of capital operations in mid-2025 and put forward the core thesis: "ETH is the institutional sovereign asset of the future." Under his leadership, the company completed a structural transformation from a traditional mining company to "ETH as the sole reserve asset, PoS yield as the core cash flow," becoming the first US-listed company to make ethereum staking yield its main operating cash flow.
In terms of financing, BMNR demonstrated rare intensity and execution efficiency. The company expanded funding sources in both public and private channels, providing long-term ammunition for its ethereum treasury strategy. This quarter, BMNR not only refreshed the financing pace of traditional capital markets but also laid the institutional prototype for "on-chain asset securitization."
On July 9, BMNR filed a Form S-3 registration statement and signed an "At-the-Market (ATM)" issuance agreement with Cantor Fitzgerald and ThinkEquity, with an initial authorization limit of $2 billion. Just two weeks later, on July 24, the company disclosed in an SEC 8-K filing that it had raised the limit to $4.5 billion in response to the market's positive reaction to its ETH treasury model. On August 12, the company again submitted a supplement to the SEC, raising the total ATM limit to $24.5 billion (an additional $20 billion), and specifying the use of funds for purchasing ETH and expanding the PoS staking asset portfolio.
These limits represent the maximum amount of stock BMNR is authorized by the SEC to issue at market price, not the actual cash raised.
In terms of actual funding, the company has completed several concrete transactions:
• In early July 2025, completed a $250 million PIPE private placement to fund initial ETH accumulation;
• ARK Invest (Cathie Wood) disclosed on July 22 the purchase of about $182 million in BMNR common stock, of which $177 million in net proceeds was used by the company to increase ETH holdings;
• Founders Fund (Peter Thiel) filed with the SEC on July 16 for a 9.1% stake, which, while not new financing, strengthened institutional consensus in the market.
In addition, under its early ATM authorization, BMNR has sold about $4.5 billion worth of stock, with actual fundraising significantly exceeding the initial PIPE amount. As of September 2025, the company had raised billions of dollars through PIPE + ATM and other channels, and continues to pursue long-term expansion under the $24.5 billion total authorization framework.
BMNR's financing system has a clear three-layer structure:
• Certainty funding layer—completed PIPE and institutional placements, about $450–500 million;
• Market expansion layer—phased stock sales via ATM, with actual fundraising reaching the billions of dollars level;
• Potential ammunition layer—the $24.5 billion ATM total limit approved by the SEC, providing upper-limit flexibility for future ETH treasury expansion.
With this layered capital structure, BMNR quickly established a reserve of about 3.03 million ETH (worth about $12.58 billion), achieving a transformation from "single-position experiment" to "institutional asset allocation" in its treasury strategy.
BMNR's valuation premium mainly comes from two logics:
• Asset-level premium: PoS staking yield remains at 3.4–3.8% annualized, forming a stable cash flow anchor;
• Capital-level premium: As a "compliant ETH leverage channel," its stock price usually leads ETH spot by 3–5 trading days, becoming a forward indicator for institutions tracking the ETH market.
In terms of market behavior, BMNR's stock price hit record highs in Q3 in sync with ETH, and often led sector rotations. Its high turnover rate and speed of floating stock circulation indicate that the DAT model is gradually evolving into a "tradable on-chain asset mapping mechanism" in capital markets.
SBET: A Transparent Sample of Institutionalized Treasury
Compared to BitMine Immersion Technologies (BMNR)'s aggressive balance sheet expansion, SharpLink Gaming (NASDAQ: SBET) chose a more stable and institutionalized treasury path in Q3 2025. Its core competitiveness lies not in capital scale, but in the construction of transparent governance structure, disclosure standards, and audit systems, establishing a replicable "institutional-grade template" for the DAT industry.
As of September 2025, SBET held about 840,000 ETH, with on-chain assets of about $3.27 billion at the quarter-end average price, corresponding to a stock market cap of about $2.8 billion, mNAV ≈ 0.95×. Although the valuation is slightly below net assets, the company's quarterly EPS growth reached 98%, demonstrating strong operating leverage and execution efficiency in ETH yield generation and cost control.
SBET's core value lies not in aggressive position expansion, but in establishing the first compliant, auditable governance framework for the DAT industry:
• Strategic advisor Joseph Lubin (Ethereum co-founder, ConsenSys founder) joined the company's strategy committee in Q2, promoting the inclusion of staking yields, DeFi derivatives, and liquidity mining strategies in the corporate treasury portfolio;
• Pantera Capital and Galaxy Digital participated in PIPE financing and secondary market holdings, providing institutional liquidity and on-chain asset allocation advice;
• Ledger Prime provided on-chain risk hedging and volatility management models;
• Grant Thornton, as an independent auditor, was responsible for verifying the authenticity of on-chain assets, yields, and staking accounts.
This governance system constitutes the industry's first "on-chain verifiable + traditional audit parallel" disclosure mechanism.
In the 10-Q report for Q3 2025, SBET fully disclosed for the first time:
• The company's main wallet addresses and on-chain asset structure;
• Staking yield curve and node distribution;
• Risk limits for collateral and restaking positions.
This report made SBET the first listed company to simultaneously disclose on-chain data in SEC filings, significantly increasing institutional investor trust and financial comparability. The market generally regards SBET as a "compliant ETH index constituent": its mNAV is close to 1×, its price is highly correlated with the ETH market, but due to information transparency and stable risk structure, it has relatively low volatility characteristics.
Dual Mainlines of ETH Treasury: Asset-Driven and Governance-Driven
The divergent paths of BMNR and SBET formed the two core trunks of ETH DAT ecosystem development in Q3 2025:
• BMNR: Asset-driven—focused on financing expansion, institutional holdings, and capital premium. BMNR quickly accumulated ETH positions using PIPE and ATM financing tools, and formed a market leverage channel through mNAV pricing, promoting direct coupling of fiat capital and on-chain assets.
• SBET: Governance-driven—focused on transparent compliance, structured treasury yields, and risk control. SBET incorporated on-chain assets into audit and disclosure systems, establishing the institutional boundaries of DAT through a governance structure that combines on-chain verification and traditional accounting.
The two represent the two poles of ETH treasury's shift from "reserve logic" to "institutionalized asset form": the former expands capital scale and market depth, while the latter lays the foundation for governance trust and institutional compliance. In this process, the functional attributes of ETH DAT have gone beyond "on-chain reserve assets" and evolved into a composite structure integrating cash flow generation, liquidity pricing, and balance sheet management.
Institutional Logic of PoS Yield, Governance Rights, and Valuation Premium
The core competitiveness of PoS crypto asset treasuries such as ETH comes from the triple combination of yield-bearing asset structure, network-level governance power, and market valuation mechanism.
High Staking Yield: Establishing a Cash Flow Anchor
Unlike bitcoin's "non-productive holding," ETH, as a PoS network asset, can earn 3–4% annualized yield through staking and form a composite yield structure in the DeFi market (Staking + LST + Restaking). This allows DAT companies to capture real on-chain cash flow in a corporate form, transforming digital assets from "static reserves" to "yield assets" with stable endogenous cash flow characteristics.
Governance Power and Resource Scarcity under PoS Mechanism
After expanding staking scale, ETH treasury companies gain network-level governance and ordering power. BMNR and SBET currently control about 3.5–4% of total ETH staked, entering the marginal impact range of protocol governance. This control has a "systemic status" premium logic, and the market is willing to give a valuation multiple above asset net value.
Formation Mechanism of mNAV Premium
DAT company valuations reflect not only the net value (NAV) of their on-chain assets but also two types of expectations:
• Cash flow premium: distributable profit expectations from staking yields and on-chain strategies;
• Structural premium: corporate equity provides traditional institutions with a compliant ETH exposure channel, creating institutional scarcity.
At the market highs in July–August, the average mNAV of ETH DATs remained at 1.2–1.3 times, with some companies (BMNR) reaching as high as 1.5 times. This valuation logic is similar to the premium of gold ETFs or the NAV discount/premium structure of closed-end funds, serving as an important "pricing intermediary" for institutional capital entering on-chain assets.
In other words, the DAT premium is not sentiment-driven, but based on a composite structure of real yield, network power, and capital channels. This also explains why ETH treasuries achieved higher capital density and trading activity than bitcoin treasuries (MSTR model) in just one quarter.
Structural Evolution from ETH to Multi-Altcoin Treasury
Entering August–September, the expansion speed of non-ethereum DATs accelerated significantly. The new wave of institutional allocation represented by Solana treasury marks a shift in market theme from "single asset reserve" to "multi-chain asset layering." This trend means the DAT model is being replicated from ETH core to multiple ecosystems, forming a more systemic cross-chain capital structure.
FORD: An Institutionalized Sample of Solana Treasury
Forward Industries (NASDAQ: FORD) became the most representative case in this phase. The company completed $1.65 billion in PIPE financing in Q3, with all funds used for Solana spot accumulation and ecosystem collaboration investments. As of September 2025, FORD held about 6.82 million SOL, with on-chain treasury net value of about $1.69 billion at the quarter-end average price of $248–$252, corresponding to a stock market cap of about $2.09 billion, mNAV ≈ 1.24×, ranking first among non-ETH treasury companies.
Unlike early ETH DATs, FORD's rise was not driven by a single asset, but was the result of multi-party capital and ecosystem resonance:
• Investors include Multicoin Capital, Galaxy Digital, and Jump Crypto, all long-term core investors in the Solana ecosystem;
• The governance structure introduced members of the Solana Foundation advisory committee, establishing a strategic framework of "on-chain assets as corporate production materials";
• SOL assets held remain fully liquid, with no staking or DeFi allocation yet, preserving strategic flexibility for subsequent restaking and RWA asset linkage.
This "high liquidity + configurable treasury" model makes FORD the capital hub of the Solana ecosystem and reflects the market's structural premium expectations for high-performance public chain assets.
Structural Changes in the Global DAT Landscape
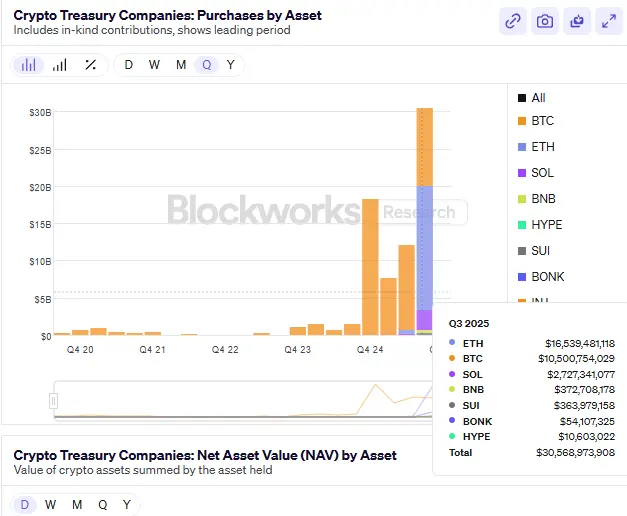
As of the end of Q3 2025, the total scale of publicly disclosed non-bitcoin DAT treasuries worldwide had exceeded $24 billion, up about 65% from Q2. The structural distribution is as follows:
• Ethereum (ETH) still dominates, accounting for about 52% of the total;
• Solana (SOL) accounts for about 25%, becoming the second largest direction for institutional capital allocation;
• The remaining funds are mainly distributed among BNB, SUI, HYPE, and other emerging assets, forming the horizontal expansion layer of the DAT model.
The valuation anchor of ETH DAT lies in PoS yield and governance value, representing the combined logic of long-term cash flow and network control; SOL DAT's core premium comes from ecosystem growth and staking efficiency, emphasizing capital efficiency and scalability. BMNR and SBET established the institutional and asset foundation in the ETH phase, while FORD's emergence pushed the DAT model into a second stage of multi-chain and ecosystem development.
Meanwhile, some new entrants are exploring functional extensions of DAT:
• Ethena (ENA) launched the StablecoinX model, combining treasury yields with on-chain hedging structures, attempting to build a "yield-type stablecoin treasury" to create a stable but cash-flow-generating reserve asset;
• BNB DAT is led by the exchange system, expanding liquidity pools through asset collateralization and reserve tokenization by ecosystem enterprises, forming a "closed treasury system."
Stage Stagnation and Risk Repricing after Valuation Overshoot
After the concentrated uptrend in July–August, the DAT sector entered a rebalancing phase after valuation overshoot in September. Second-tier treasury stocks once pushed the sector's overall premium higher, with the median mNAV breaking 1.2×, but as regulation tightened and financing slowed, valuation support quickly retreated at quarter-end, and sector heat cooled significantly.
Structurally, the DAT industry is transitioning from "asset innovation" to "institutional integration." ETH and SOL treasuries have established a "dual-core valuation system," but the liquidity, compliance, and real yield of expansionary assets are still in the verification stage. In other words, market drivers have shifted from "premium expectations" to "yield realization," and the industry has entered a repricing cycle.
After September, core indicators weakened simultaneously:
• ETH staking yield fell from 3.8% at the start of the quarter to 3.1%, and SOL staking yield dropped by more than 25% quarter-on-quarter;
• Several second-tier DAT companies mNAV has fallen below 1, with marginally decreasing capital efficiency;
• Total PIPE and ATM financing fell about 40% quarter-on-quarter, and institutions such as ARK, VanEck, and Pantera suspended new DAT allocations;
• At the ETF level, net capital inflows turned negative, and some funds replaced ETH treasury positions with short-duration Treasury ETFs to reduce valuation volatility risk.
This correction exposed a core issue: the capital efficiency of the DAT model was overshot in the short term. Early valuation premiums were driven by structural innovation and institutional scarcity, but when on-chain yields declined and financing costs rose, corporate balance sheet expansion outpaced yield growth, falling into a "negative dilution cycle"—i.e., market cap growth depended on financing rather than cash flow.
At the macro level, the DAT sector is entering a "valuation internalization period":
• Core companies (BMNR, SBET, FORD) maintain structural stability with robust treasuries and information transparency;
• Peripheral projects face deleveraging and liquidity contraction due to single capital structures and insufficient disclosure;
• On the regulatory side, the SEC requires companies to disclose main wallet addresses and staking yield disclosure standards, further compressing the space for "high-frequency balance sheet expansion."
Short-term risks mainly come from valuation compression caused by liquidity reflexivity. When mNAV continues to decline and PoS yields cannot cover financing costs, market confidence in the "on-chain reserve + equity pricing" model will be damaged, leading to a systemic valuation correction similar to the post-DeFi summer of 2021. Nevertheless, the DAT industry has not entered a recession but is transitioning from a "balance sheet expansion-driven" to a "yield-driven" stage. In the next few quarters, ETH and SOL treasuries are expected to maintain institutional advantages, with their core valuations increasingly dependent on:
Staking and restaking yield efficiency;
On-chain transparency and compliance disclosure standards.
In other words, the first phase of the DAT boom has ended, and the industry has entered a "consolidation and verification period." The key variables for future valuation normalization will be the stability of PoS yields, the integration efficiency of restaking, and the clarity of regulatory policies.
Prediction Markets: "Barometer" of Macro Narratives and the Rise of the Attention Economy
In Q3 2025, prediction markets rose from a "crypto-native marginal play" to a "new market infrastructure at the intersection of on-chain and compliant finance." Amid frequent macro policy changes and sharp fluctuations in inflation and interest rate expectations, prediction markets have gradually become important venues for capturing market sentiment, hedging policy risk, and discovering narrative prices. The integration of macro and on-chain narratives has evolved them from speculative tools into market layers with both information aggregation and price signaling functions.
Historically, crypto-native prediction markets have shown significant foresight in multiple macro and political events. During the 2024 US presidential election, Polymarket's total trading volume exceeded $500 million, with the "Who will win the presidential election" contract alone reaching $250 million and a single-day trading peak of over $20 million, setting a record for on-chain prediction markets. In macro events such as "Will the Fed cut rates at the September 2024 meeting," contract price changes clearly led CME FedWatch interest rate futures adjustments, showing that prediction markets have become leading indicators at certain times.
Nevertheless, the overall size of on-chain prediction markets is still much smaller than traditional counterparts. Since 2025, global crypto prediction markets (represented by Polymarket, Kalshi, etc.) have accumulated about $24.1 billion in trading volume, while traditional compliant platforms such as Betfair and Flutter Entertainment have annual trading volumes in the hundreds of billions of dollars. The on-chain market is less than 5% the size of the traditional market, but in terms of user growth, theme coverage, and trading activity, it has shown higher growth than traditional financial products.
In Q3, Polymarket became a phenomenal growth case. Contrary to mid-year rumors of a "$1 billion valuation financing," the latest news in early October showed: NYSE parent company ICE plans to invest up to $2 billion for about a 20% stake, corresponding to a Polymarket valuation of about $8–9 billion. This means its data and business model have been recognized at the Wall Street level. As of the end of October, Polymarket's annual cumulative trading volume was about $13.2 billion, with monthly trading volume in September reaching $1.4–1.5 billion, significantly higher than Q2, and October's monthly trading volume hit a record high of $3 billion. Trading themes focused on "Will the Fed cut rates at the September FOMC meeting," "Will the SEC approve an ethereum ETF by year-end," "Key state win probabilities in the US presidential election," and "Circle (CIR) stock performance after listing," among other macro and regulatory events. Some researchers have noted that price fluctuations in these contracts often lead US Treasury yields and FedWatch probability curves by about 12–24 hours, making them forward-looking indicators of market sentiment.
Meanwhile, Kalshi achieved an institutional breakthrough on the compliance path. As a CFTC-registered prediction market exchange, Kalshi completed a $185 million Series C round in June 2025 (led by Paradigm), with a valuation of about $2 billion; the latest disclosure in October put its valuation at $5 billion, with annualized trading volume growth exceeding 200%. The platform launched crypto asset-related contracts in Q3, such as "Will bitcoin close above $80,000 at the end of this month" and "Will an ethereum ETF be approved by year-end," marking the formal entry of traditional institutions into the speculative and hedging market for "crypto-narrative events." According to Investopedia, its crypto-related contracts exceeded $500 million in trading volume within two months of launch, providing institutional investors with a new channel to express macro expectations within a compliant framework. Thus, prediction markets have formed a "dual-track structure of on-chain freedom + compliance rigor."
Unlike early prediction platforms focused on entertainment and political themes, the mainstream market in Q3 2025 has shifted significantly toward macro policy, financial regulation, and coin-stock linkage events. Macro and regulatory contracts on Polymarket accounted for over $500 million in cumulative trading volume, more than 40% of the quarter's total. Investors maintained high participation in themes such as "Will the ETH spot ETF be approved before Q4" and "Will Circle's stock price break key levels after listing." The price trends of such contracts at times even lead traditional media sentiment and derivatives market expectations, gradually evolving into a "pricing mechanism for market consensus."
The core innovation of on-chain prediction markets lies in their use of tokenization to achieve liquidity pricing of events. Each prediction event is priced in binary or continuous token form (such as YES/NO Token), and uses automated market makers (AMMs) to maintain liquidity, enabling efficient price discovery without matching. Settlement relies on decentralized oracles (such as UMA, Chainlink) for on-chain execution, ensuring transparency and auditability. This structure allows almost all social and financial events—from election results to interest rate decisions—to be quantified and traded as on-chain assets, forming a new paradigm of "information financialization."
However, rapid development also brings risks. First, oracle risk remains the core technical bottleneck for on-chain prediction markets; any external data delay or manipulation could trigger contract settlement disputes. Second, unclear compliance boundaries still restrict market expansion, as US and EU regulatory approaches to event derivatives are not fully unified. Third, some platforms still lack KYC/AML processes, potentially causing compliance risks regarding funding sources. Finally, liquidity is overly concentrated on leading platforms (Polymarket's market share exceeds 90%), which could lead to price deviations and amplified market volatility in extreme conditions.
Overall, Q3's performance shows that prediction markets are no longer a marginal "crypto play," but are becoming an important carrier of macro narratives. They are both an immediate reflection of market sentiment and an intermediary tool for information aggregation and risk pricing. Looking ahead to Q4, prediction markets are expected to continue evolving along the "on-chain × compliance" dual-cycle structure: the on-chain segment (Polymarket) will rely on DeFi liquidity and macro narrative trading for external expansion; the compliance path (Kalshi) will accelerate institutional capital attraction through regulatory recognition and USD-denominated mechanisms. As data-driven financial narratives become more widespread, prediction markets are moving from the attention economy to decision-making infrastructure, becoming a rare new asset layer in the financial system that both reflects collective sentiment and provides forward-looking pricing functions.
Disclaimer: The content of this article solely reflects the author's opinion and does not represent the platform in any capacity. This article is not intended to serve as a reference for making investment decisions.
You may also like
Crypto Has Until 2028 to Avoid a Quantum Collapse, Warns Vitalik Buterin

Crypto ETF See Mixed Flows Amid BTC Recovery

WLFI Faces Security Breach Leading to $22M Token Burn and Wallet Freezes

Samourai Wallet Co-Founder Sentenced to Four Years, Highlighting Legal Risks for Crypto Privacy Tools