Data Insight: Bitcoin's Year-to-Date Gains Turn Negative—Is a Full Bear Market Really Here?

The market has entered a comprehensive defensive phase.
The market has entered a comprehensive defensive phase.
Written by: Chris Beamish, CryptoVizArt, Antoine Colpaert, Glassnode
Translated by: Luffy, Foresight News
TL;TR
- Bitcoin has fallen below the short-term holder (STH) cost basis range, putting significant pressure on recent buyers; the $95,000 - $97,000 range has now become a key resistance level. A recovery of this range would be an initial signal of market structure repair.
- Spot demand remains weak, with intensified outflows from US spot ETFs and no new buying from traditional financial allocators.
- Speculative leverage continues to unwind, open interest in futures is declining, and funding rates have dropped to cycle lows.
- The options market has significantly repriced risk, with implied volatility rising across all maturities. Traders are paying high premiums to hedge downside risk.
- Put options dominate capital flows, with strong demand at key strike prices (such as $90,000), reinforcing a defensive positioning. Traders are more inclined to actively hedge risk rather than increase upside exposure.
- The Digital Asset Volatility Index (DVOL) has rebounded to monthly highs, reflecting a comprehensive repricing of risk in volatility, skew, and capital flows, suggesting short-term volatility may remain elevated.
Bitcoin has broken below its previous consolidation range, briefly touching $89,000, setting a new local low and turning its year-to-date gains negative. This deep correction continues the mild bear trend we noted last week and raises questions about when structural support will re-emerge. This article will assess the market's reaction to this breakdown using on-chain pricing models and short-term holder realized loss data; it will then analyze the options market, ETF flows, and futures positioning to explore how speculators are adjusting sentiment as the market weakens again.
On-Chain Insights
Breaking Below the Lower Range
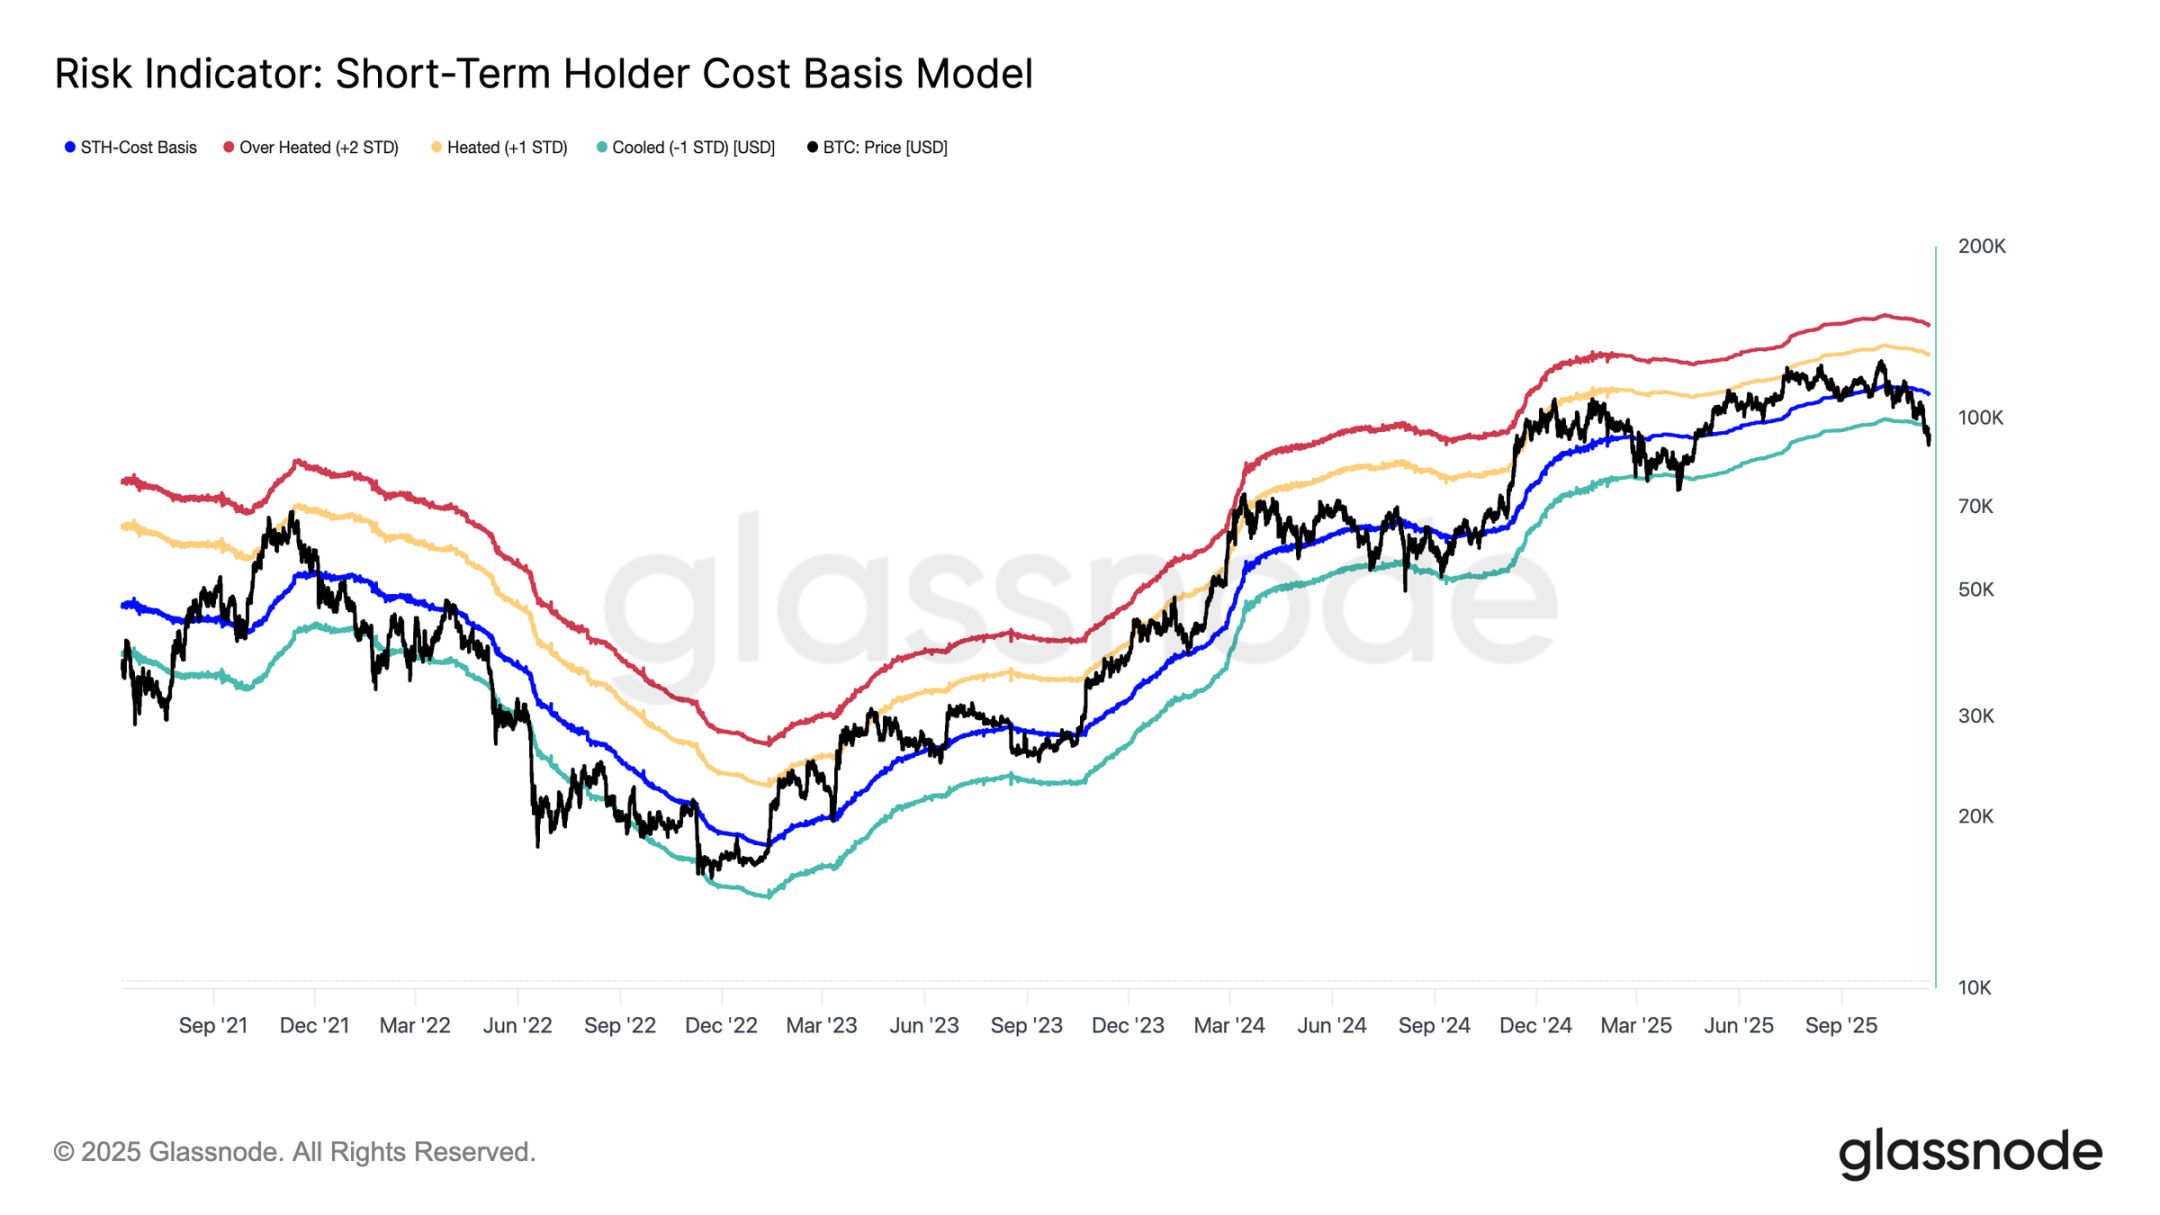
Bitcoin has fallen below the lower bound of last week's "hovering range" at $97,000, signaling the risk of a deeper correction. The price then plunged to $89,000, setting a new local low below the short-term holder cost basis (currently around $109,500), corresponding to minus one standard deviation (about $95,400).
This breakdown indicates that almost all recent investor cohorts are now in a loss position. Historically, this pattern has triggered panic selling and weakened market momentum, requiring time to repair. In the short term, the $95,000 - $97,000 range will serve as a local resistance level, and reclaiming this range would be an initial signal of market structure repair.
Panic Selling Peaks
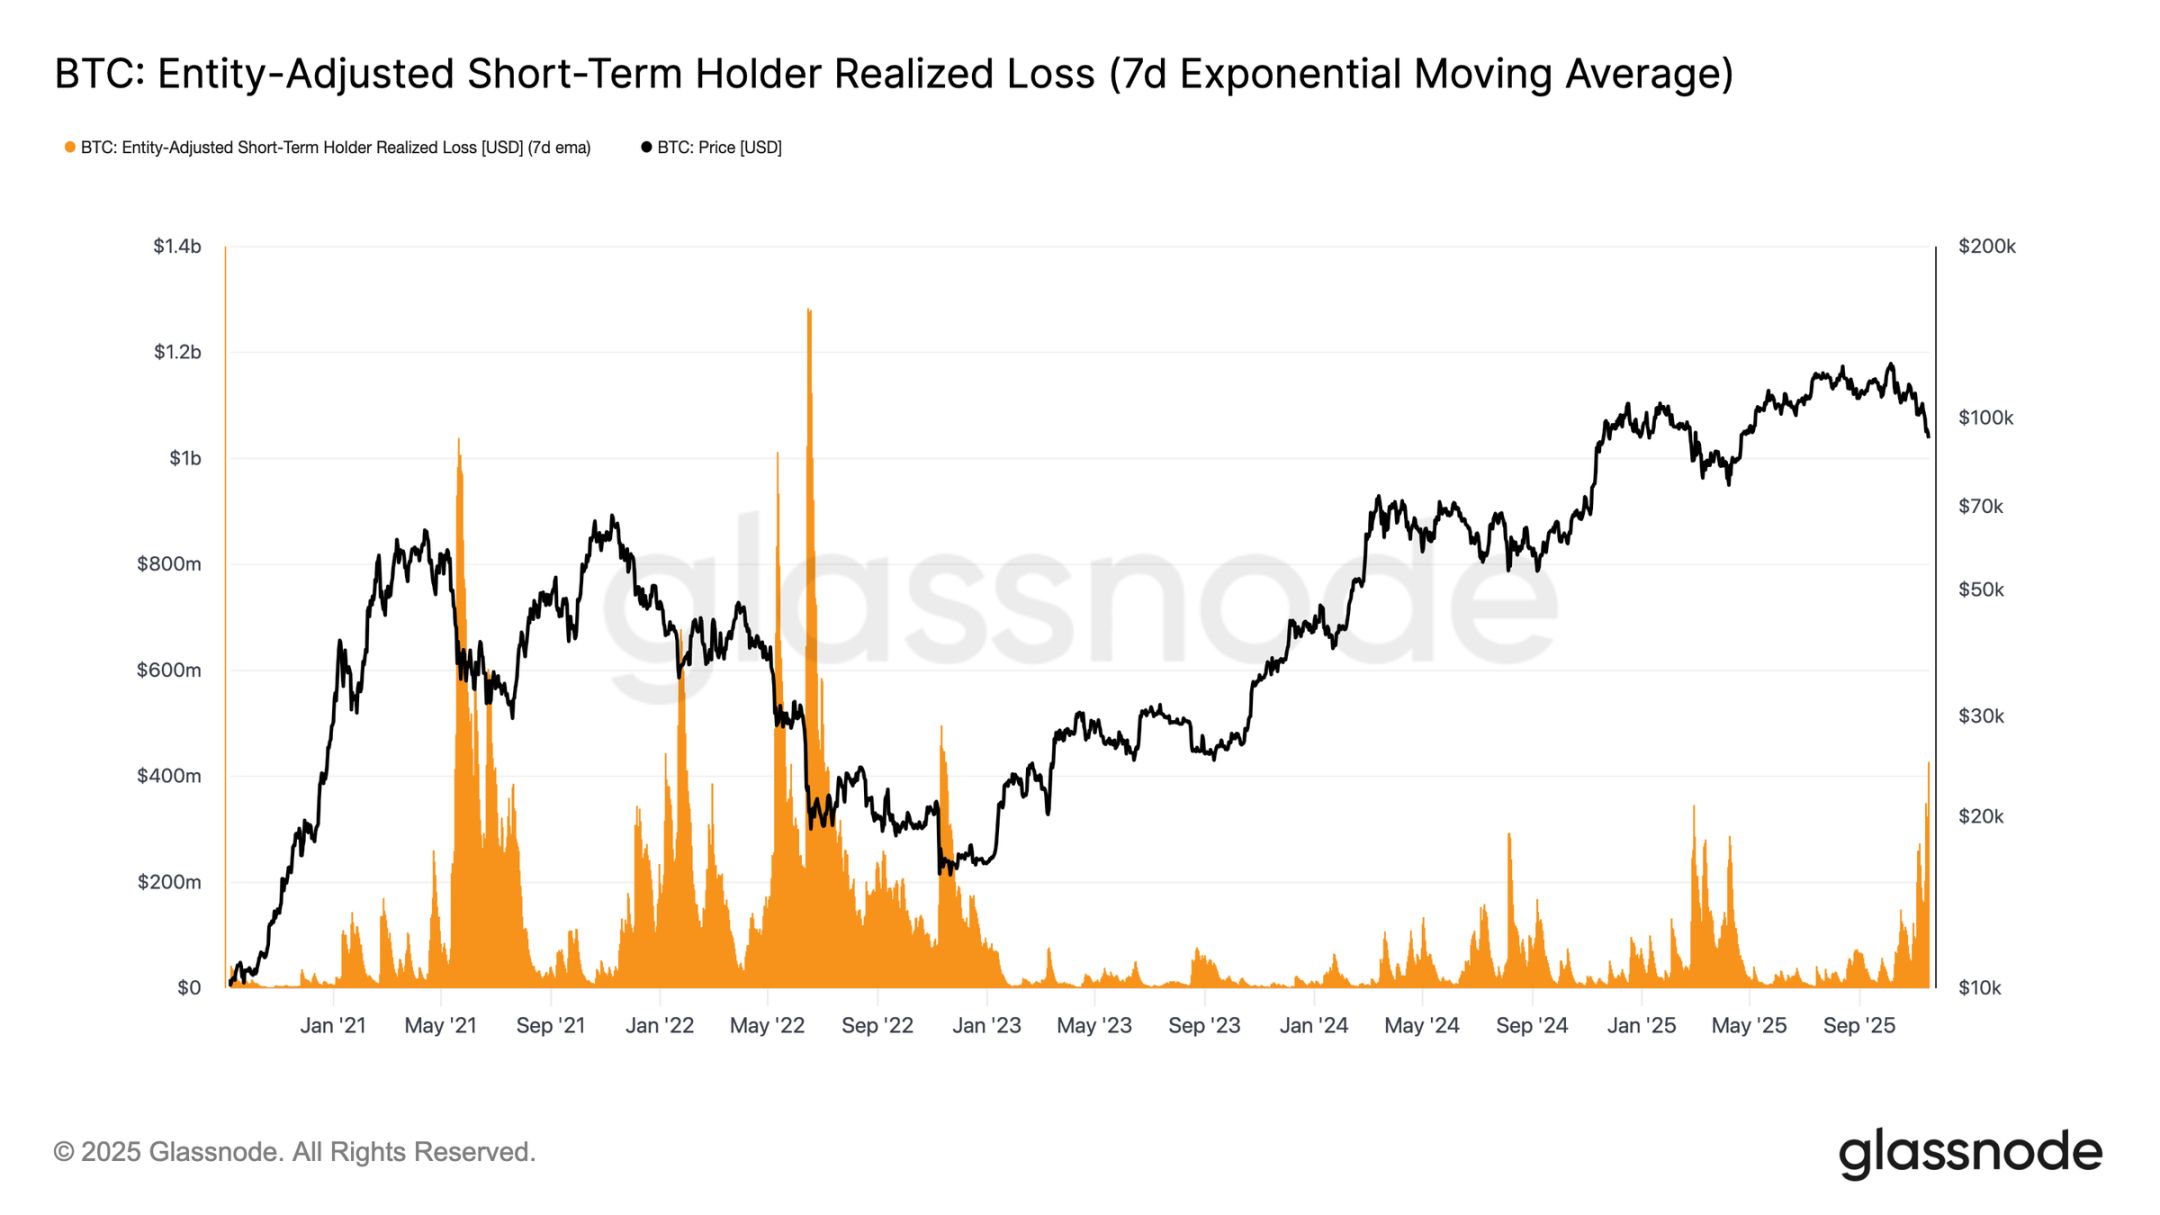
From an investor behavior perspective, this plunge marks the third time since early 2024 that the price has fallen below the lower bound of the short-term holder cost basis. However, the panic among core buyers is much higher this time: the 7-day average of realized losses by short-term holders has soared to $523 million per day, the highest level since the FTX collapse.
Such a high scale of realized losses highlights the heavy top structure formed in the $106,000 - $118,000 range, where the chip density far exceeds previous cycle peaks. This means that either stronger buying is needed to absorb the selling pressure, or the market will require a longer and deeper accumulation phase to restore equilibrium.
Testing Active Demand
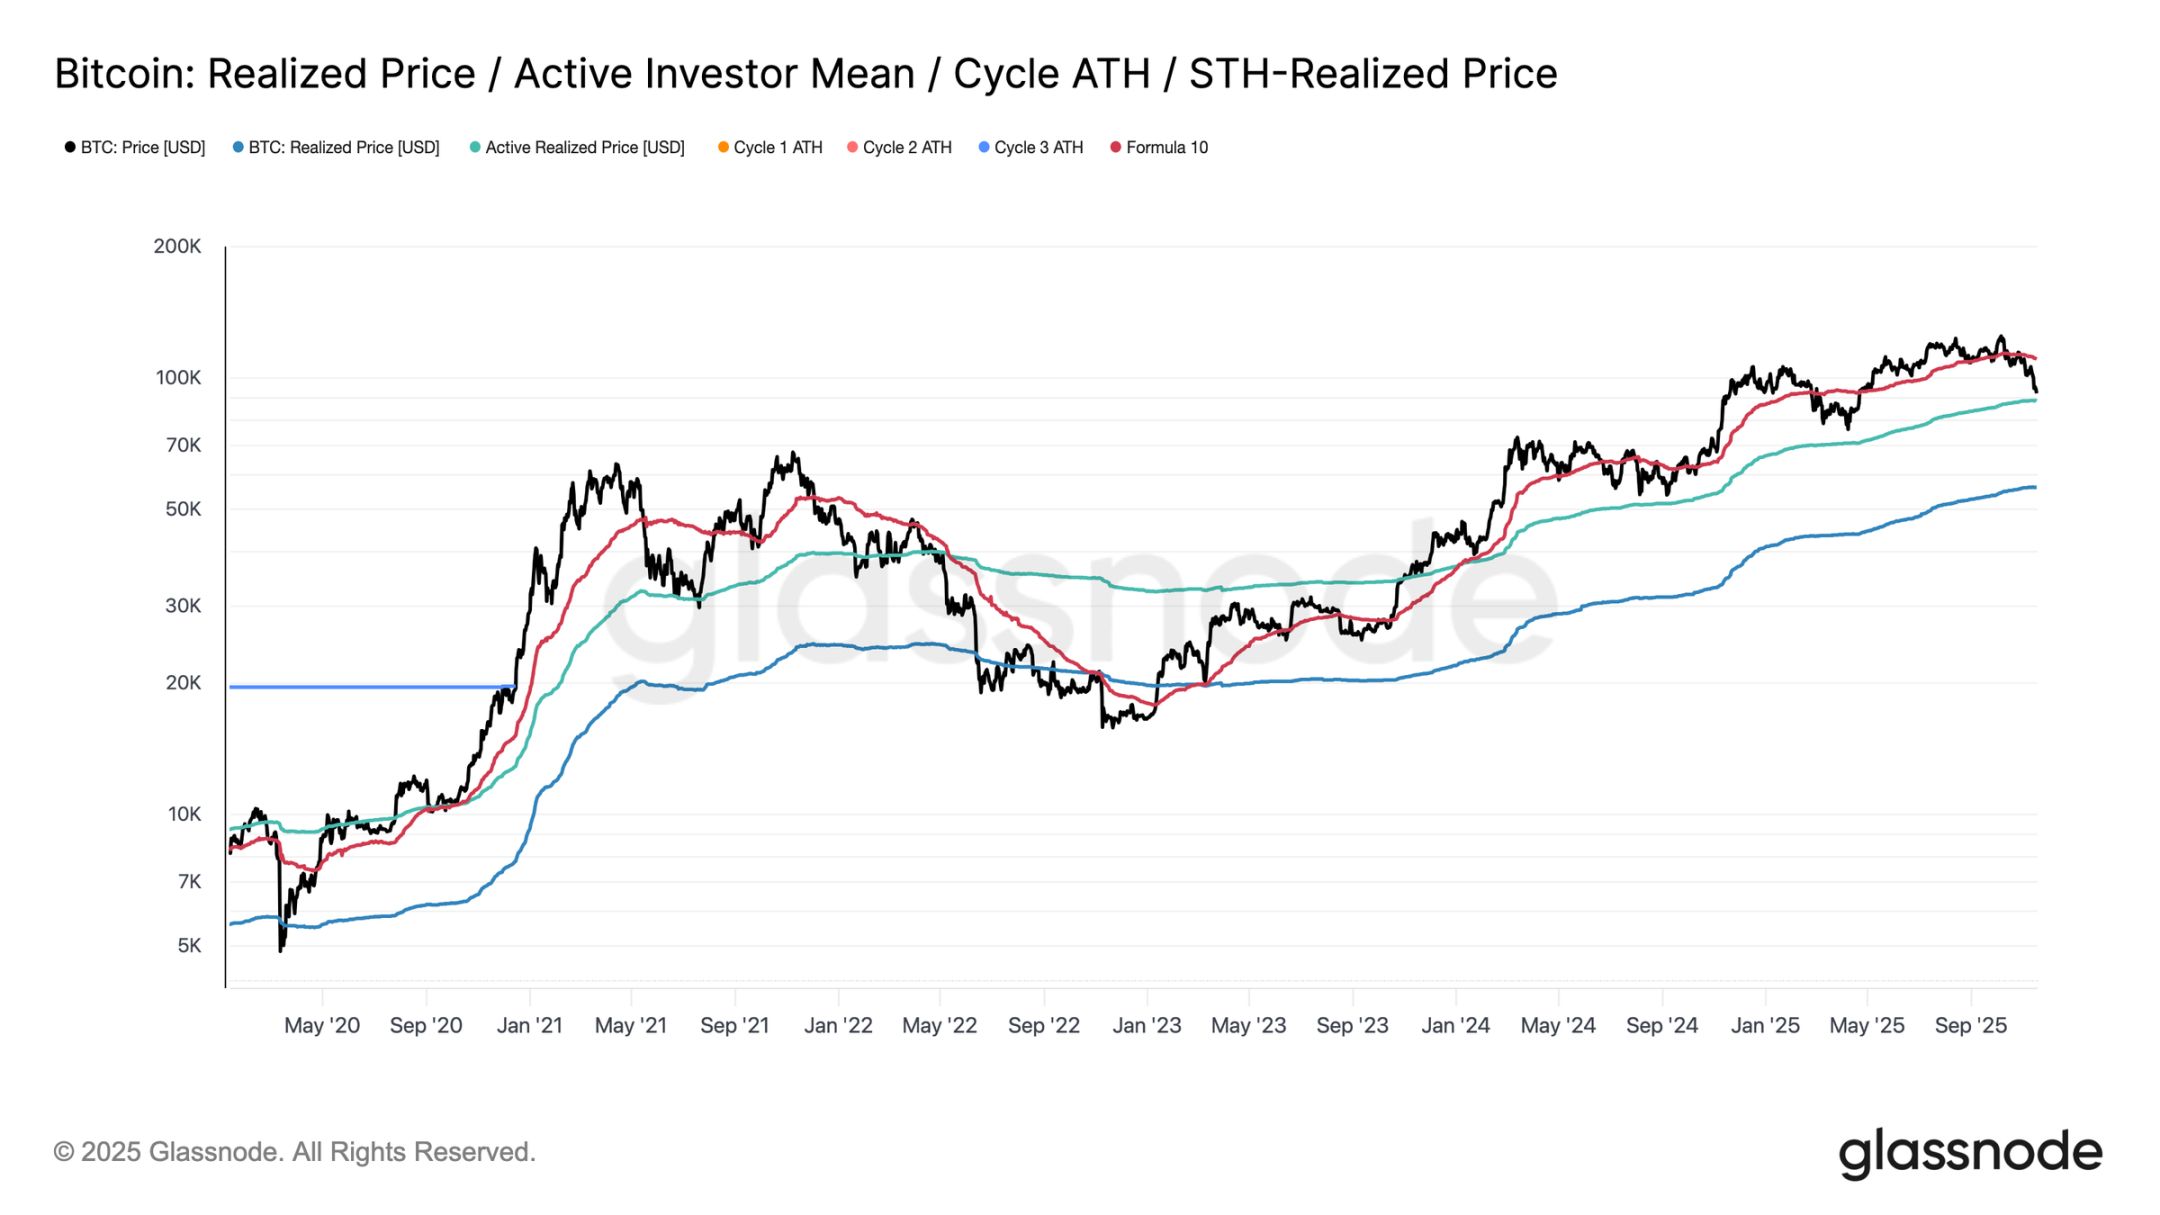
From a valuation model perspective, the market is currently entering uncharted territory, with speculative interest rising significantly during this mild bear phase. The first major defensive range is near the realized price of active investors (currently about $88,600). Bitcoin trading near this level corresponds to the cost basis of non-dormant holders who have been actively trading in recent months, making it a potential mid-term trading range.
However, if this price level is decisively broken, it would be the first time in this cycle that the price falls below the active investor cost basis, a clear signal that bear market momentum is dominating.
Different Types of Corrections
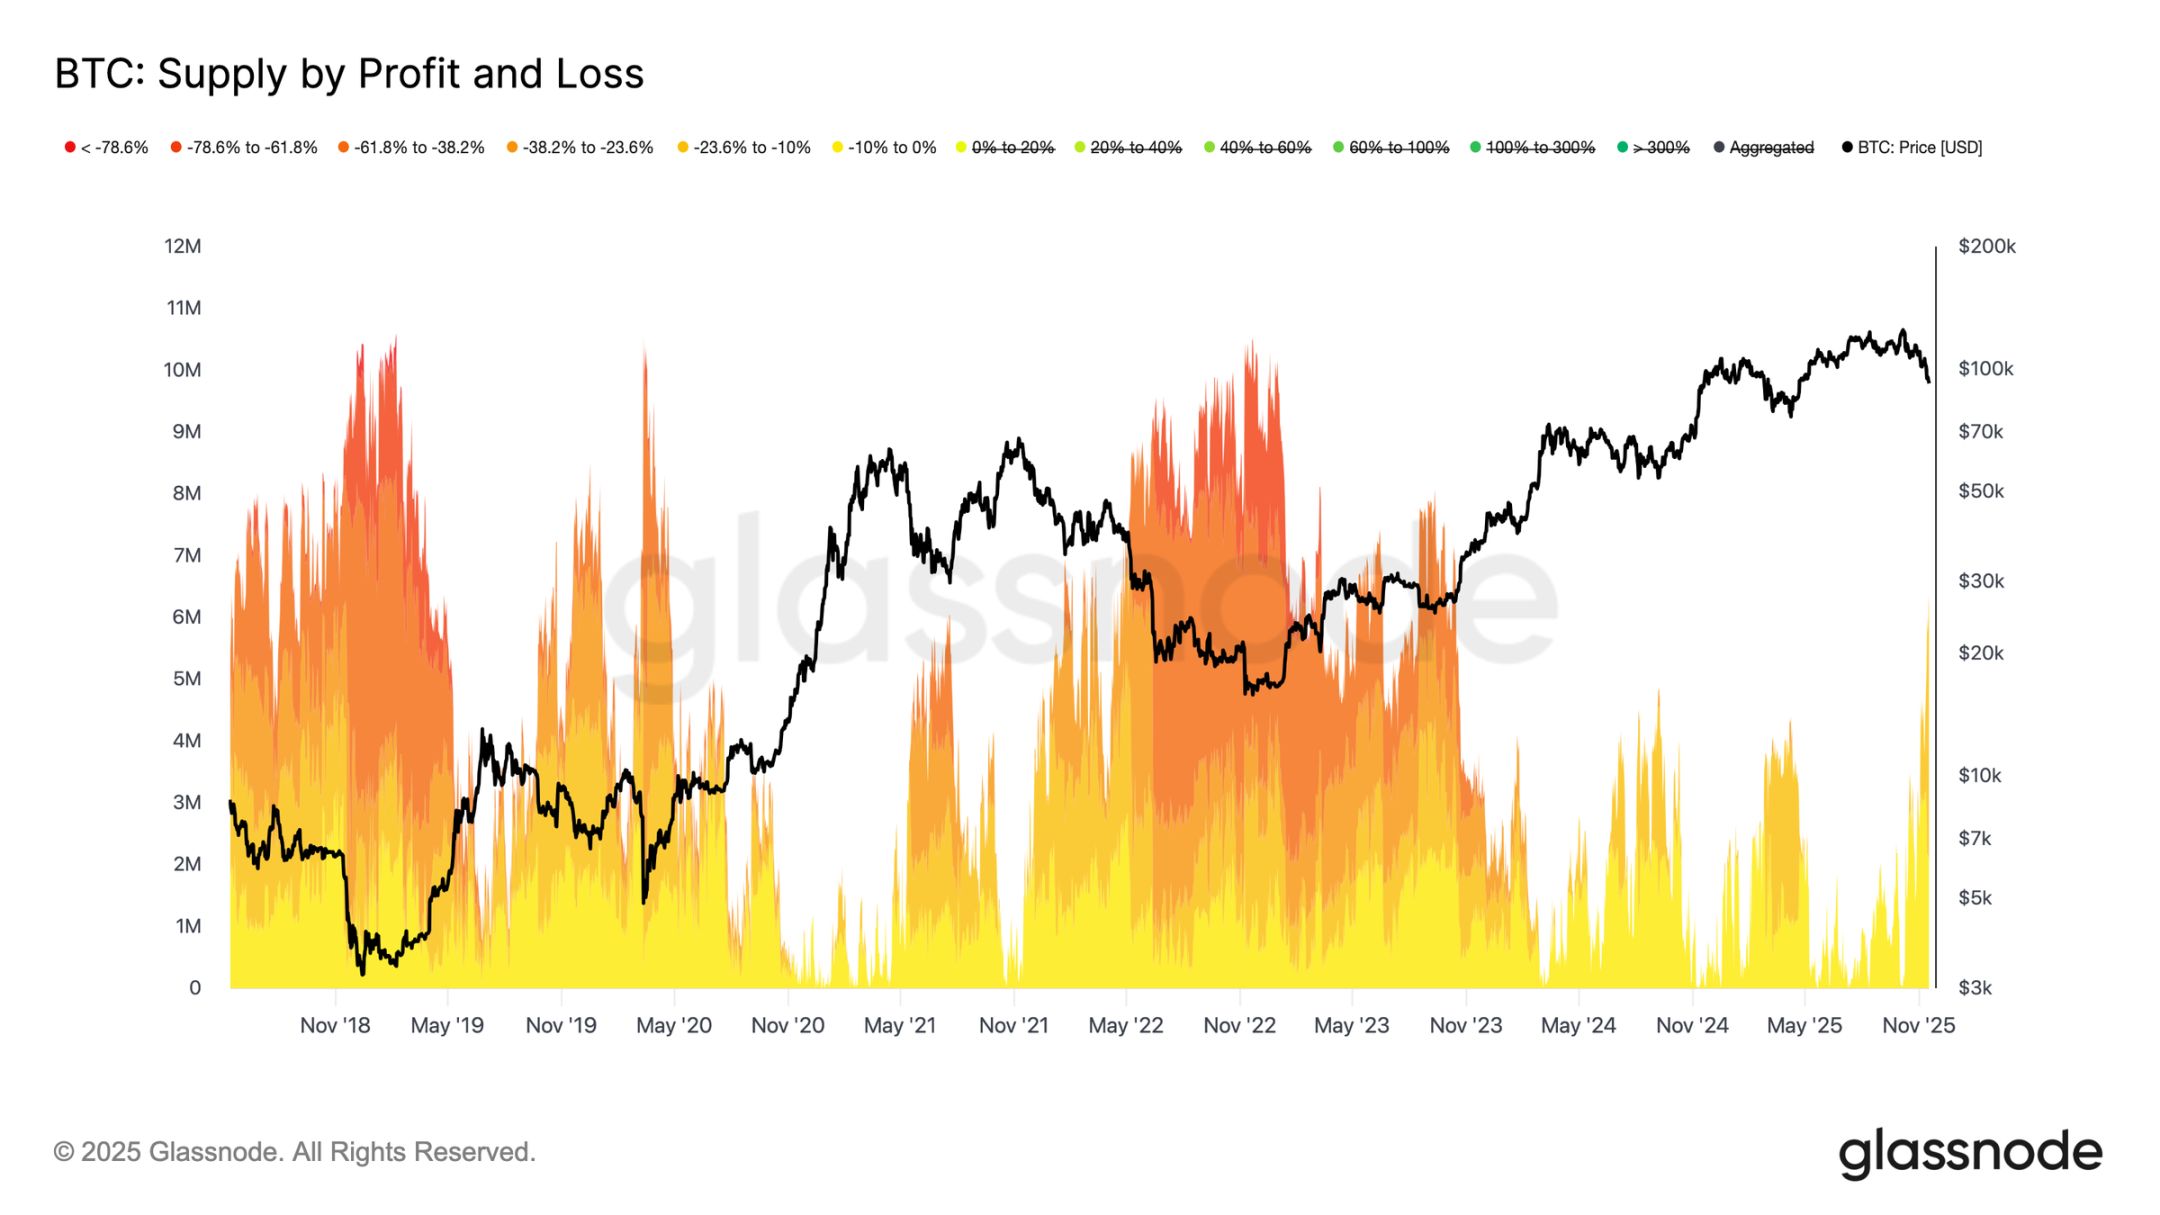
Although the main lower bound of the short-term holder cost basis has been breached, the scale and intensity of investor losses are still far from the extreme levels of the 2022-2023 bear market. The chart below tracks all bitcoins currently in a loss position, grouped by unrealized drawdown: about 6.3 million bitcoins are currently at an unrealized loss, with most losses in the 10%-23.6% range.
This distribution is highly similar to the short-term range-bound market of Q1 2022, rather than a deep capitulation phase. This is why the range between the realized price of active investors ($88,600) and the true market mean ($82,000) may become the key dividing line between a mild bear phase and the full bear market structure of 2022-2023.
Off-Chain Insights
Insufficient ETF Demand
US spot ETF inflows continue to reflect a clear lack of demand, with the 7-day average remaining negative in recent weeks. Persistent outflows indicate that traditional financial allocators are unwilling to increase exposure during the current correction, in sharp contrast to the strong inflows that previously supported the market rally. The current weakness means that discretionary allocation appetite has cooled significantly, and one of the market's largest marginal buyer groups has not shown new buying, further reinforcing the overall environment of limited demand.
The lack of sustained inflows indicates that a key demand pillar has not been activated, resulting in a current market lacking a core source of demand.

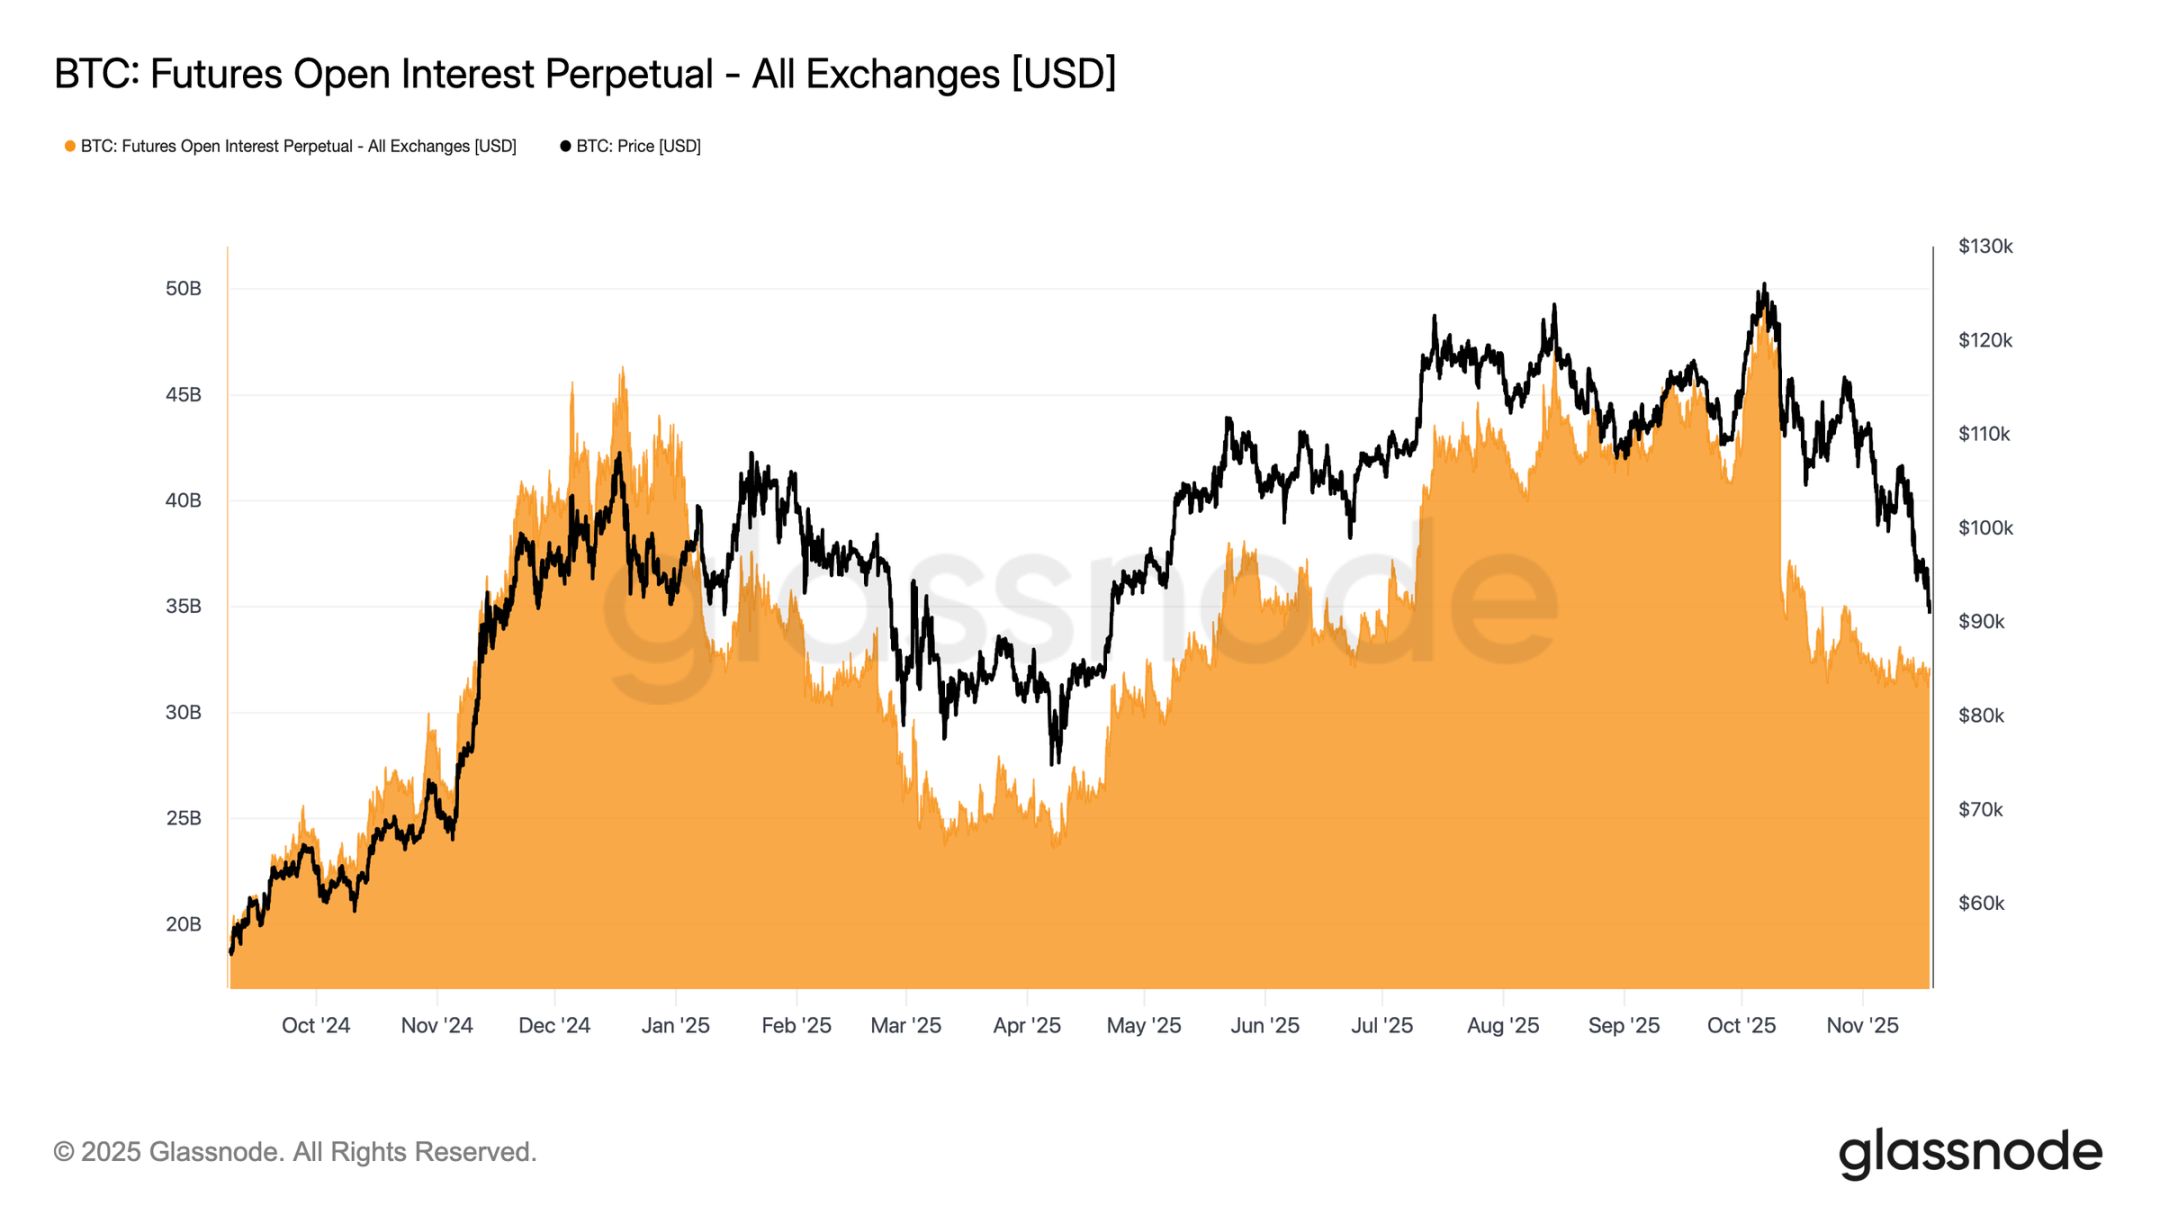
No Signs of Risk Appetite Recovery
During this cycle, open interest in futures has continued to decline, falling in tandem with price and reflecting a sustained contraction in speculative activity. Traders have not increased exposure as the market weakens, but have systematically reduced risk, resulting in a much lower scale of derivatives market positions compared to previous correction phases. The lack of new leverage highlights the cautious stance of market participants and aligns with the overall trend of weakening demand across risk-taking groups.
The continued contraction in futures positions indicates that the market is still unwilling to deploy capital, confirming the lack of confidence behind the current price action.
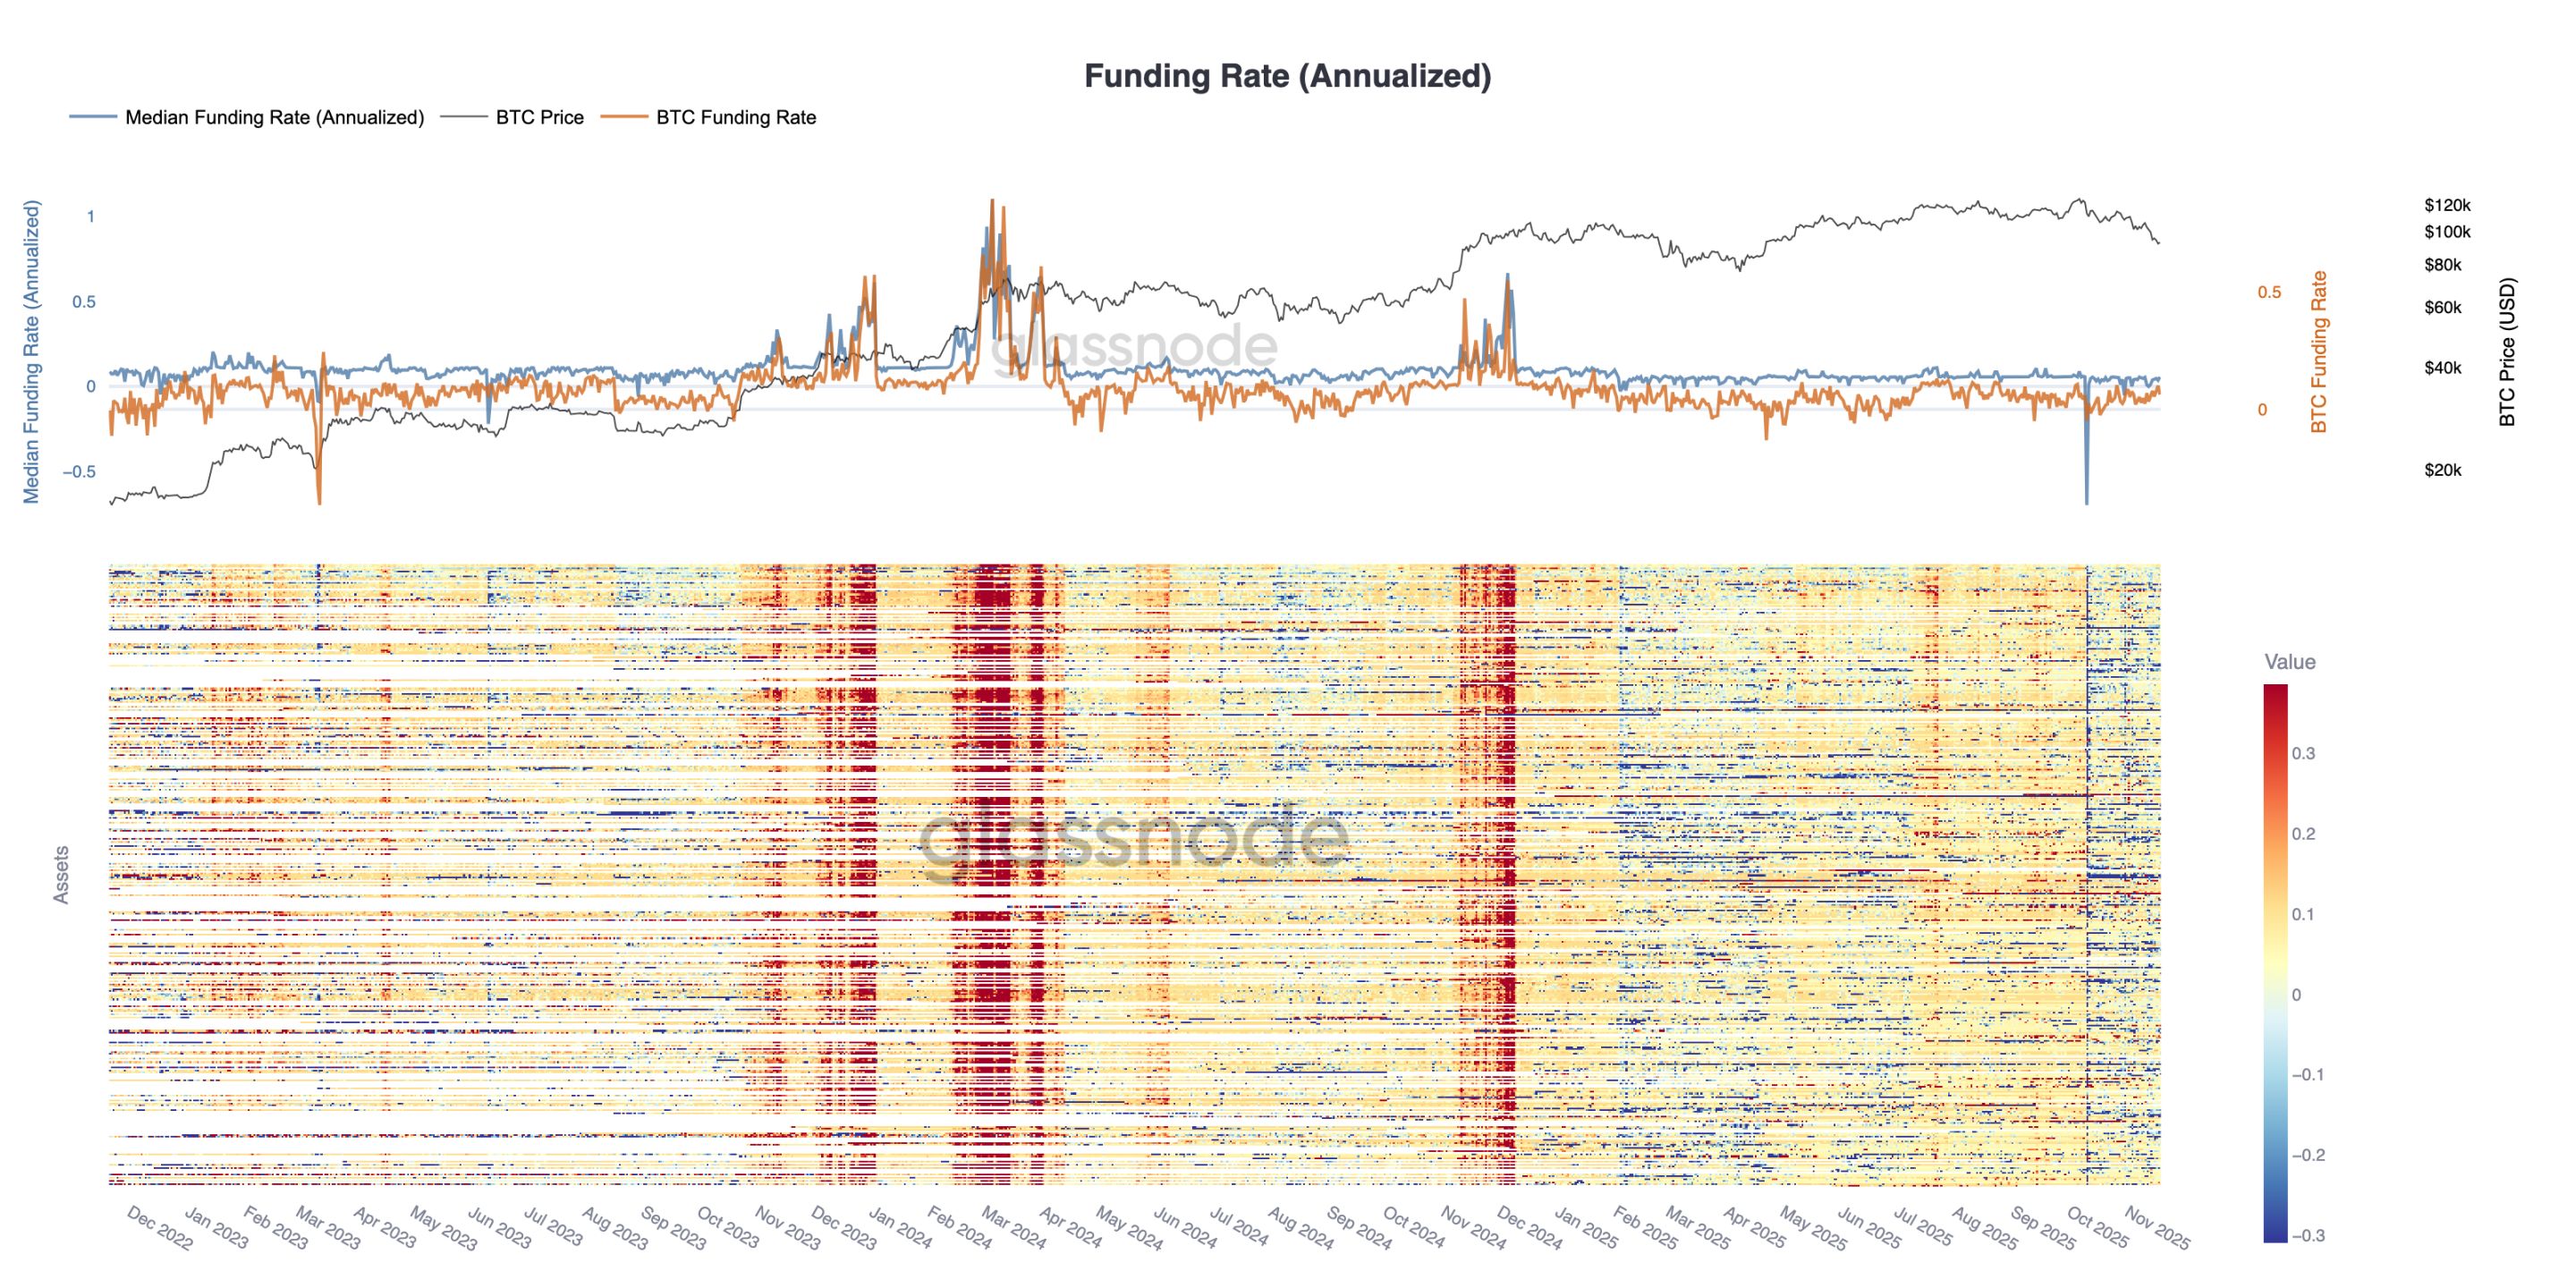
Funding Rates Hit Cycle Lows
As open interest in futures continues to decline, the derivatives market is sending a clear signal of speculative position contraction. Traders are choosing to reduce risk rather than increase exposure as the market weakens, resulting in leverage levels in open interest being significantly lower than in previous correction phases.
This dynamic is also reflected in the funding rate market: funding rates for the top 500 assets have clearly shifted to a neutral-to-negative range. Compared to the positive premium state at the beginning of the year, this change highlights a comprehensive cooling of leveraged long demand and a shift toward more defensive positioning.
The decline in open interest and negative funding rates together indicate that speculative leverage is being systematically withdrawn from the market, reinforcing risk-off sentiment.
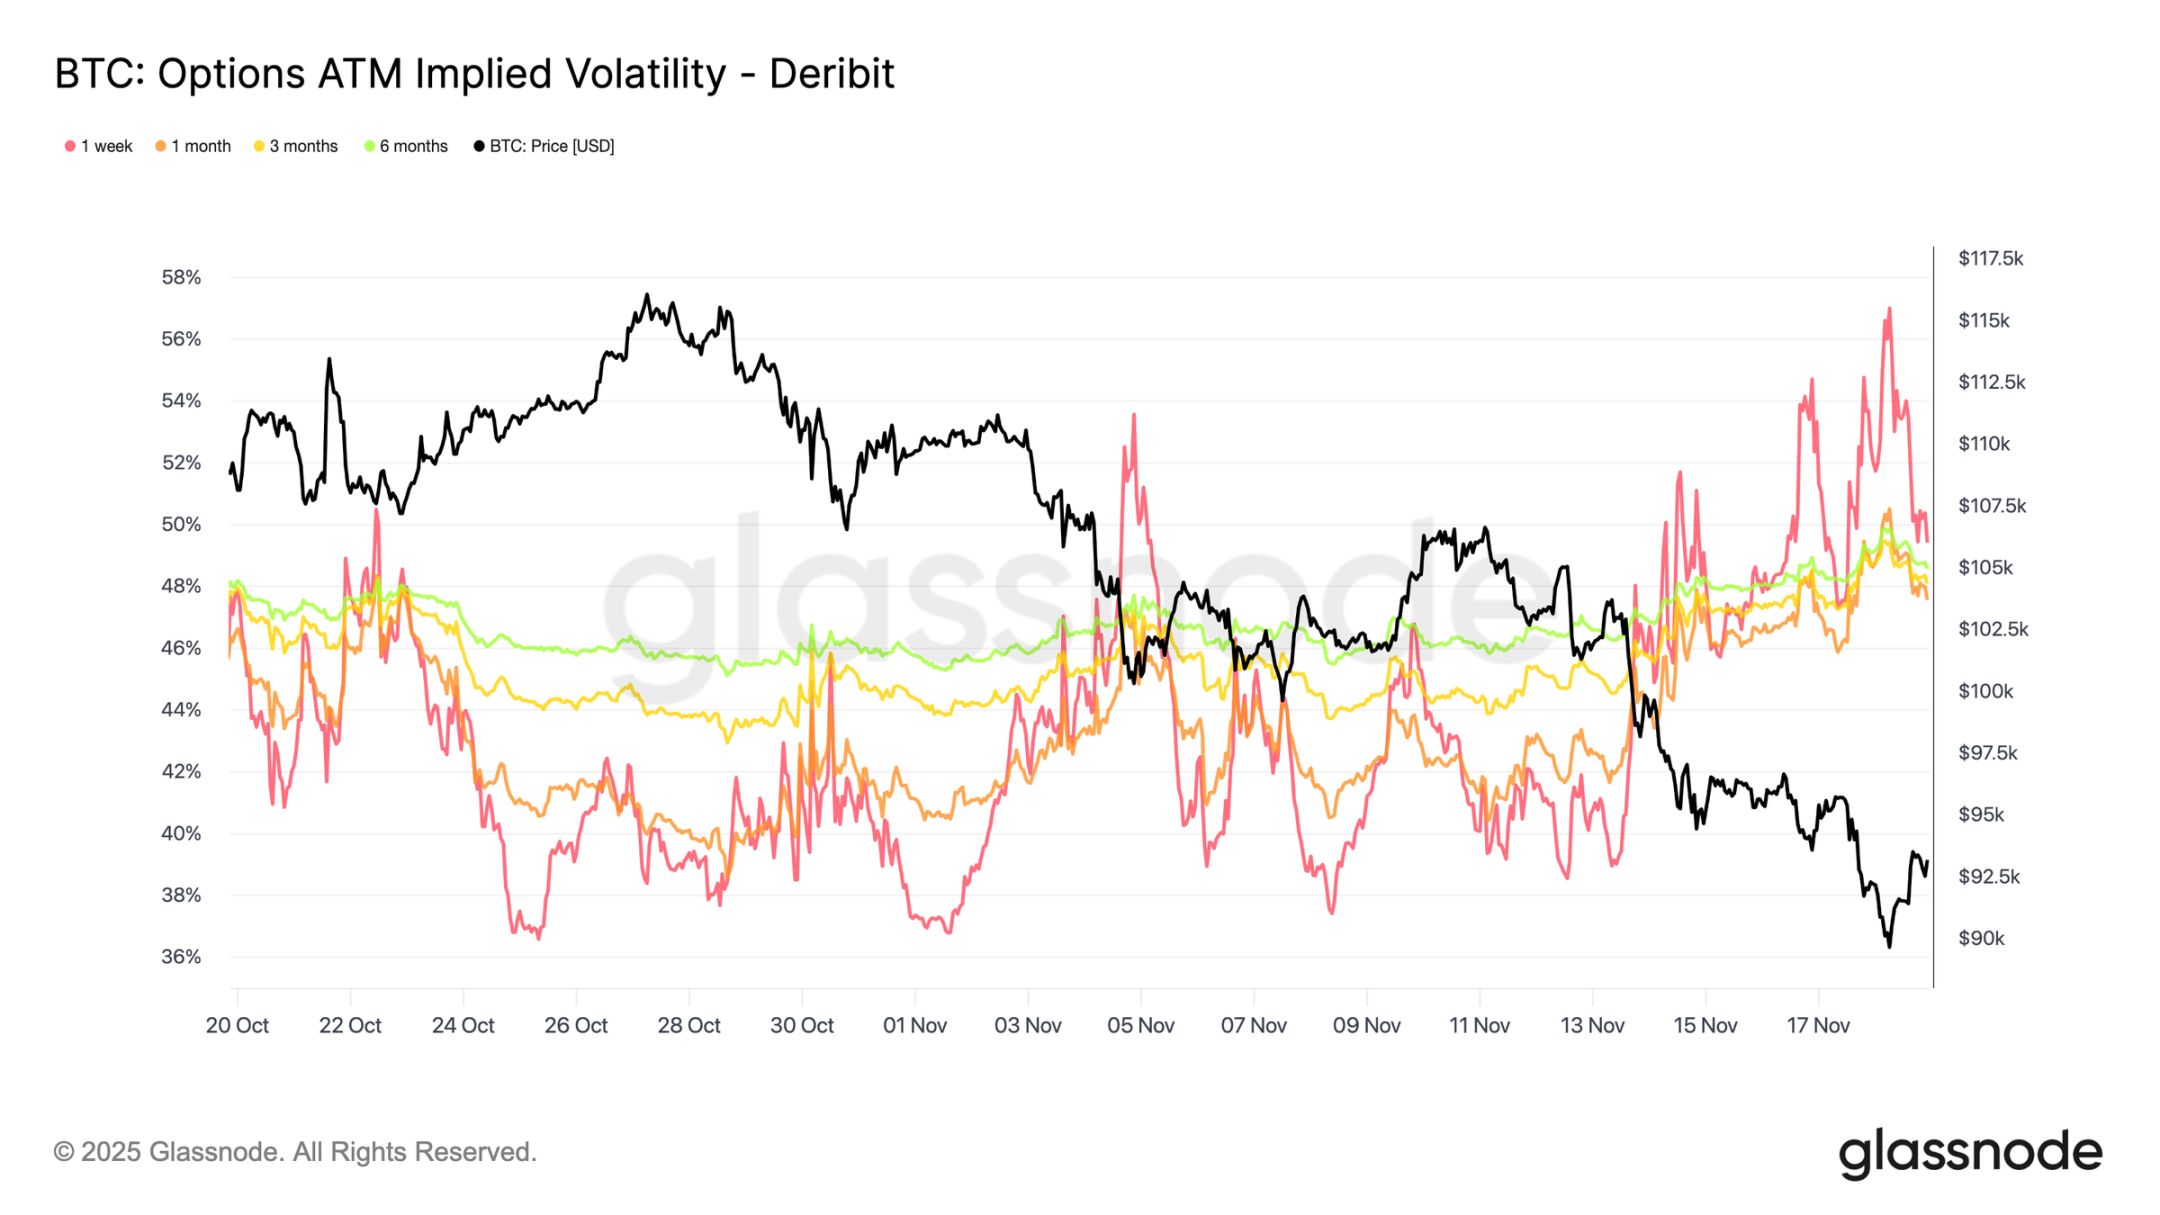
Implied Volatility Rises Sharply
The options market is usually the first to reprice risk. After bitcoin briefly fell below $90,000, the options market responded quickly: implied volatility across all maturities rose sharply, with short-term contracts reacting most dramatically. The chart shows a clear rebound in short-term volatility, with the entire volatility curve being repriced.
This rise is driven by two main factors: first, traders' increased demand for downside protection in response to the possibility of a larger correction; second, gamma short traders reacting. Many traders were forced to buy back short options and roll positions upward, mechanically pushing up short-term implied volatility.
Current implied volatility is close to the levels seen during the October 10 liquidation event, showing how quickly traders are reassessing short-term risk.
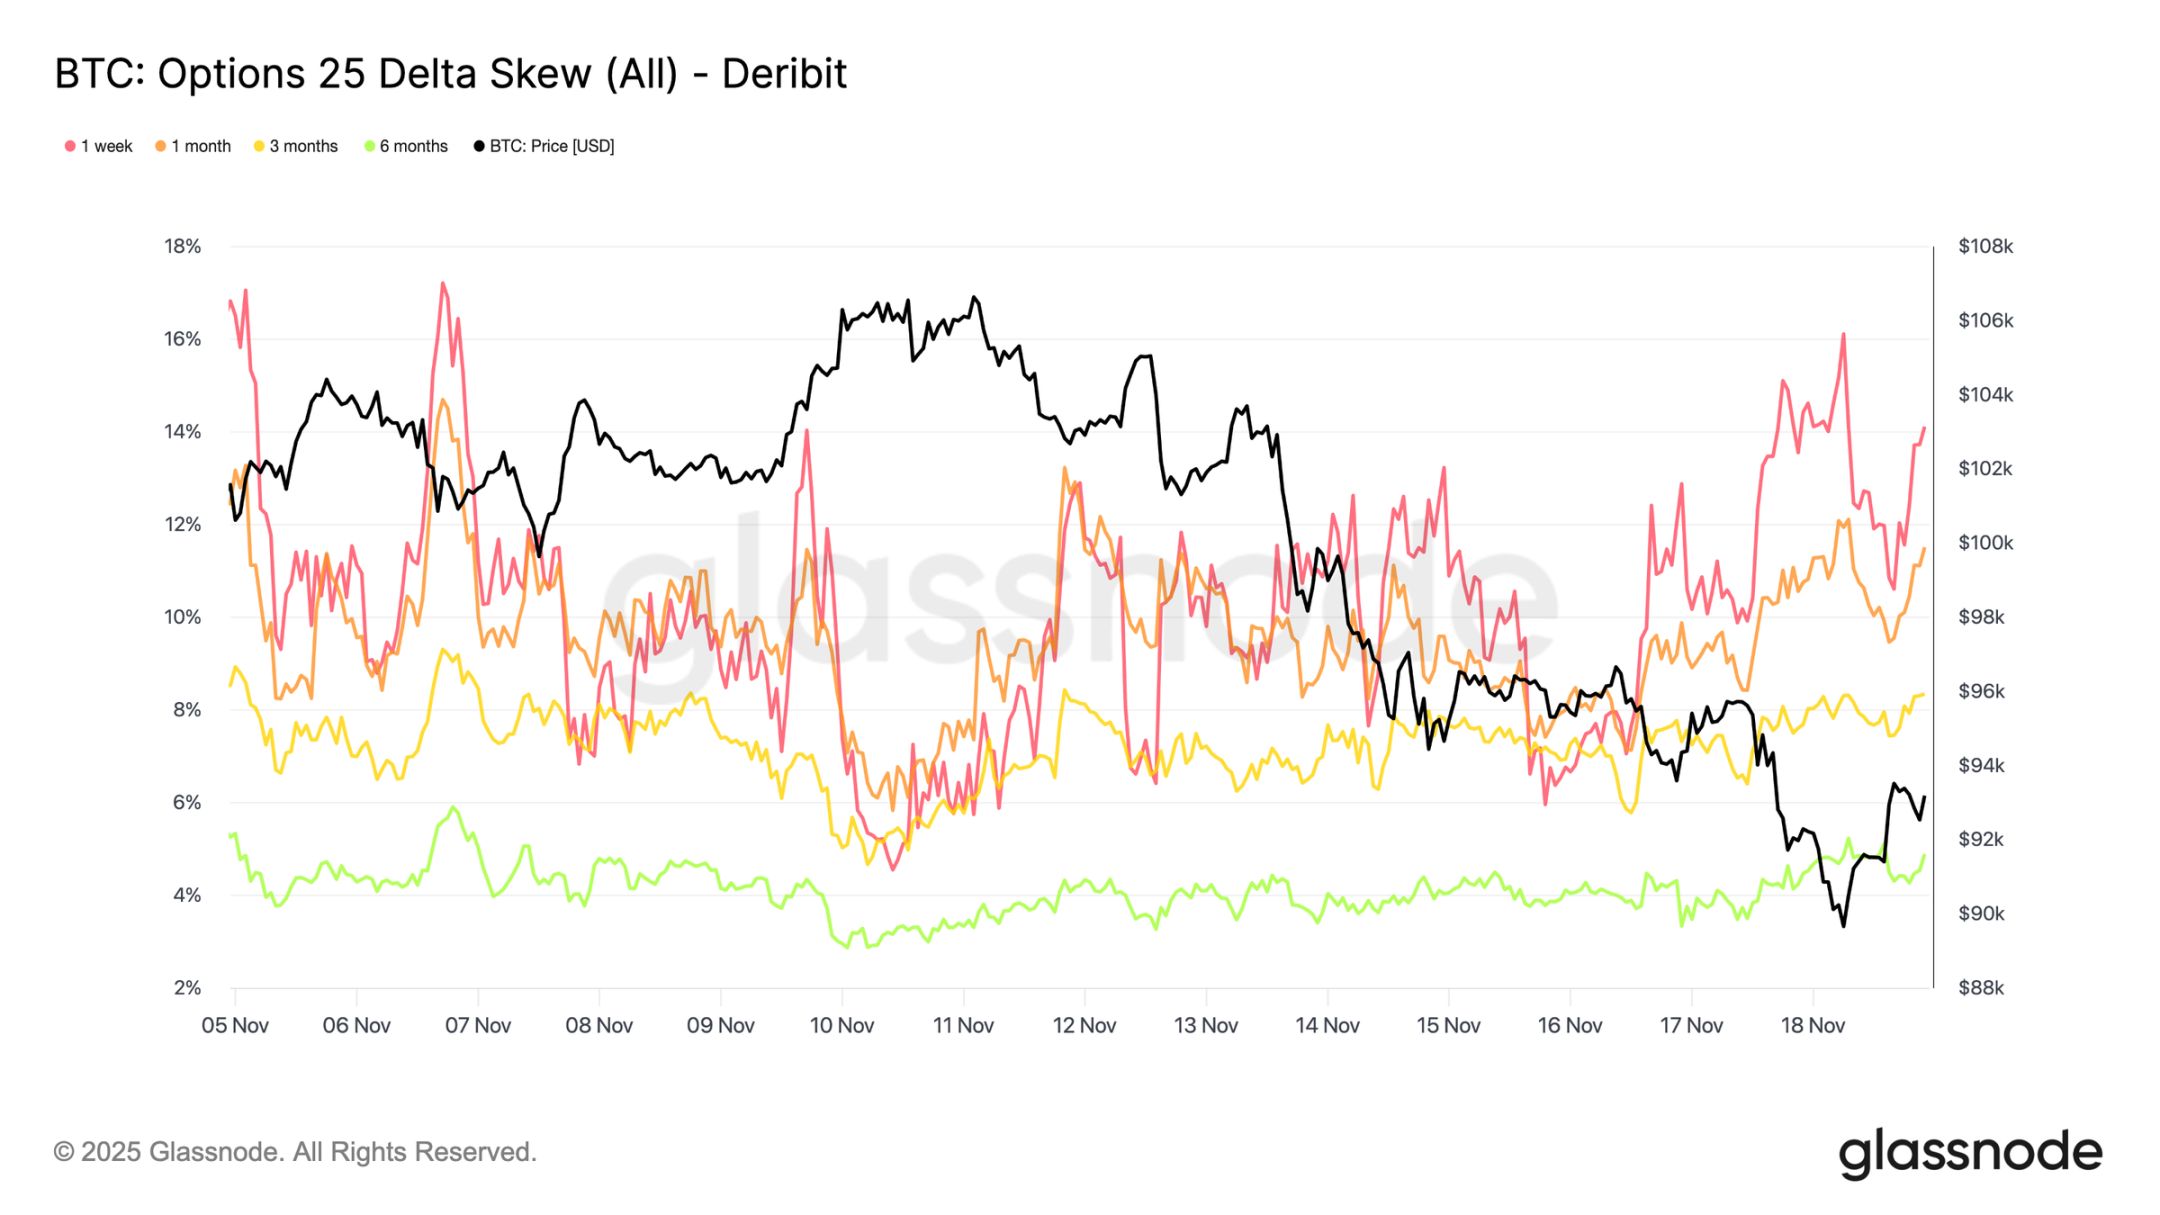
Skew Confirms Panic Sentiment
Turning from implied volatility to skew indicators, the options market is sending the same signal: 25 delta skew across all maturities remains negative, with one-week skew approaching extreme bearish levels (Note: Skew measures the difference in implied volatility between options at different strike prices, quantifying market sentiment and risk appetite. 25 Delta Skew is an options market metric that measures the degree of volatility skew, usually calculated by comparing the implied volatility of 25 Delta puts and 25 Delta calls). The premium for one-week puts is about 14%, indicating that traders are willing to pay a higher cost for downside protection regardless of spot price.
This behavior may become a self-fulfilling prophecy: when traders buy these puts, market makers often end up delta short. To hedge this exposure, market makers sell futures or perpetual contracts, and this selling pressure can weigh on the market and potentially amplify the downside move traders were trying to hedge against.
Longer-term skew is also bearish, but to a lesser extent: six-month skew is just below 5%, indicating that market concerns are mainly concentrated in the short term rather than across the entire maturity spectrum.
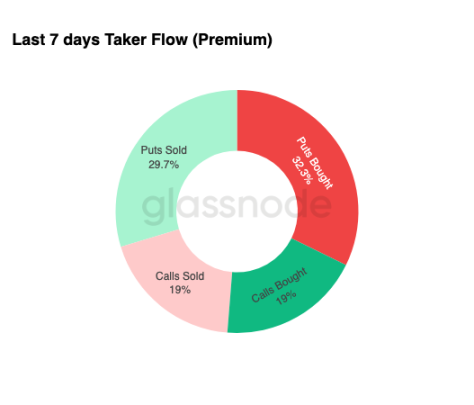
Strong Demand for Downside Protection
Turning from skew to actual trading activity, capital flows over the past seven days highlight the same pattern. Traders have bought a large amount of put option premium, far exceeding demand for calls. This is consistent with hedging behavior and reflects a market more inclined to guard against further downside than to bet on upside.
Trading activity in call options is limited, indicating that traders are unwilling to take on substantial risk exposure before year-end. Both the scale of buying and selling calls is low compared to put flows, supporting the view that "cautious rather than speculative positions" dominate.
Overall, this combination of capital flows suggests that the market is preparing for increased volatility and prefers defense over expanding exposure.
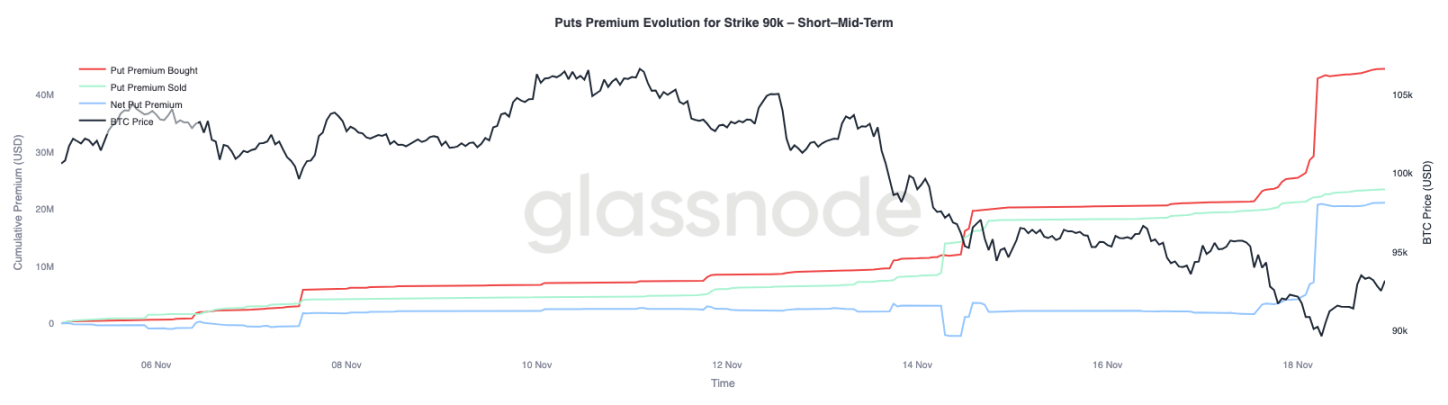
$90,000 Strike Option Premiums
Focusing further on overall capital flow data, the put option premium at the $90,000 strike shows that as prices weaken, demand for protection is accelerating. Over the past two weeks, net put premium at this strike was relatively balanced until bitcoin broke below $93,000. Once this support was lost, traders began to actively bid up these puts, driving a sharp rise in the $90,000 strike premium.
This behavior indicates that as spot selling pressure intensifies, traders are willing to pay increasingly higher prices for downside protection. This trend is also consistent with the previously observed rise in short-term implied volatility.
The significant repricing of $90,000 puts highlights the acceleration of downside hedging activity when key price levels are breached.
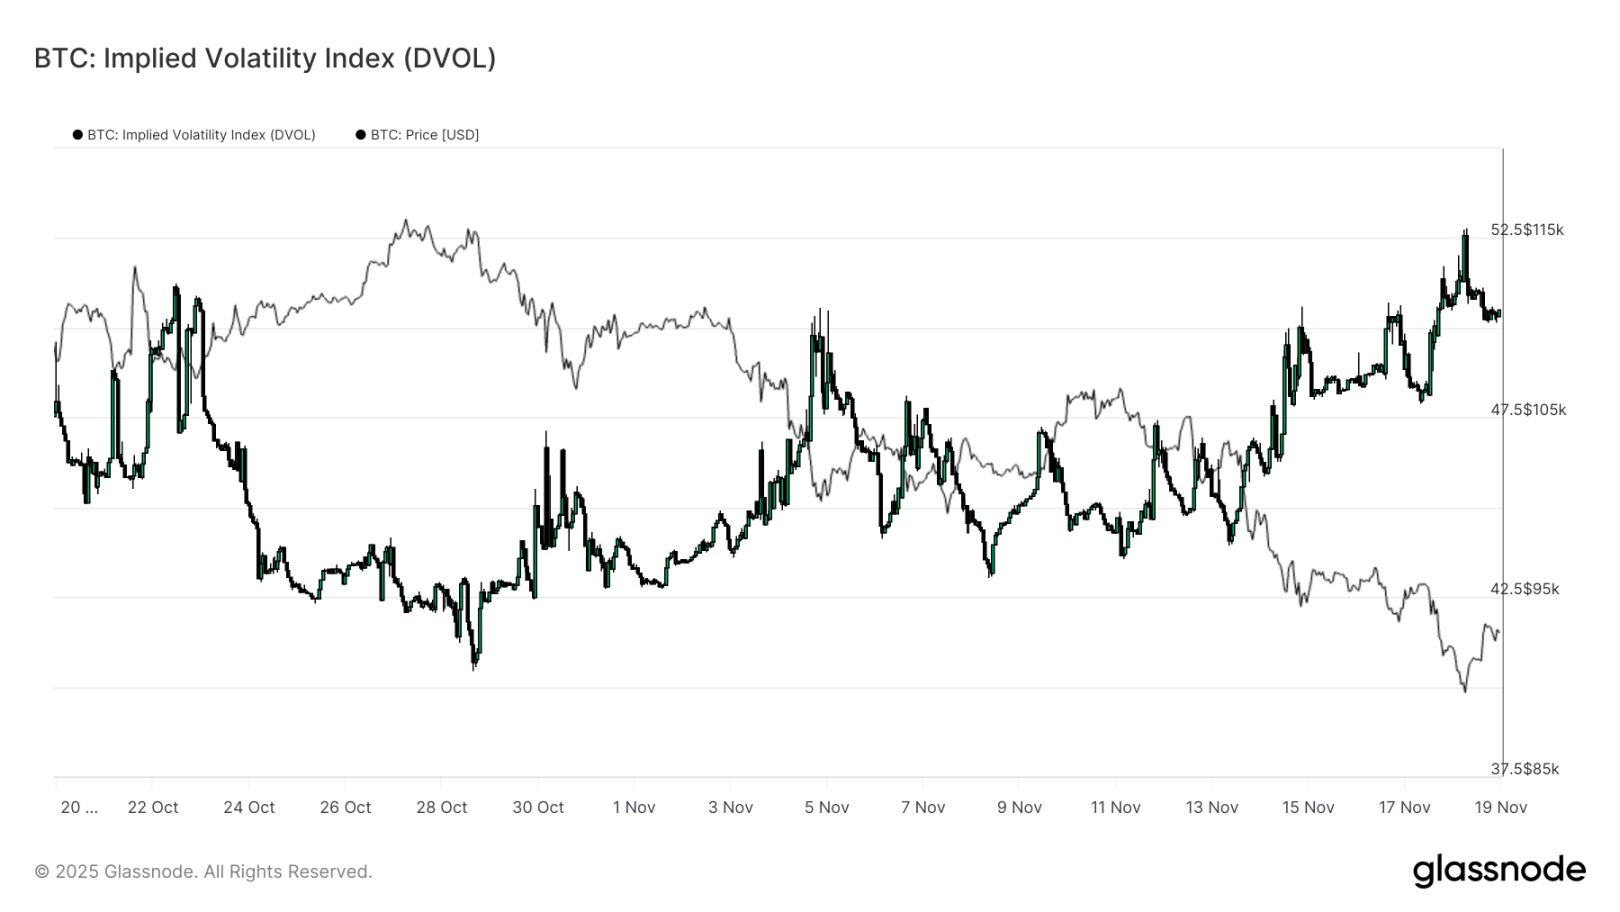
Pricing Market Fragility
Turning from individual strike prices to broader volatility indicators, the DVOL index shows the extent of the market's risk repricing: the index has rebounded from about 40 three weeks ago to a monthly high near 50. DVOL reflects the implied volatility of a basket of fixed-term options, so its rise means traders expect greater future price swings.
This upward trend integrates all observations from the options market: rising implied volatility across maturities, persistent negative skew, recent capital flows showing negative delta, and traders showing little willingness to increase risk exposure before year-end. These factors together paint a market preparing for unstable price action, with core drivers including perpetual contract liquidation risk, macro uncertainty, and the lack of strong spot demand from ETF inflows.
The next event that could change this volatility pattern is the Federal Reserve's FOMC meeting in three weeks. Until then, the options market will continue to send cautious signals and clearly favor defensive positioning.
The rise in DVOL further indicates that the market is preparing for greater future volatility, with traders adjusting positions around volatility.
Conclusion
Bitcoin is still experiencing a challenging market phase, characterized by weakened market structure, fading speculative demand, and a comprehensive shift toward risk-averse positioning in the derivatives market. Spot demand remains absent, ETF inflows are negative, and the futures market shows an unwillingness to add leverage during the downturn. Meanwhile, implied volatility, skew, and hedging capital flows all point to rising short-term downside risk, with investors paying ever-higher premiums for protection. Together, these dynamics create a "search for stability" market environment. The future trend will depend on whether demand can re-emerge near key cost basis levels, or if current market fragility will evolve into a deeper correction or bear market.
Disclaimer: The content of this article solely reflects the author's opinion and does not represent the platform in any capacity. This article is not intended to serve as a reference for making investment decisions.
You may also like
Rebuilding Order Amid Crypto Chaos: Where Will the Next Wave of Liquidity Come From?
Jesse Pollak Launches Controversial JESSE Coin on Base App
In Brief Jesse Pollak's JESSE coin is set to launch through the Base App. Pollak warns against scams and ensures only official announcements are credible. The launch reignites debate on digital identity and security in decentralized protocols.

BlackRock prepares a new Ethereum ETF with integrated staking