Date: Thu, Oct 30, 2025 | 05:50 PM GMT
The cryptocurrency market is witnessing heightened volatility today, with both Bitcoin (BTC) and Ethereum (ETH) trading sharply lower — down roughly 4% and 6% respectively. The sell-off triggered a massive $1.25 billion in total liquidations , with $1.10 billion coming from long positions, reflecting widespread risk-off sentiment across the market.
Amid the correction, several major altcoins are facing steep declines, including Aster (ASTER), which has dropped over 16% in the past 24 hours. However, while the short-term picture remains bearish, Aster’s chart is beginning to mirror the bottoming structure previously seen in Hyperliquid (HYPE) — a pattern that led to a powerful reversal earlier this year.
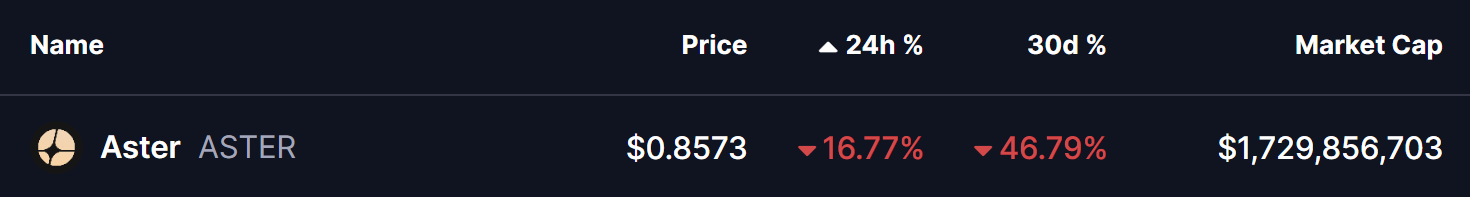 Source: Coinmarketcap
ASTER Mirrors HYPE’s Path
Aster (ASTER) appears to be tracing a price structure strikingly similar to HYPE’s April 2025 fractal, which preceded a multi-hundred-percent rally. Both charts display a curved descending formation characterized by consistent lower highs, waning momentum, and eventual sell-side exhaustion — often the setup for a rounded bottom before a breakout.
Just as HYPE corrected through a prolonged downtrend before surging over 400% in the weeks that followed, ASTER now seems to be entering a comparable stage.
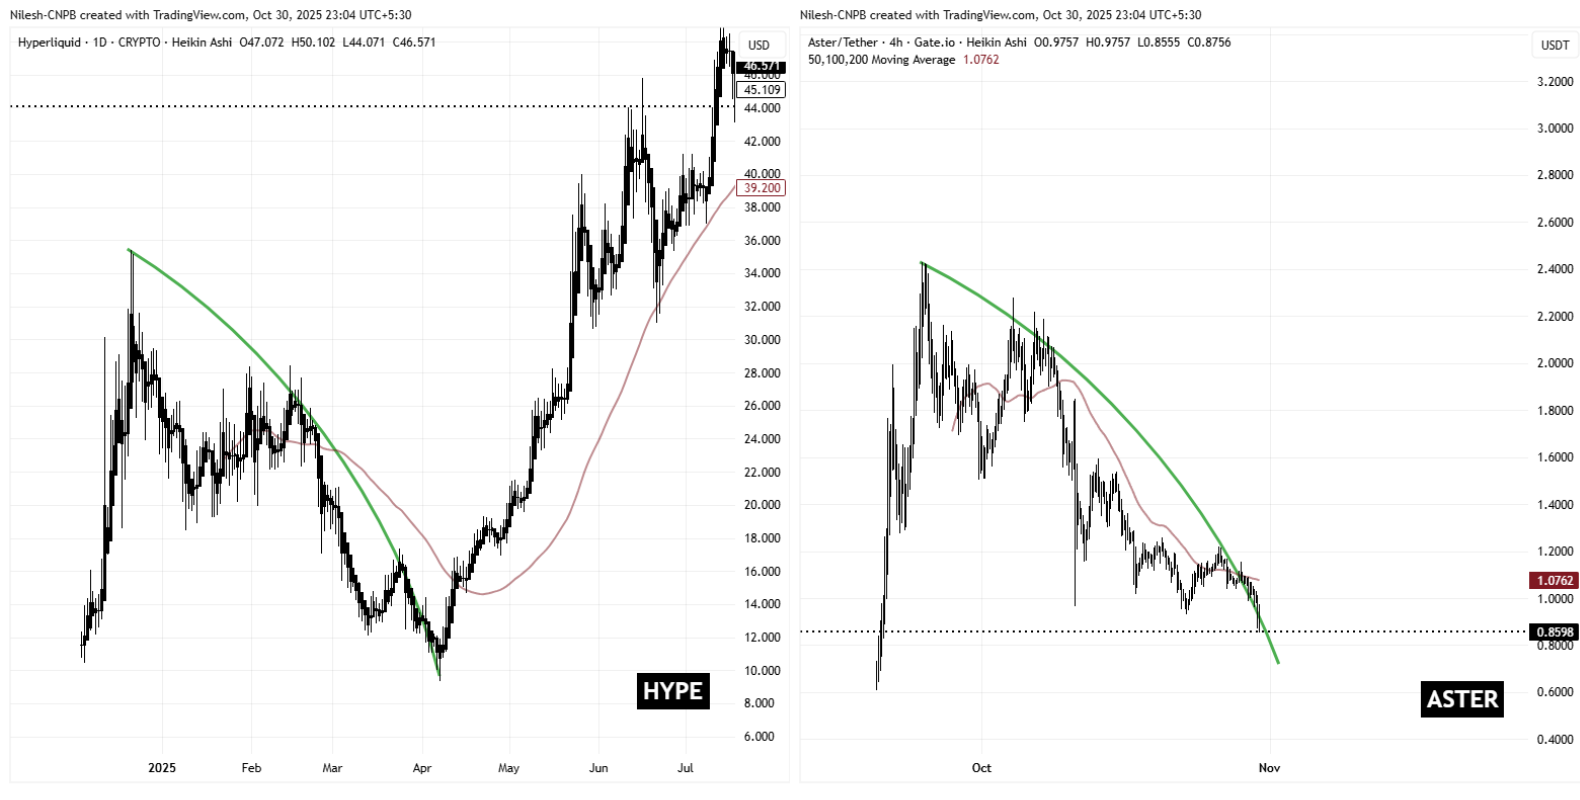 HYPE and ASTER Fractal Chart/Coinsprobe (Source: Tradingview)
The token is hovering near its lower support zone between $0.65 and $0.75, a region that aligns with both historical support and the fractal symmetry seen in HYPE’s prior structure. Notably, this also represents a 73% decline from ASTER’s all-time high of $2.42 — a similar magnitude to HYPE’s bottoming range.
What’s Next for Aster?
Despite the growing resemblance to HYPE’s pre-breakout phase, bears still maintain control of the current setup. Aster will need to reclaim its 100-hour moving average (MA) resistance near $1.07 to confirm a potential momentum shift in favor of the bulls.
A clean breakout and retest above this level could signal the start of a recovery phase, while failure to hold support near $0.65 may extend the current downtrend. Until a clear reversal pattern forms, traders should remain cautious and monitor whether buying strength reemerges from these lower levels.