Crypto analyst Ali (@ali_charts) highlighted that XRP could encounter resistance near $2.80, based on its 12-hour chart. The price moves within a descending parallel channel, and the $2.80 mark aligns with the channel’s upper boundary and a Fibonacci retracement zone.
![XRP Price Analysis: $2.80 Resistance Holds as Weekly Cup-and-Handle Signals Long-Term Setup image 0]()
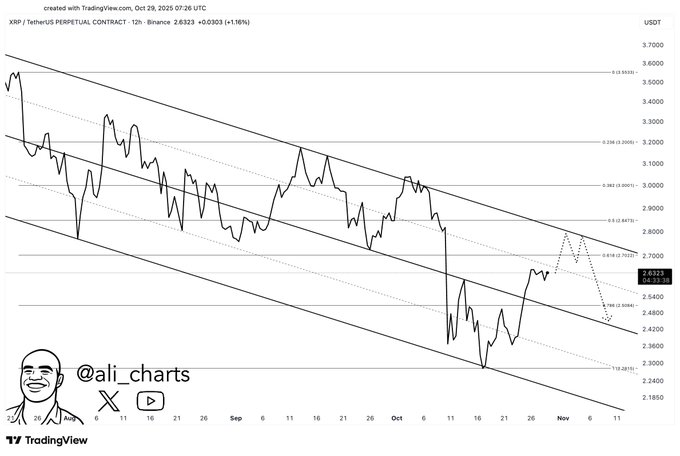
XRP 12H Descending Channel Analysis. Source: @ali_charts / TradingView
The setup shows XRP rebounding from the lower channel trendline after the recent decline. As price climbs toward mid-channel levels, momentum appears to recover, but the structure still leans bearish overall. The $2.80 area now acts as a technical ceiling that could challenge bulls attempting a breakout.
If XRP fails to clear that resistance, it may retrace toward the midline or lower boundary of the channel, continuing its broader downtrend. However, a clean break and sustained close above $2.80 would invalidate the bearish pattern and signal the start of a potential trend reversal.
XRP Forms Weekly Cup-and-Handle — Oct 29, 2025
Analyst Steph_iscrypto highlights a cup-and-handle on XRP’s weekly chart spanning 2020–2025. Price built a rounded base (the cup), then pulled back into a smaller consolidation (the handle) beneath a rising neckline. This structure signals a long accumulation phase followed by a shallow pause before potential continuation.
![XRP Price Analysis: $2.80 Resistance Holds as Weekly Cup-and-Handle Signals Long-Term Setup image 2]()
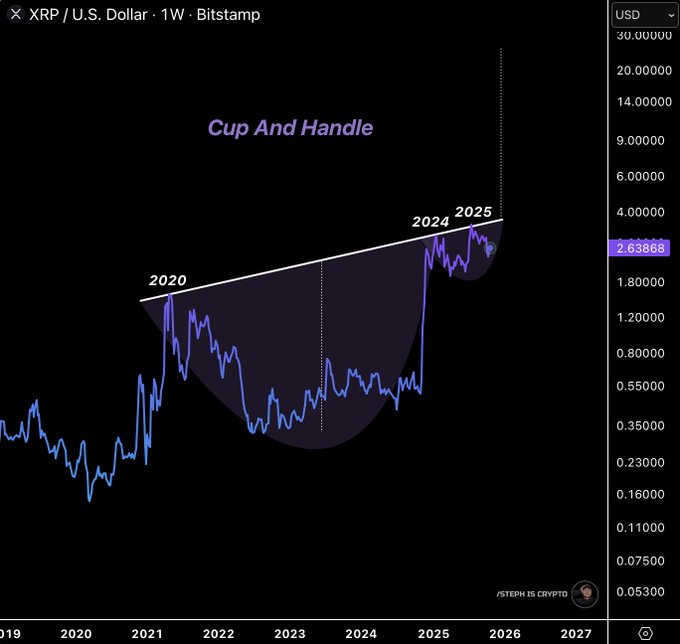
XRP 1W Cup-and-Handle. Source: @Steph_iscrypto / TradingView
The neckline tracks a rising trendline connecting prior peaks into 2024–2025. As price coils inside the handle, buyers test supply near that line. A weekly close above the neckline and the handle high would confirm the pattern and open room for trend extension. Until then, XRP remains in preparation mode.
Context matters. The handle shows lighter volatility than the cup, which often precedes breakouts. However, failure to reclaim the neckline would keep price inside the range and invite another retest of handle support before any attempt higher. Therefore, watch the weekly close and volume response at the neckline for confirmation.