
XRP Price Prediction: Consolidation Persists — Bulls Need Fresh Push For Breakout

XRP price started a fresh increase above $2.50. The price is now showing positive signs and might rise further if it clears the $2.6880 resistance.
- XRP price gained pace for a move above $2.50 and $2.550.
- The price is now trading above $2.50 and the 100-hourly Simple Moving Average.
- There is a bullish trend line forming with support at $2.60 on the hourly chart of the XRP/USD pair (data source from Kraken).
- The pair could start a fresh increase if it clears the $2.6880 resistance.
XRP Price Holds Support
XRP price started a fresh increase after it settled above $2.40, like Bitcoin and Ethereum. The price surpassed the $2.420 and $2.50 resistance levels.
The bulls were able to push the price above $2.550 and $2.65. A high was formed at $2.6972 and the price is now consolidating gains above the 23.6% Fib retracement level of the recent move from the $2.327 swing low to the $2.6972 high.
The price is now trading below $2.60 and the 100-hourly Simple Moving Average. There is a bullish trend line forming with support at $2.60 on the hourly chart of the XRP/USD pair.
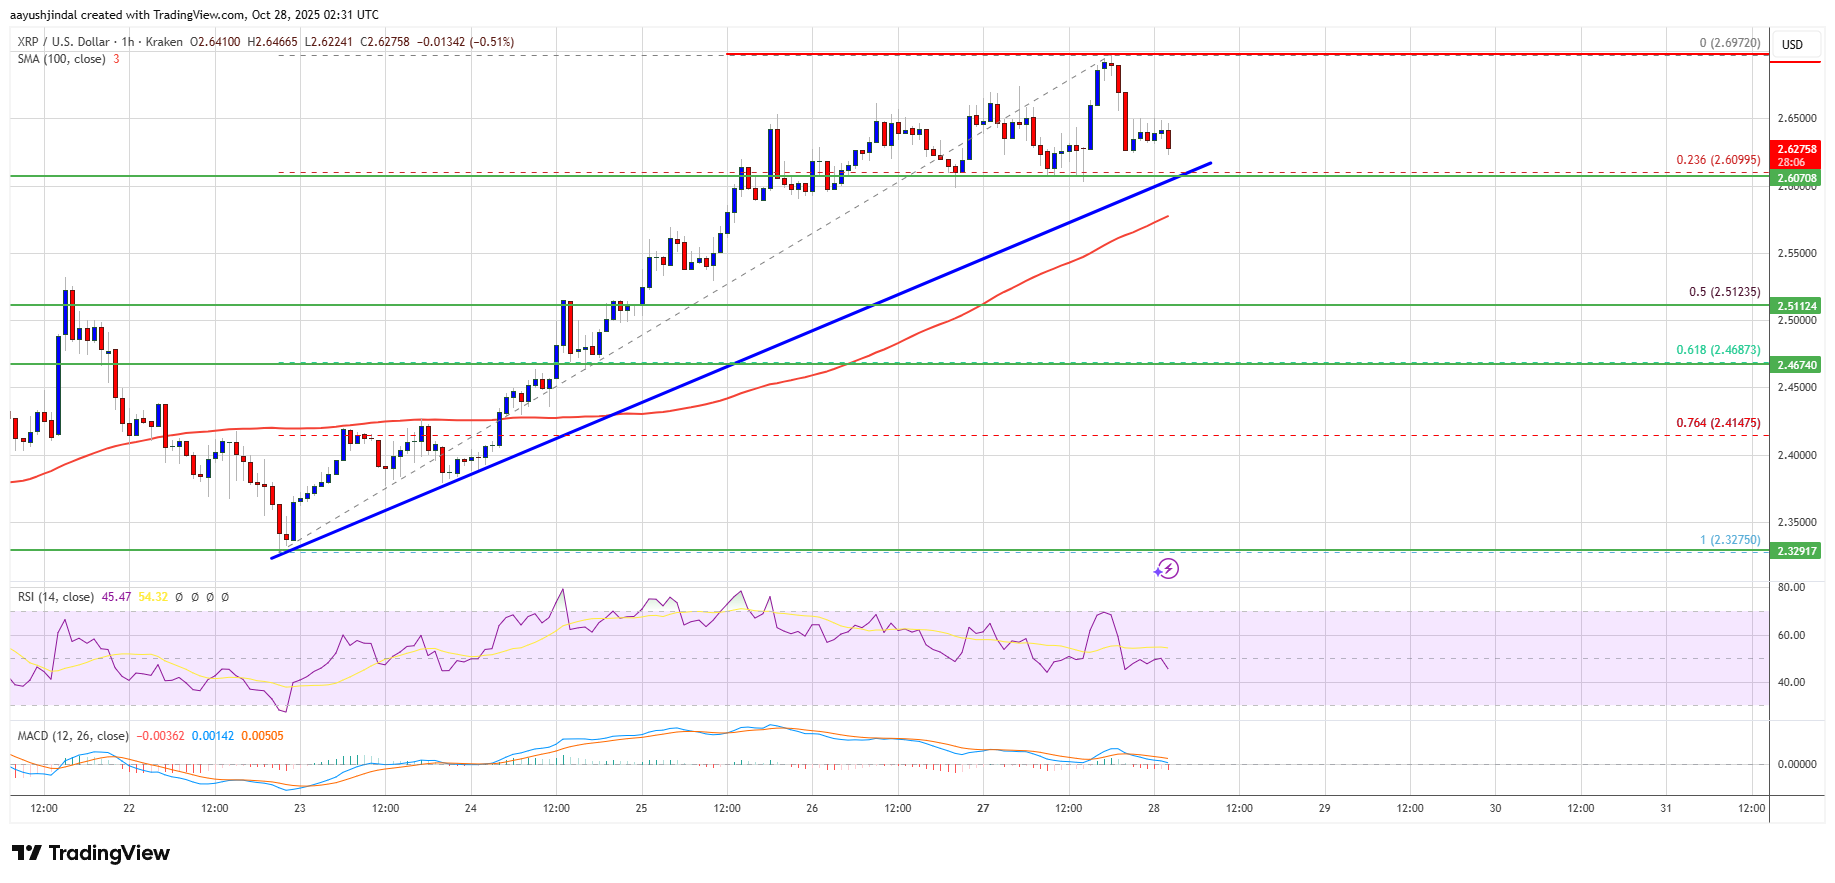
If there is a fresh upward move, the price might face resistance near the $2.650 level. The first major resistance is near the $2.6880 level, above which the price could rise and test $2.70. A clear move above the $2.70 resistance might send the price toward the $2.7650 resistance. Any more gains might send the price toward the $2.80 resistance. The next major hurdle for the bulls might be near $2.880.
Downside Correction?
If XRP fails to clear the $2.6880 resistance zone, it could start a fresh decline. Initial support on the downside is near the $2.60 level. The next major support is near the $2.5650 level.
If there is a downside break and a close below the $2.5650 level, the price might continue to decline toward $2.5120 or the 50% Fib retracement level of the recent move from the $2.327 swing low to the $2.6972 high. The next major support sits near the $2.4680 zone, below which the price could continue lower toward $2.420.
Technical Indicators
Hourly MACD – The MACD for XRP/USD is now losing pace in the bullish zone.
Hourly RSI (Relative Strength Index) – The RSI for XRP/USD is now above the 50 level.
Major Support Levels – $2.60 and $2.580.
Major Resistance Levels – $2.650 and $2.6880.
Disclaimer: The content of this article solely reflects the author's opinion and does not represent the platform in any capacity. This article is not intended to serve as a reference for making investment decisions.
You may also like
Metaplanet Unveils BTC Focused Capital and Repurchase Strategy
Mt. Gox Delays Bitcoin Repayments to 2026
Crypto Market Crash Wipes Out $79 Billion in 12 Hours
S&P Downgrades Strategy’s Financial Strength Amid Bitcoin Risks