Date: Thu, Oct 23, 2025 | 11:40 AM GMT
The broader cryptocurrency market continues to show an encouraging tone today, with Bitcoin (BTC) and Ethereum (ETH) both trading over 1% higher, setting the stage for potential upside in several altcoins — including Cronos (CRO).
CRO is back in green with modest intraday gains, but the latest chart setup suggests there might be more upside ahead. A developing harmonic pattern on its chart hints that a short-term bullish continuation could be underway.
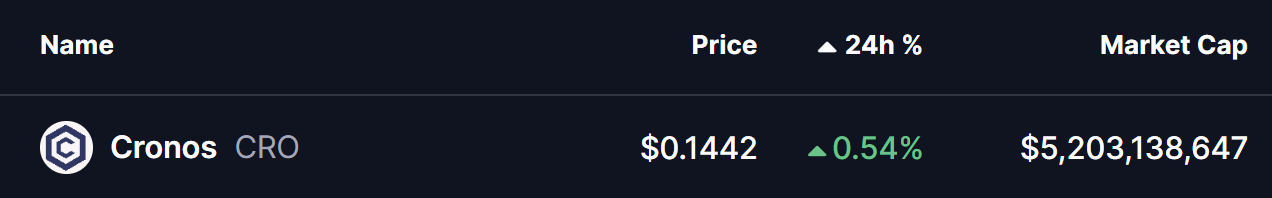 Source: Coinmarketcap
Harmonic Pattern Hints at Potential Upside
On the 4-hour chart, CRO appears to be forming a Bearish Bat harmonic pattern — a structure that, despite its name, typically features a bullish rally during the CD leg before reaching the final completion zone.
The pattern originated from Point X near $0.1771, followed by a sharp dip to Point A, a rebound toward Point B, and a deeper correction to Point C around $0.1360. After establishing this low, CRO has shown renewed strength, climbing to around $0.1433, signaling the early stages of a potential CD leg expansion.
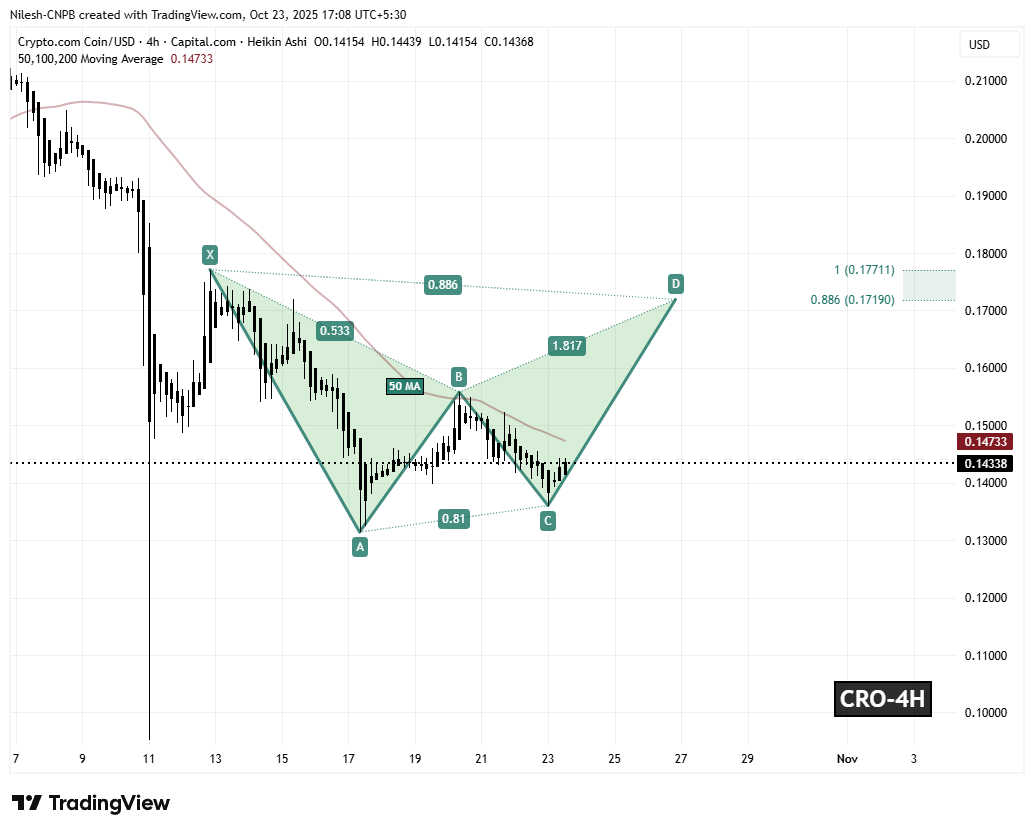 Cronos (CRO) 4H Chart/Coinsprobe (Source: Tradingview)
Crucially, the token is now hovering just below the 50-hour moving average (MA) at $0.14733 — a key short-term resistance level. A decisive breakout and candle close above this zone could flip it into support, confirming the bullish continuation phase of the pattern.
What’s Next for CRO?
If bulls sustain momentum above the 50-hour MA, the harmonic structure projects a potential move toward the Potential Reversal Zone (PRZ) between $0.1719 and $0.1771. These levels align with the 0.886 and 1.0 Fibonacci extensions, which have historically acted as completion zones for Bearish Bat patterns — marking where short-term rallies typically peak before any corrective pullback.
However, failure to defend the C-level support at $0.1360 could invalidate the setup and trigger a short-term pullback, possibly extending the consolidation before any renewed bullish push.