Date: Fri, Oct 17, 2025 | 07:55 AM GMT
The cryptocurrency market is undergoing another wave of volatility as Bitcoin (BTC) slipped below $106,000 today, marking a 4% daily drop. This fresh weakness has rippled across the major assets, with over $1 billion in total liquidations in the past 24 hours — of which $806 million came from long positions.
However, beneath the recent sell pressure, Bitcoin’s chart is quietly shaping a potential harmonic pattern that could hint at a reversal and rebound ahead.
 Source: Coinmarketcap
Bearish Gartley Pattern in Play?
On the 4-hour chart, BTC appears to be forming a Bearish Gartley harmonic pattern. Despite its name, this pattern often precedes a short-term bullish rally in the “CD” leg once the final pivot point (C) completes.
The setup began at Point X near $126,195, followed by a drop to Point A, a rebound toward Point B, and another slide lower that currently has Bitcoin hovering around $105,700 — with sellers still maintaining control.
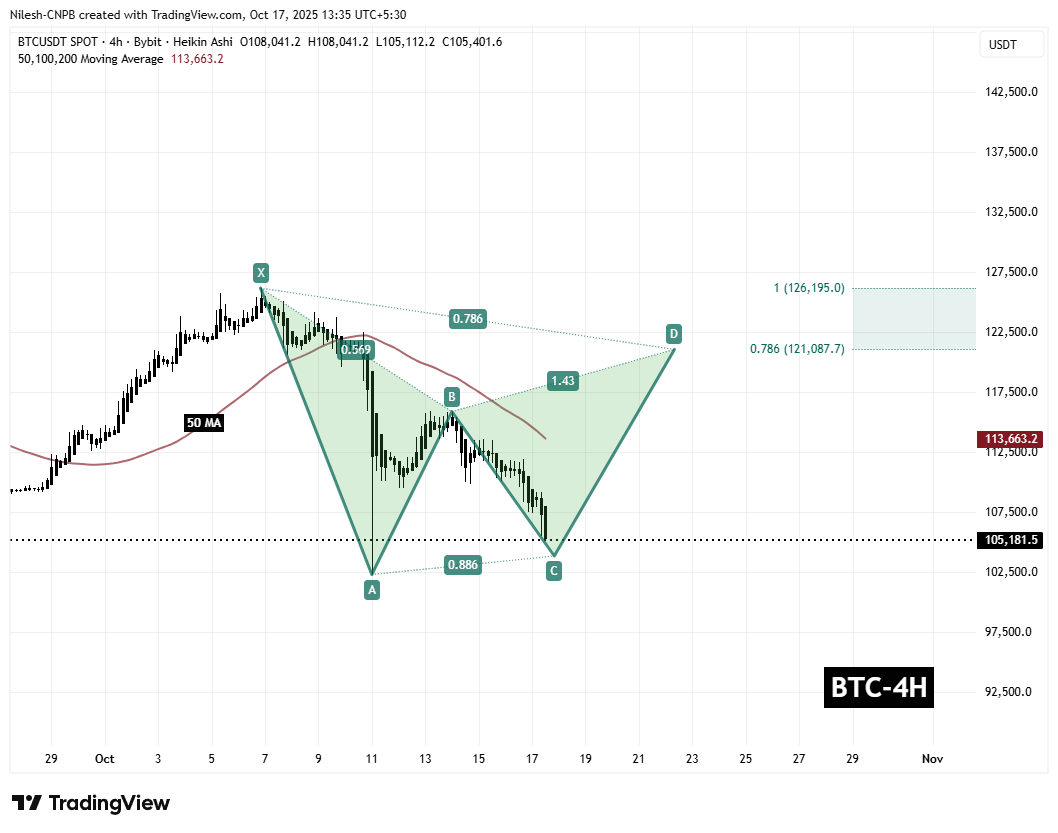 Bitcoin (BTC) 4H Chart/Coinsprobe (Source: Tradingview)
From here, the pattern suggests BTC could drift further down toward the $103,880 zone, aligning with the 0.886 Fibonacci retracement level, where Point C may complete. If confirmed, this could set the stage for a potential bullish CD leg, marking a reversal phase in the ongoing correction.
What’s Next for BTC?
If buyers step in and defend the $103,880 support area, Bitcoin could stage a recovery, reclaiming the 50-period moving average near $114,000. That would confirm bullish momentum and potentially send prices toward the $121,087 – $126,195 range, corresponding to the 0.786 and 1.0 Fibonacci targets.
This scenario would imply a potential 20% upside from current levels.
However, the confirmation of Point C remains crucial. A breakdown below $103,880 would invalidate the harmonic setup and expose BTC to further downside risk before any recovery attempt.