XRP Price Eyes Key Upside Break – Can Bulls Finally Regain Control?

XRP price started a fresh increase above $2.50. The price is now showing positive signs and could aim for more gains above the $2.620 level.
- XRP price is attempting a recovery wave above the $2.50 zone.
- The price is now trading above $2.50 and the 100-hourly Simple Moving Average.
- There is a key bearish trend line forming with resistance at $2.60 on the hourly chart of the XRP/USD pair (data source from Kraken).
- The pair could start a fresh surge if it clears the $2.60 resistance.
XRP Price Set To Surge?
XRP price found support and started a strong recovery wave above $2.220, like Bitcoin and Ethereum. The price was able to climb above the $2.320 and $2.40 levels to enter a positive zone.
The bulls were able to push the price above the 61.8% Fib retracement level of the downward move from the $3.05 swing high to the $1.40 swing low. However, the bears are still active near the $2.60 and $2.620 levels. Besides, there is a key bearish trend line forming with resistance at $2.60 on the hourly chart of the XRP/USD pair.
The price is now trading above $2.50 and the 100-hourly Simple Moving Average. If there is a fresh upward move, the price might face resistance near the $2.550 level.
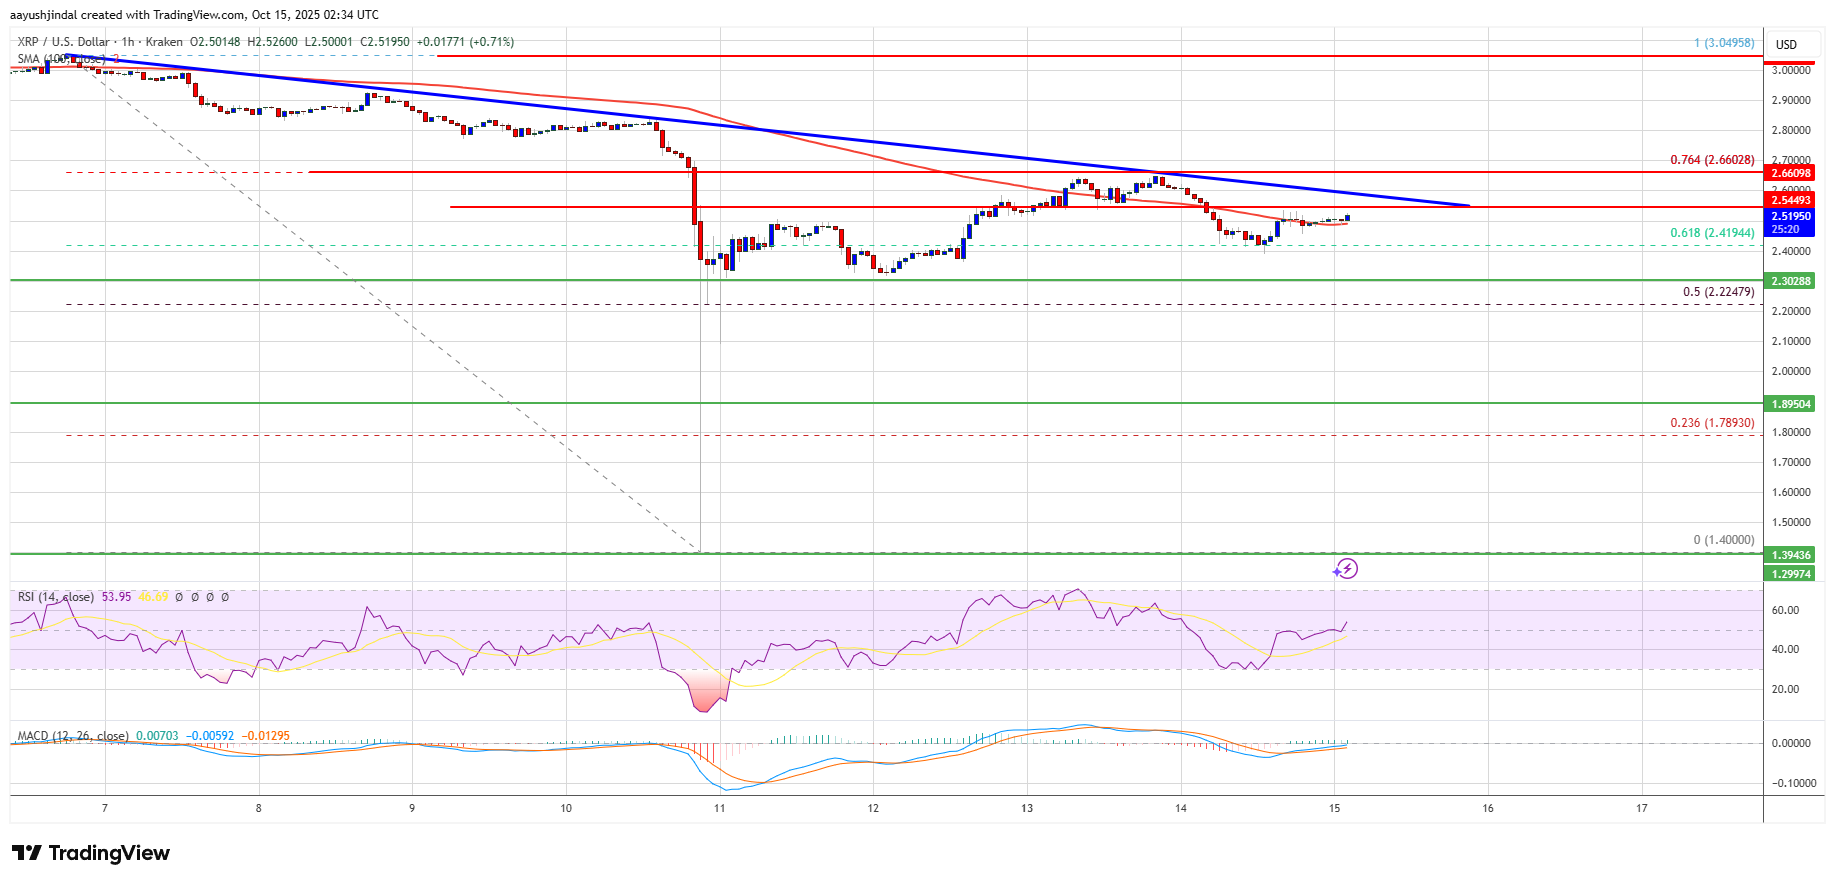
The first major resistance is near the $2.60 level and the trend line. The main hurdle could be near the 76.4% Fib retracement level of the downward move from the $3.05 swing high to the $1.40 swing low at $2.660. A clear move above the $2.660 resistance might send the price toward the $2.720 resistance. Any more gains might send the price toward the $2.750 resistance. The next major hurdle for the bulls might be near $2.80.
Another Drop?
If XRP fails to clear the $2.60 resistance zone, it could start a fresh decline. Initial support on the downside is near the $2.50 level. The next major support is near the $2.420 level.
If there is a downside break and a close below the $2.420 level, the price might continue to decline toward $2.320. The next major support sits near the $2.250 zone, below which the price could continue lower toward $2.20.
Technical Indicators
Hourly MACD – The MACD for XRP/USD is now gaining pace in the bullish zone.
Hourly RSI (Relative Strength Index) – The RSI for XRP/USD is now above the 50 level.
Major Support Levels – $2.50 and $2.420.
Major Resistance Levels – $2.60 and $2.660.
Disclaimer: The content of this article solely reflects the author's opinion and does not represent the platform in any capacity. This article is not intended to serve as a reference for making investment decisions.
You may also like
Is the moat of public blockchains only 3 points? Alliance DAO founder's remarks spark heated debate in the crypto community
Instead of worrying about "moats," perhaps we should focus more on how cryptocurrencies can meet the real needs of more market users faster, at lower cost, and with greater convenience.

Digital Finance Game: Unveiling the US Cryptocurrency Strategy

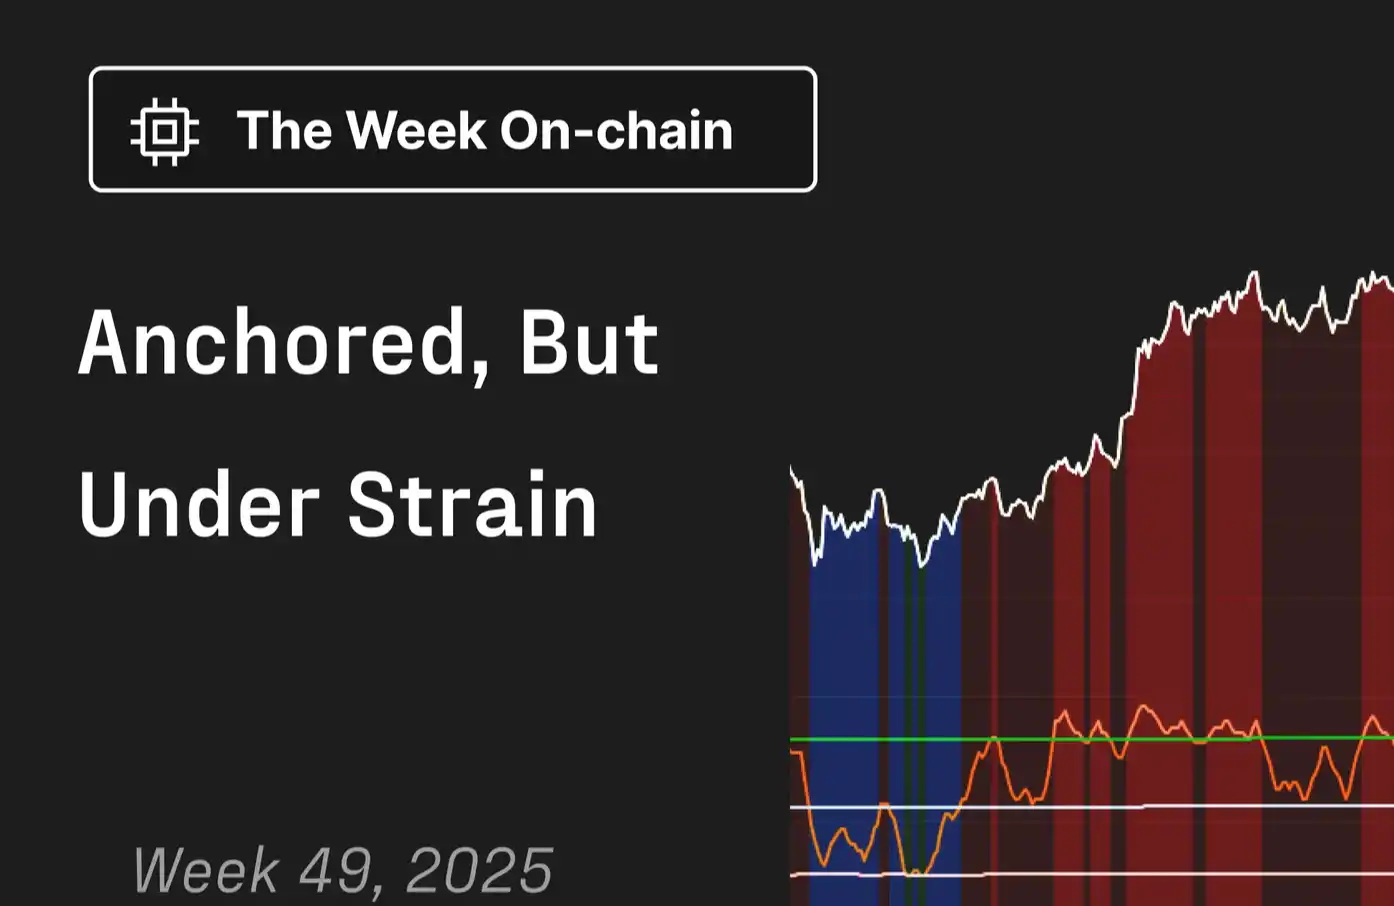
Glassnode: Bitcoin weakly fluctuates, is major volatility coming?
If signs of seller exhaustion begin to appear, it is still possible in the short term for bitcoin to move towards the $95,000 level and the short-term holder cost basis.
Axe Compute (NASDAQ: AGPU) completes corporate restructuring (formerly POAI), enterprise-level decentralized GPU computing power Aethir officially enters the mainstream market
Predictive Oncology officially announced today that it has changed its name to Axe Compute and will trade on Nasdaq under the ticker symbol AGPU. This rebranding marks Axe Compute's transition into an enterprise-level operator, officially commercializing Aethir's decentralized GPU network to provide robust, enterprise-grade computing power services for AI companies worldwide.