Who is the culprit behind the liquidation of 1.6 million people?

It's not USDe depegging, nor Binance disconnecting, but rather market makers collectively acting maliciously?
It wasn't USDe depegging, nor Binance pulling the plug, but a collective wrongdoing by market makers?
Written by: YQ
Translated by: AididiaoJP, Foresight News
In my previous three analyses of the cascading liquidations in the cryptocurrency market from October 10th to 11th, I examined oracle failures, infrastructure breakdowns, and potential vectors for coordinated attacks. This article shifts focus to perhaps the most critical yet underappreciated aspect: market makers. How did these entities, which are supposed to provide market stability, become the main catalyst for creating an unprecedented liquidity vacuum, turning a manageable adjustment into a $19 billions disaster?
Understanding Market Makers: Theory vs. Reality
Before examining the October crash, it’s crucial to understand what market makers are supposed to do. In traditional financial markets, market makers act as intermediaries, continuously quoting bid and ask prices for financial instruments. They profit from the spread between these prices while providing a key service: liquidity.
The theoretical roles of market makers include:
- Continuous price discovery: Maintaining two-way quotes that reflect fair market value
- Liquidity provision: Ensuring traders can buy or sell at any time without significant price impact
- Volatility dampening: Absorbing temporary supply-demand imbalances
- Market efficiency: Arbitraging between venues to maintain unified pricing
In cryptocurrency markets, market makers operate similarly but face unique challenges:
- 24/7 nonstop markets, with no closing bell
- Liquidity fragmented across hundreds of exchanges
- Extreme volatility compared to traditional assets
- Limited regulatory oversight and obligations
- Technical infrastructure demands for high-frequency trading
Under normal market conditions, this system works fairly well. Market makers earn modest spreads while providing necessary liquidity. However, October 10th-11th revealed what happens when arbitrage diverges from responsibility.
Timeline of Withdrawal
The precision of market makers’ withdrawal during the October crash reveals coordinated behavior rather than panic. Here’s a detailed timeline of how liquidity evaporated:
20:00 UTC: News of Trump’s formal announcement of 100% tariffs on Chinese imports hits social media. Bitcoin drops from $122,000. Market makers maintain positions but begin widening spreads—a standard defensive move.
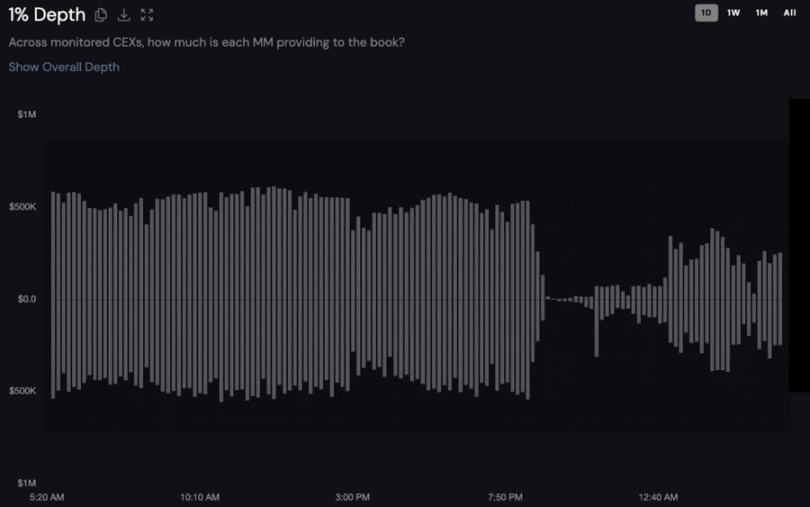
Chart description: Binance, unnamed token _0, 1% two-way depth over the past 24 hours. Buy orders below the X-axis, sell orders above. Source: Coinwatch
20:40 UTC: Real-time tracking shows the start of catastrophic liquidity withdrawal. On a major token, market depth begins to plunge from $1.2 million.
21:00 UTC: The critical turning point. As the US trading session begins, macro conditions deteriorate sharply. Institutional participants withdraw liquidity, spreads widen, and order book depth thins. At this point, market makers shift from a defensive stance to full withdrawal.
21:20 UTC: Peak chaos. Nearly all tokens bottom out globally around this time amid a liquidation wave. The tracked token’s market depth drops to just $27,000—a 98% plunge. At the $108,000 level, liquidity providers stop maintaining prices, and some altcoins are pushed down by 80%.
21:35 UTC: As the most intense selling subsides, market makers cautiously return. Within 35 minutes, aggregated bid-ask depth on centralized exchanges recovers to over 90% of pre-event levels—but only after the greatest damage is done.
This pattern reveals three key points:
- Market makers had a 20-40 minute warning window before full withdrawal
- Withdrawals were synchronized across multiple firms
- Liquidity only returned after a profitable re-entry point appeared
When Insurance Funds Fail: The Auto-Deleveraging Cascade
When market makers abandon price maintenance and liquidations overwhelm the order book, exchanges trigger their last line of defense: auto-deleveraging. Understanding this mechanism is crucial to grasping the full scope of the October disaster.
How Auto-Deleveraging Works on Centralized Exchanges
Auto-deleveraging represents the third and final tier in the liquidation hierarchy:
- Tier 1 Order Book Liquidation: When a position falls below maintenance margin, the exchange attempts to close it via the order book. If it closes at a price better than the bankruptcy price (i.e., when margin = 0), excess funds go to the insurance fund.
- Tier 2 Insurance Fund: If order book liquidity is insufficient, the insurance fund absorbs the loss. This fund is built up during normal times from liquidation profits and acts as a buffer for bad debt.
- Tier 3 Auto-Deleveraging: When the insurance fund cannot cover the loss, the exchange forcibly closes profitable positions on the counterparty side.
Auto-Deleveraging (ADL) Ranking System
Binance’s auto-deleveraging mechanism uses a complex ranking formula:
Auto-deleveraging rank score = Position P&L percentage × Effective leverage
Where:
- Position P&L percentage = Unrealized profit / abs(nominal position value)
- Effective leverage = abs(nominal position value) / (account balance - unrealized loss + unrealized profit)
Bybit’s approach is similar but includes additional safeguards. They display a 5-level ranking showing percentile:
- Level 5 = Top 20% (highest auto-deleveraging priority)
- Level 4 = 20-40%
- Level 3 = 40-60%
- Level 2 = 60-80%
- Level 1 = Bottom 20% (lowest auto-deleveraging priority)
The cruel irony: the most successful traders—those with the highest profits and leverage—are the first to be forcibly closed.
The Auto-Deleveraging Disaster of October
The scale of auto-deleveraging on October 10th-11th was unprecedented:
- Hyperliquid: Activated cross-margin auto-deleveraging for the first time in over two years, affecting more than 1,000 wallets
- Binance: Widespread auto-deleveraging was triggered
- Bybit: Reported over 50,000 short positions auto-deleveraged, totaling $1.1 billions
- BitMEX: Only 15 contracts auto-deleveraged due to a large insurance fund
The correlation with market maker withdrawal timing is conclusive. As order books were emptied between 21:00-21:20 UTC, liquidations could not be completed normally, forcing insurance funds to deplete rapidly and triggering auto-deleveraging.
Case Study: A Chain Reaction Example
Consider what happened to a typical hedged portfolio during that critical 35-minute window:
21:00 UTC: The trader holds
- Bitcoin long: $5 million, 3x leverage
- Dogecoin short: $500,000, 15x leverage (profitable hedge)
- Ethereum long: $1 million, 5x leverage
21:10 UTC: Market makers withdraw. Dogecoin crashes, and the short position becomes highly profitable. But this combination of high leverage + profit triggers auto-deleveraging.
21:15 UTC: The Dogecoin short is forcibly closed via auto-deleveraging, and the portfolio loses its hedge.
21:20 UTC: With no hedge, the Bitcoin and Ethereum long positions are liquidated in the chain reaction.
Total loss: the entire portfolio.
This pattern repeated thousands of times. Sophisticated traders with carefully balanced positions saw their profitable hedges forcibly closed via auto-deleveraging, leaving them exposed and subsequently liquidated.
Why Market Makers Failed: Incentive Problems
The synchronized withdrawal of liquidity reveals a fundamental structural problem. Market makers face incentives across multiple markets:
Asymmetric Risk/Reward
During extreme volatility, the potential losses from maintaining quotes far exceed spread profits. A market maker quoting $1 million in depth might earn $10,000 in spread during normal times, but face $500,000 in losses during a cascade.
Information Advantage
Market makers can see aggregated order flow and position distribution. When they detect a massive long bias (87% of positions are long), they know which way the cascade will go. If you know a tsunami of sell orders is coming, why provide bids?
No Defined Obligations
Unlike designated market makers in traditional exchanges, who have regulatory requirements, crypto market makers can withdraw at will, abandoning the market during crises with no penalty.
Arbitrage Opportunities
Data from the crash shows that market makers who withdrew quotes turned to arbitrage between exchanges. As price differences between venues reached over $300, arbitrage became far more profitable than market making.
The Devastating Feedback Loop
The interaction between market maker withdrawal and auto-deleveraging created a devastating feedback loop:
- The initial shock (Trump tariff announcement) triggers selling
- Market makers sense the potential for a cascade and withdraw
- Liquidations cannot be completed through empty order books
- Insurance funds are rapidly depleted to absorb bad debt
- Auto-deleveraging is triggered, forcibly closing profitable positions
- Traders who are auto-deleveraged must re-hedge, adding to selling pressure
- More liquidations are triggered, returning to step 3
This cycle continues until leveraged positions are essentially wiped out. Data shows total open interest in the market dropped by about 50% within hours.
The Unsettling Truth About Market Structure
The disaster of October 10th-11th was not primarily about excessive leverage or regulatory failure, but about misaligned incentives in market structure. When those responsible for maintaining orderly markets profit more from chaos than from stability, chaos becomes inevitable.
Timeline data shows that market makers did not panic—they executed a coordinated withdrawal at the optimal moment to minimize their own losses while maximizing subsequent opportunities. This rational behavior under the current incentive structure produced irrational outcomes for the entire market.
Rebuilding Trust Through Accountability
The liquidity crisis of October 2025 exposed a key weakness in crypto markets: voluntary liquidity provision fails precisely when involuntary provision is most needed. The $19 billions in liquidations was not just over-leveraged traders getting trapped; it was the predictable result of a system where market makers enjoy all the privileges of liquidity provision with none of the responsibility.
Pure laissez-faire market making does not work during periods of stress. Just as traditional markets evolved from the chaos of unregulated trading to include circuit breakers, position limits, and market maker obligations, crypto markets must implement similar safeguards.
Technical solutions exist:
- Tiered obligation systems that link privileges to responsibilities
- Insurance funds sized by actual risk, not optimistic forecasts
- Auto-deleveraging mechanisms with circuit breakers to prevent cascades
- Real-time transparency into market maker behavior
What’s missing is the will to implement them. Unless crypto exchanges prioritize long-term stability over short-term fee maximization, we will continue to experience these "unprecedented" events with depressing regularity.
The 1.6 million accounts liquidated on October 10th-11th paid the price for this structural failure. The question is whether the industry will learn from their sacrifice, or simply wait for the next batch of traders to discover that, when crisis hits, the market makers they rely on will vanish like smoke, leaving only cascading liquidations and forcibly closed profitable positions behind.
Disclaimer: The content of this article solely reflects the author's opinion and does not represent the platform in any capacity. This article is not intended to serve as a reference for making investment decisions.
You may also like
Prize pool of 60,000 USDT, “TRON ECO Holiday Odyssey” annual ecological exploration event is about to begin
TRON ECO is launching a major ecosystem collaboration event during Christmas and New Year, offering multiple luxurious benefits across the entire ecosystem experience!

Interpretation of the CoinShares 2026 Report: Bidding Farewell to Speculative Narratives and Embracing the First Year of Utility
2026 is expected to be the "year of utility wins," when digital assets will no longer attempt to replace the traditional financial system, but rather enhance and modernize existing systems.

Crypto Market Plummets as Fed’s Hawkish Stance Stuns Traders
In Brief Crypto market lost 3%, market cap fell to $3.1 trillion. Fed's hawkish rate cut intensified market pressure and volatility. Interest rate rise in Japan further destabilized crypto prices globally.