In the past, designing trading strategies required coding, which was a high barrier to entry. Now, with the "visual script" feature, you don't need to know programming; you can create professional trading strategies just by dragging and dropping a few steps like building blocks, and you can also set up candlestick chart displays and trading alerts!
1. What is a "visual script"?
Simply put, it is a WYSIWYG (What You See Is What You Get) tool. Whatever functionality you want, you can directly drag and set it on the interface, and the system will automatically generate complex trading strategies for you.
Advantages:
Zero coding barrier: No need to learn programming languages.
Professionalism: The generated strategies are still professional and effective.
Scalability: If you want to go deeper in the future, you can directly modify the code based on the visual generation (the platform provides a proprietary language), achieving a smooth transition.
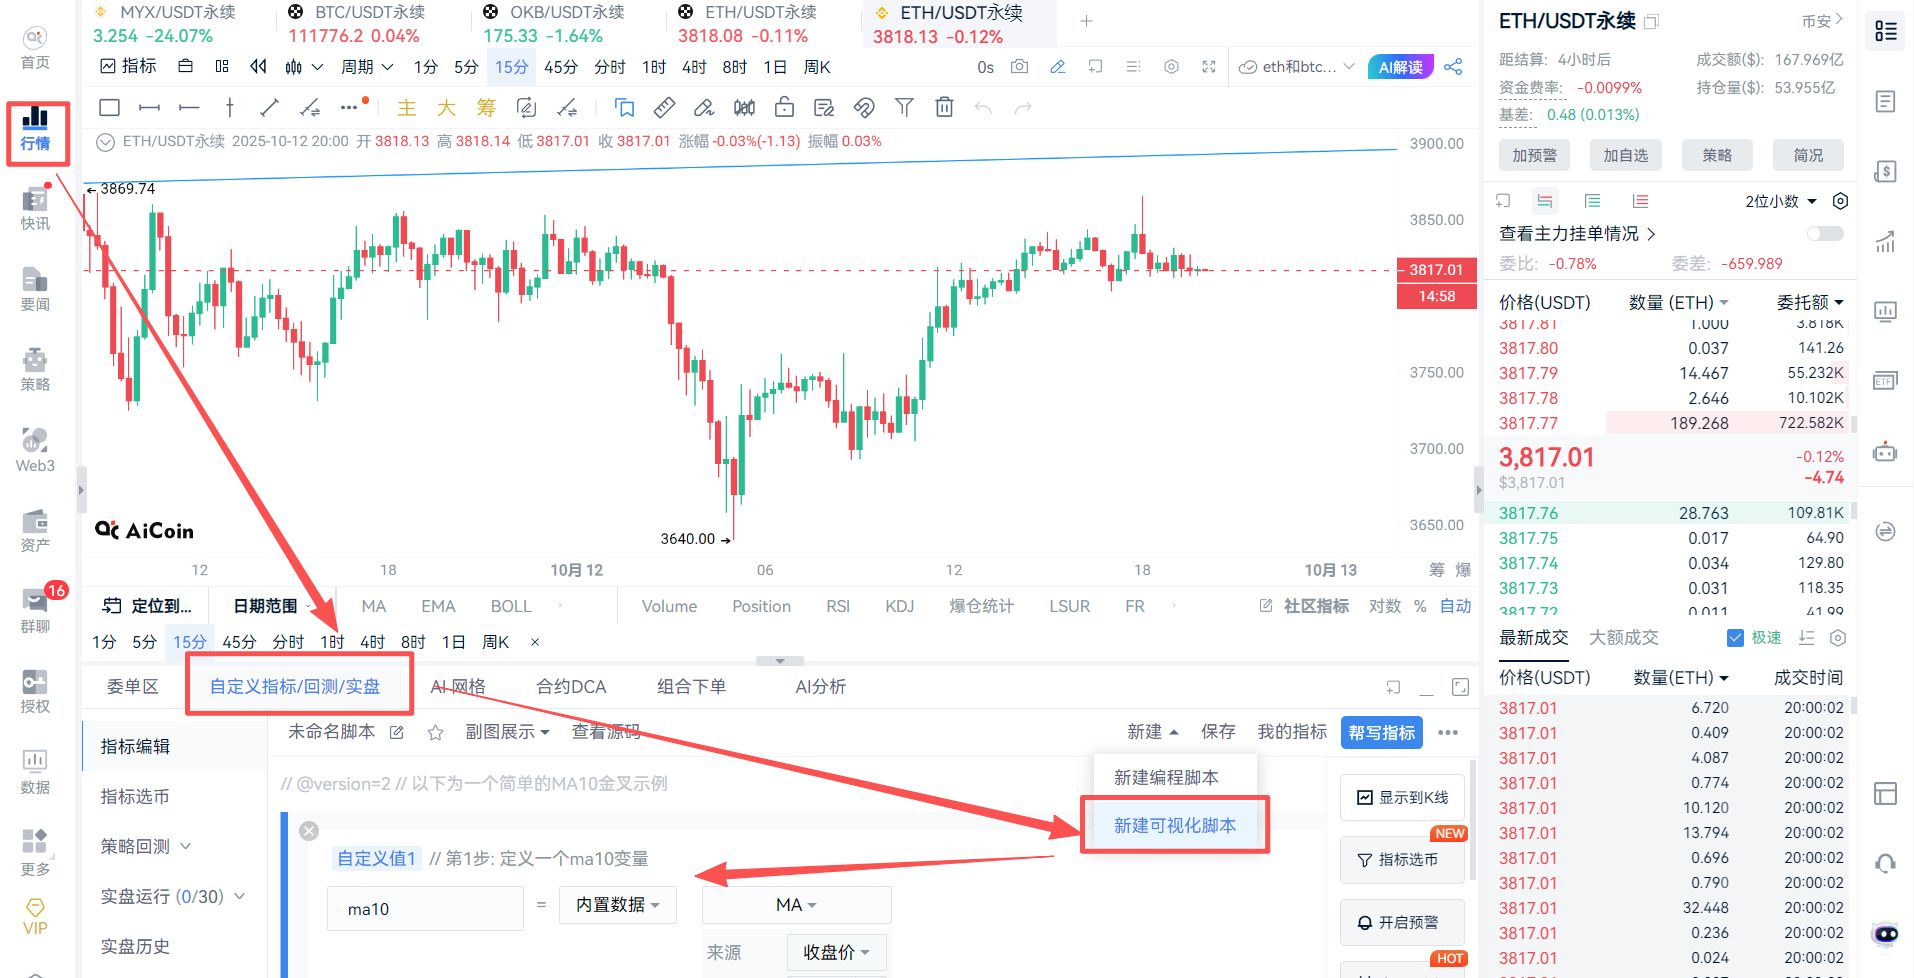
2. Easily generate trading strategies in four steps (using moving averages as an example)
Let's take the most commonly used "moving average bullish strategy" (i.e., buying on a "golden cross" for an uptrend) as an example to teach you how to complete a strategy in four steps:
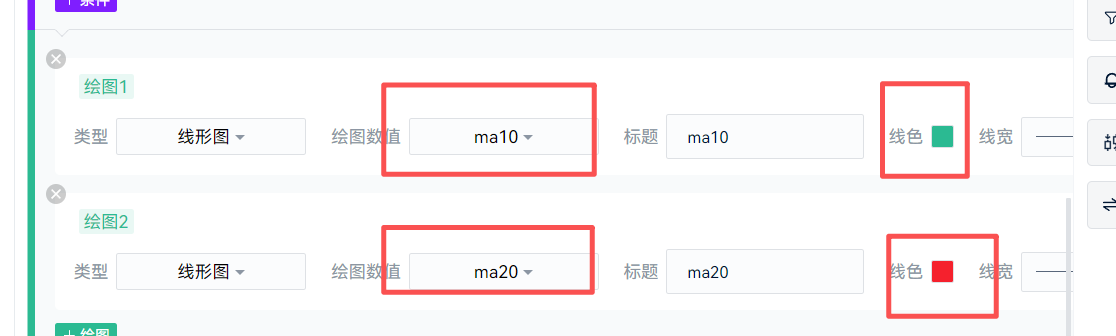
(1) Define indicators: For example, set two moving averages: MA10 (10-day moving average) and MA20 (20-day moving average).

(2) Set conditions: Set the trigger signal for the strategy. For example, MA10 crossing above MA20 (commonly known as the "golden cross") as a buy signal.


(3) Chart display: Set attractive line colors for your moving averages, and add markers for buy and sell signals to easily distinguish them on the candlestick chart.
Draw moving averages:
Draw golden cross and death cross markers:

(4) Set alerts: When the condition set in step two (golden cross) is met, set the system to pop up or notify you, so you can seize trading opportunities.

After completing the above four steps, click "Save" and select "Display on candlestick chart," and a complete trading strategy is ready!

Let's take a look at the chart displayed on the candlestick chart:

Next, let's set up an alert to see the effect:


3. More commonly used strategy references
After mastering the moving average strategy, you can use the same approach to create other commonly used strategies, such as:
1. "Crossover gear shift" strategy for the KDJ indicator
The crossover of the K and D lines in the KDJ indicator is also commonly used to determine buy and sell timing:
Golden cross (K crosses above D): Like shifting a car into "drive," indicating a possible uptrend.
Death cross (K crosses below D): Like shifting a car into "reverse" or "slowing down," indicating a possible downtrend.
Key point: The position of the KDJ is very important. A golden cross at a low position (oversold area) is more reliable, while a death cross at a high position (overbought area) is more dangerous.

We have prepared a wealth of visual indicator templates, with basic usage preset for you, which can be added with one click.

2. Advanced strategy usage: Viewing and modifying code
Although it is a zero-code operation, the system will generate professional code in the background. If you want to advance, you can view the generated source code at any time and modify and optimize it to achieve more complex and personalized strategies.

(Sample source code. It's okay if you don't understand it, just know this feature exists!)
// @version=2
// Step 1: Define a ma10 variable
ma10 = ma(close, 10)
ma20 = ma(close, 20)
// Step 2: Set conditions
condition_1 = crossup(ma10, ma20)
condition_2 = crossdown(ma10, ma20)
// Step 3: Draw graphics
plot(ma10, title='ma10', color='#2bba92', lineWidth=1, lineDash=[0])
plot(ma20, title='ma20', color='rgba(245,33,45,1)', lineWidth=1, lineDash=[0])
plotText(condition_1, text='Golden Cross', title='Golden Cross', refSeries=ma10, placement='top', color='rgba(255,133,192,1)')
plotText(condition_2, text='Death Cross', title='Death Cross', refSeries=ma20, placement='top', color='rgba(179,127,234,1)')
// Step 4: Add alerts
alertcondition(condition_1, title='ma10 Golden Cross', direction='buy')
alertcondition(condition_2, title='m10 Death Cross', direction='sell')
Many tools on the market either require you to write pure code (too difficult for beginners) or only provide fixed templates (no personalized adjustments).
This "visual script" feature has found the "optimal middle solution":
For beginners: Zero-code operation, easily get started as a "strategy designer."
For professionals: Supports proprietary language, meeting the flexible needs of complex strategies.
It allows you to no longer rely solely on subjective experience or blindly follow trends, but to turn your own trading ideas into concrete, executable strategies.
4. Advanced learning resources
If you want to upgrade from "strategy designer" to "strategy developer," you can check out the learning materials provided by the platform: