
Bitcoin Price Analysis: Is This BTC’s Calm Before Another Major Storm?

Bitcoin is stabilizing around $110K after a corrective phase, with price action showing early signs of consolidation.
While the market is holding key support zones, momentum remains muted, and sentiment indicators like exchange reserves are pointing to long-term accumulation.
By Shayan
The Daily Chart
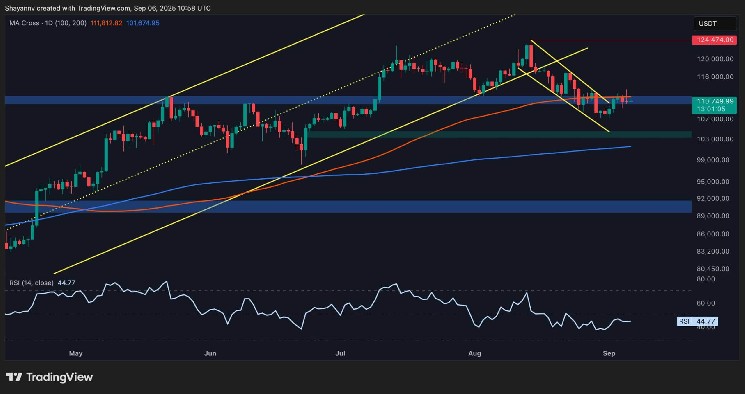
On the daily timeframe, BTC has broken below its ascending channel but found support near the $110K region, which aligns closely with the 100-day moving average. The RSI sits around 44, showing that momentum is weak but not in oversold conditions yet. This suggests that the market is in a pause phase, waiting for either a rebound confirmation or a deeper retracement.
If the buyers defend $110K successfully, the next resistance sits at $116K and then the $124K record high. However, a breakdown below $110K could extend the decline toward the $104K demand zone, which has acted as a strong base in the past.
The 4-Hour Chart
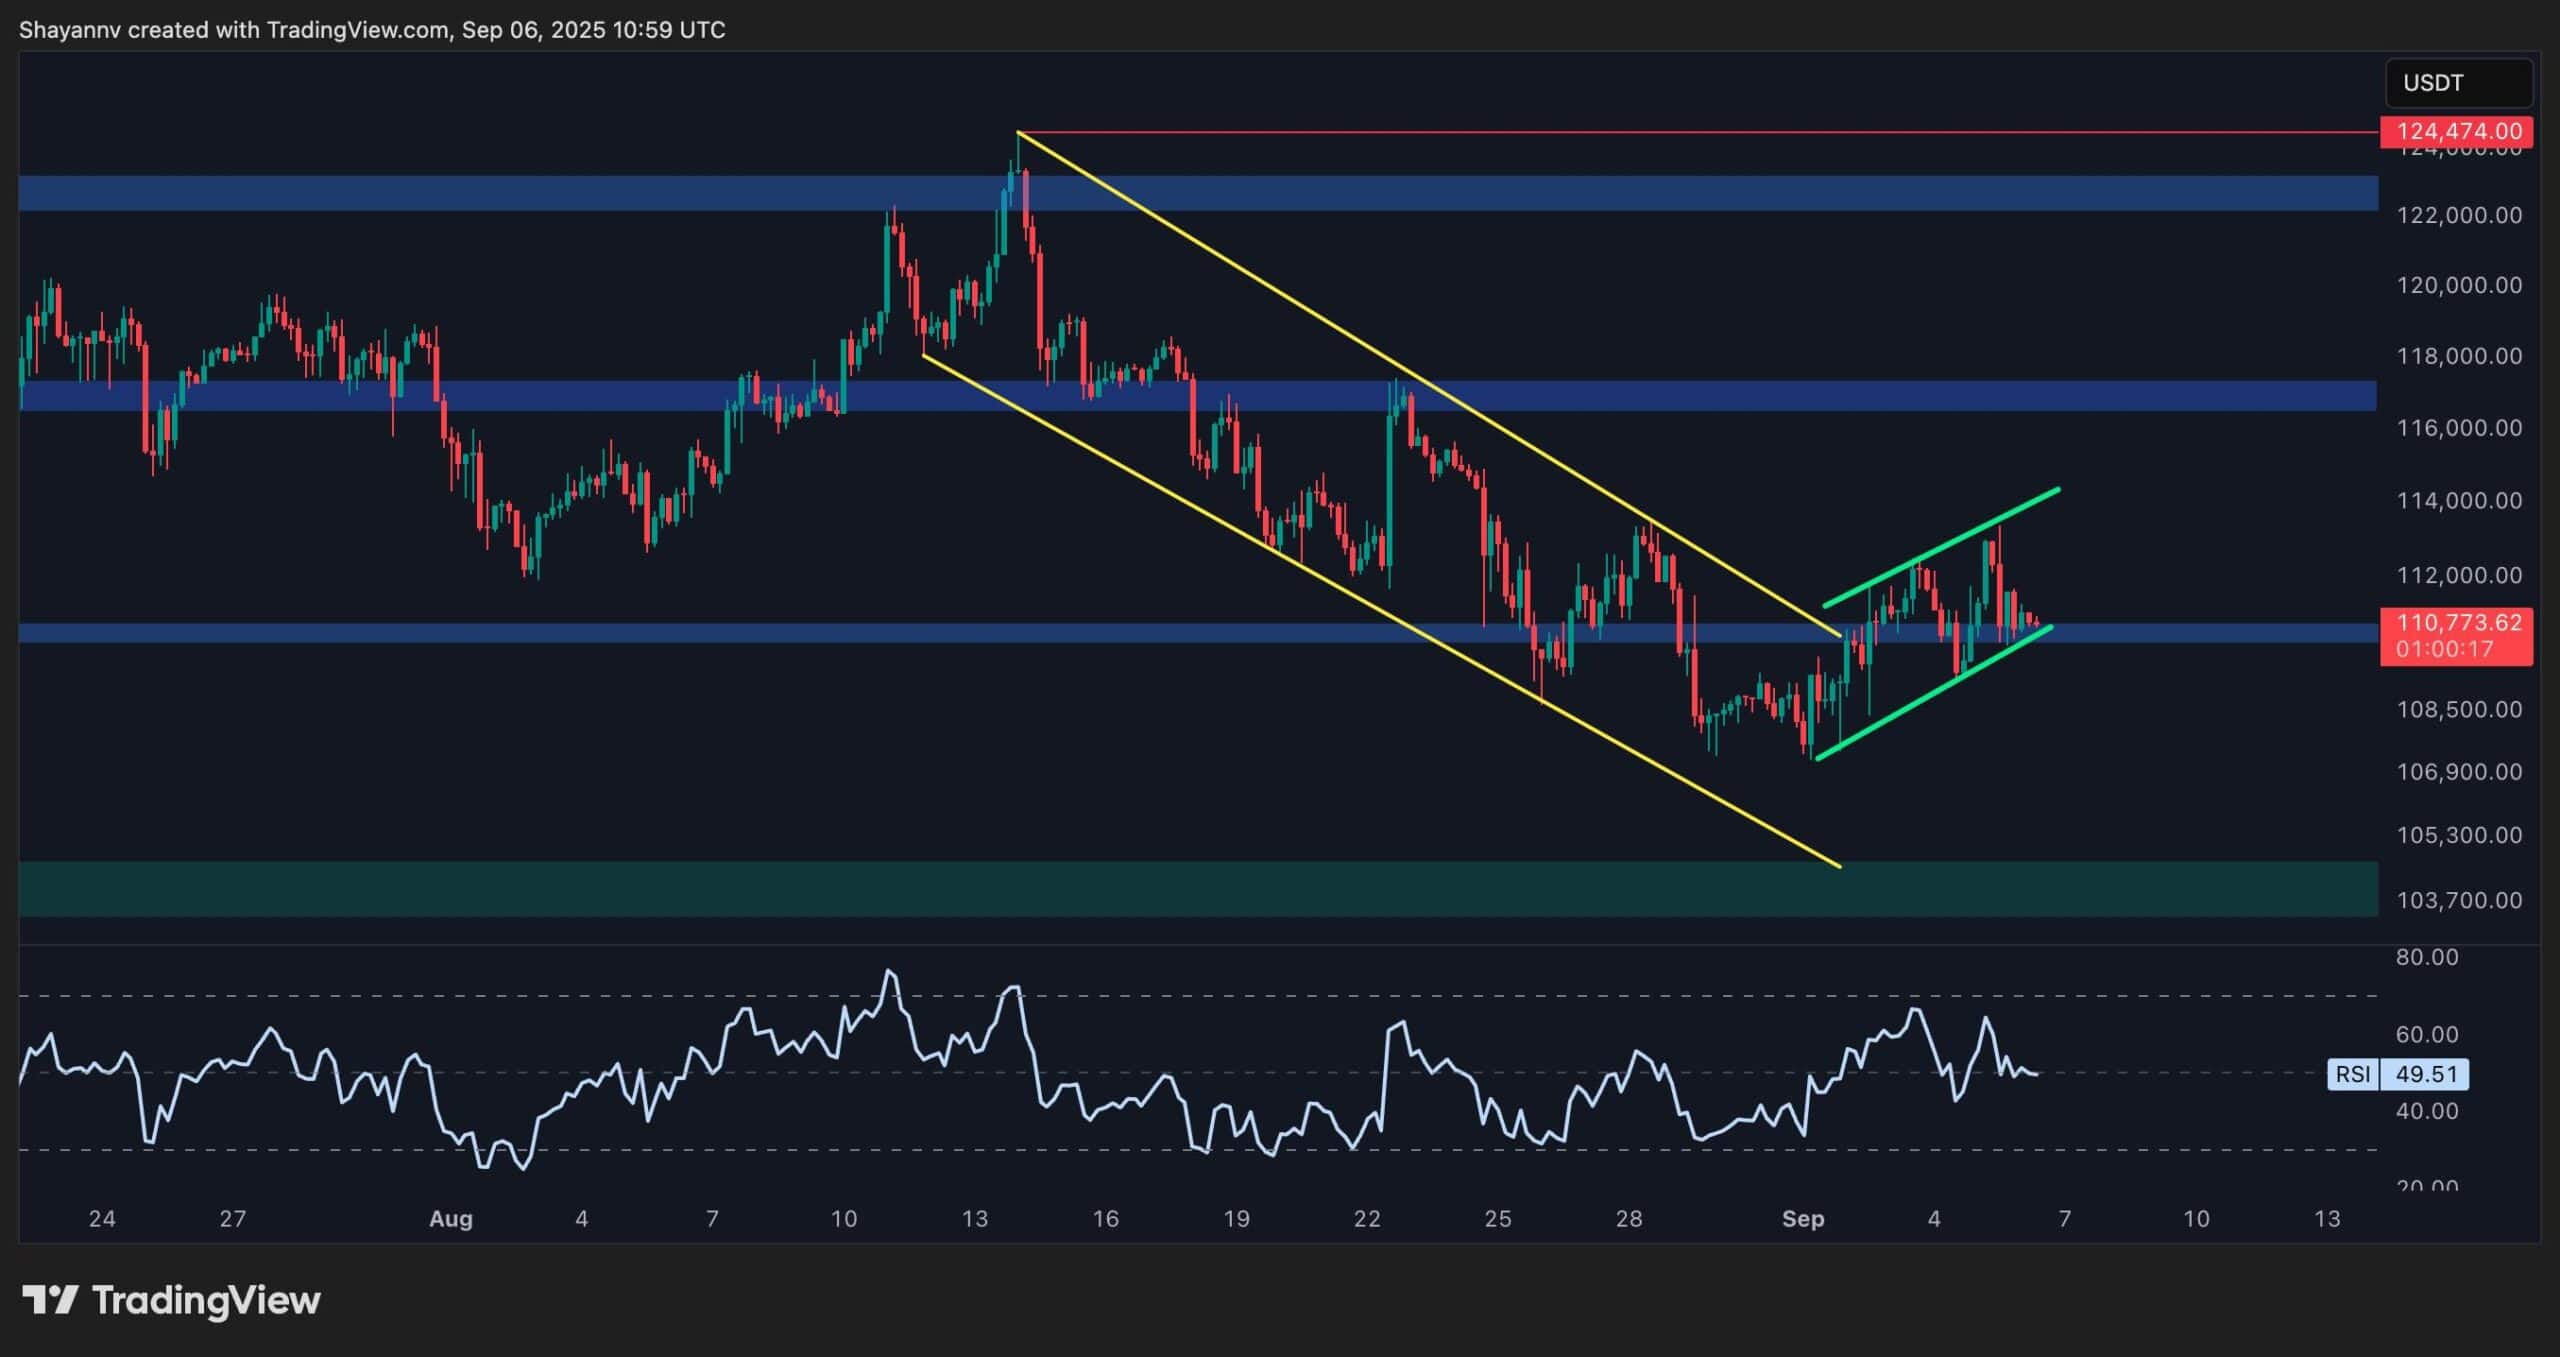
On the 4-hour chart, Bitcoin broke out of a steep descending channel but is now moving within a smaller rising channel. Price is currently retesting the $110K–$111K zone, which has become the key short-term pivot. The RSI is balanced around 49, reflecting market indecision and a lack of clear momentum.
If this support zone holds, a push toward $114K is likely, where sellers could step in again. On the other hand, a clean drop below $109K would invalidate the short-term bullish structure and open the way for a deeper move toward the $104K demand zone previously mentioned.
Onchain Analysis
Exchange Reserve
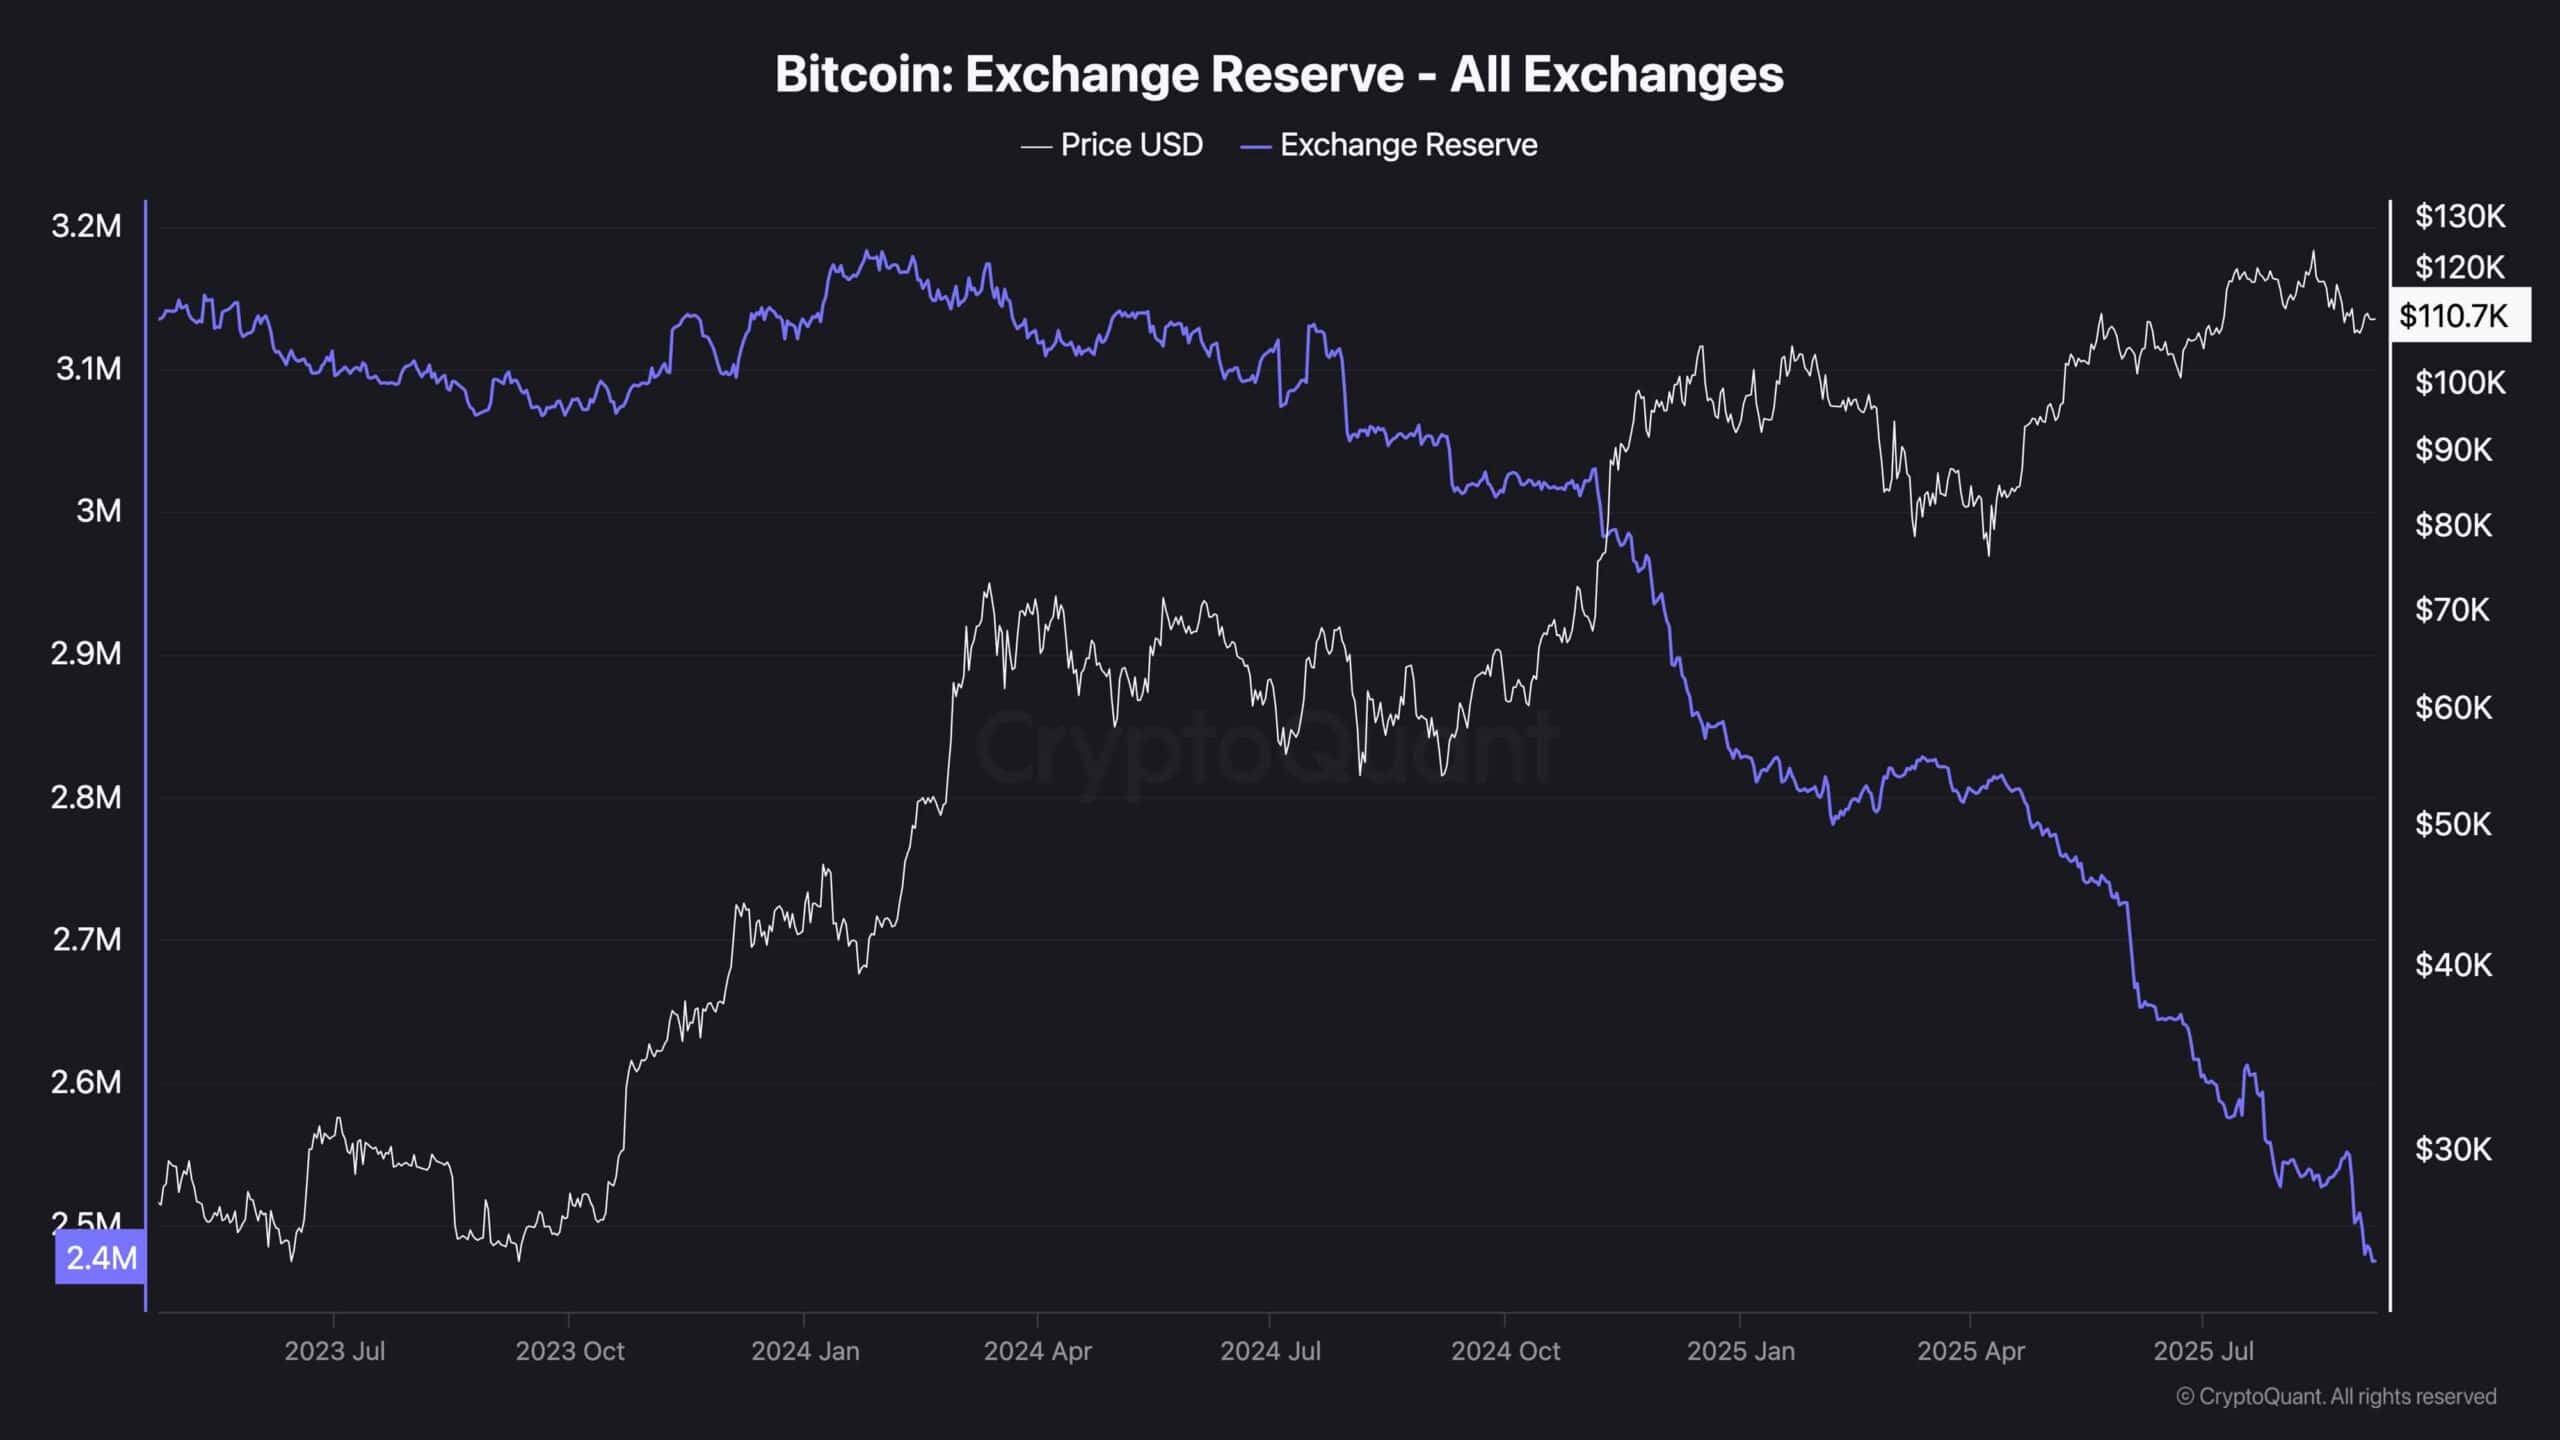
Exchange reserves continue to show a sharp and consistent decline, reaching multi-year lows. This indicates that more Bitcoin is moving off exchanges into cold storage, a clear sign of long-term accumulation and reduced sell-side supply. Historically, such drawdowns in reserves have supported bullish trends, even during corrective phases.
The steady outflow suggests that despite short-term volatility, investor conviction remains high. With fewer coins available on exchanges, the supply shock narrative strengthens, which could support a bullish reversal once demand picks up again.
Disclaimer: The content of this article solely reflects the author's opinion and does not represent the platform in any capacity. This article is not intended to serve as a reference for making investment decisions.
You may also like
2025 TGE Survival Ranking: Who Will Rise to the Top and Who Will Fall? Complete Grading of 30+ New Tokens, AVICI Dominates S+
The article analyzes the TGE performance of multiple blockchain projects, evaluating project performance using three dimensions: current price versus all-time high, time span, and liquidity-to-market cap ratio. Projects are then categorized into five grades: S, A, B, C, and D. Summary generated by Mars AI This summary was generated by the Mars AI model, and the accuracy and completeness of its content are still being iteratively updated.

Mars Finance | "Machi" increases long positions, profits exceed 10 million dollars, whale shorts 1,000 BTC
Russian households have invested 3.7 billion rubles in cryptocurrency derivatives, mainly dominated by a few large players. INTERPOL has listed cryptocurrency fraud as a global threat. Malicious Chrome extensions are stealing Solana funds. The UK has proposed new tax regulations for DeFi. Bitcoin surpasses $91,000. Summary generated by Mars AI. The accuracy and completeness of this summary are still being iteratively updated by the Mars AI model.

How much is ETH really worth? Hashed provides 10 different valuation methods in one go
After taking a weighted average, the fair price of ETH exceeds $4,700.

Dragonfly partner: Crypto has fallen into financial cynicism, and those valuing public blockchains with PE ratios have already lost
People tend to overestimate what can happen in two years, but underestimate what can happen in ten years.
