Bitget App
Trade smarter
Buy cryptoMarketsTradeFuturesEarnSquareMore
Official Melania Meme (MELANIA) To Rise Higher? Key Harmonic Pattern Signals Potential Upside Move

Official Melania Meme (MELANIA) To Rise Higher? Key Harmonic Pattern Signals Potential Upside Move

CoinsProbeCoinsProbe2025/08/26 14:50
By:Nilesh Hembade

Date: Tue, Aug 26, 2025 | 06:40 AM GMT

The cryptocurrency market is under sharp volatility as Bitcoin (BTC) retraced to $110K from its recent high of $117K, while Ethereum (ETH) slipped 5% today to $4,400. This broader weakness has weighed on most altcoins and memecoins .

However, Official Melania Meme (MELANIA) is showing resilience with a 6% jump, and its chart is now flashing a promising signal: a key harmonic pattern that could set the stage for more upside.

Official Melania Meme (MELANIA) To Rise Higher? Key Harmonic Pattern Signals Potential Upside Move image 0 Source: Coinmarketcap

Harmonic Pattern Hints at Potential Upside

On the daily chart, MELANIA is currently forming a Bearish Cypher harmonic pattern. Despite the name, this setup often unfolds with a bullish rally in the CD leg, before the price eventually approaches its Potential Reversal Zone (PRZ).

The structure began at Point X near $0.2873, slid down to Point A, rebounded toward Point B, and then corrected sharply to Point C near $0.1819. From that low, MELANIA has bounced back and is now trading around $0.1979, moving closer to retesting its 50-day moving average at $0.2187 — a crucial resistance level to watch.

Official Melania Meme (MELANIA) To Rise Higher? Key Harmonic Pattern Signals Potential Upside Move image 1 
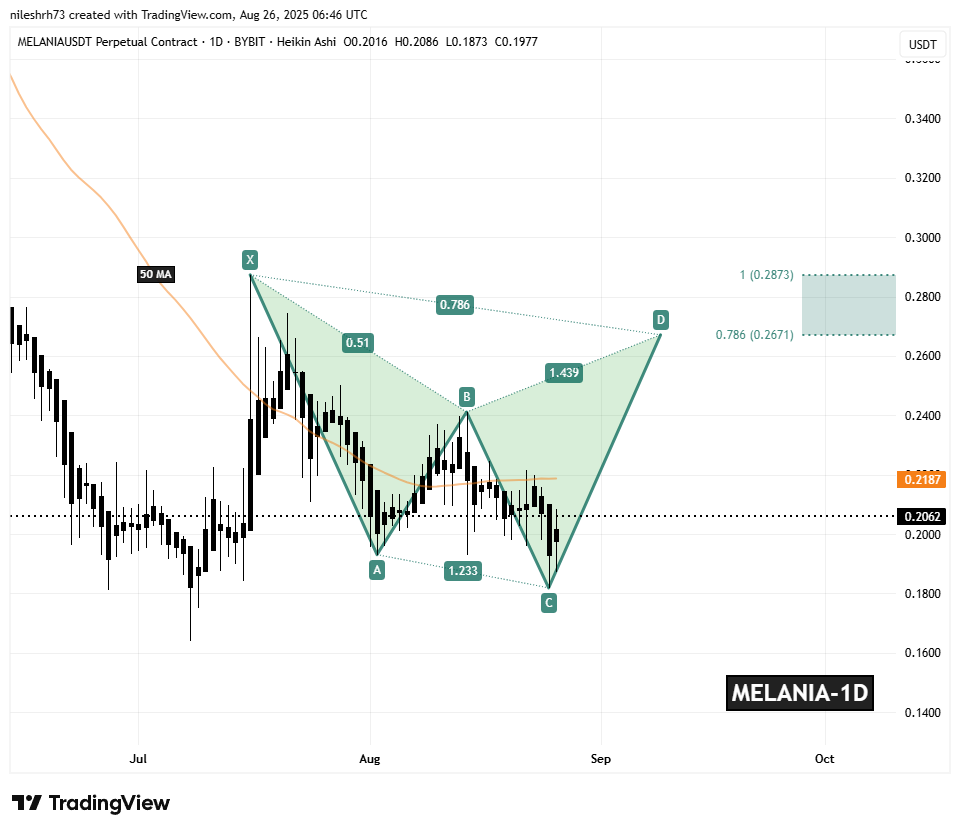
MELANIA Daily Chart/Coinsprobe (Source: Tradingview)

According to harmonic principles, the CD leg of this formation could carry MELANIA into the PRZ between $0.2671 and $0.2873, aligning with the 0.786 and 1.0 Fibonacci extensions. A move into this zone would mark a potential 38% gain from current levels.

What’s Next for MELANIA?

For this bullish scenario to stay valid, MELANIA must break and hold above the 50-day MA at $0.2187 with strong volume. If confirmed, this breakout could open the door to an extended rally toward the $0.2873 zone.

0
0

Disclaimer: The content of this article solely reflects the author's opinion and does not represent the platform in any capacity. This article is not intended to serve as a reference for making investment decisions.

PoolX: Earn new token airdrops
Lock your assets and earn 10%+ APR
Lock now!

You may also like

The $150,000 Collective Illusion: Why Did All Mainstream Institutions Misjudge Bitcoin in 2025?

There is a significant discrepancy between the expected and actual performance of the bitcoin market in 2025. Institutional forecasts have collectively missed the mark, mainly due to incorrect assessments of ETF inflows, the halving cycle effect, and the impact of Federal Reserve policies. Summary generated by Mars AI. The accuracy and completeness of this summary are still being iteratively improved by the Mars AI model.

MarsBit2025/12/15 21:11
The $150,000 Collective Illusion: Why Did All Mainstream Institutions Misjudge Bitcoin in 2025?

Aster launches Shield Mode: a high-performance trading protection mode designed for on-chain traders

This trading feature, as an innovative protection mode, is dedicated to integrating the full 1001x leveraged trading experience into a faster, safer, and more flexible on-chain trading environment.

深潮2025/12/15 19:56
Aster launches Shield Mode: a high-performance trading protection mode designed for on-chain traders

Crypto industry leaders gather in Abu Dhabi, calling the UAE the "new Wall Street of crypto"

Banding together during the bear market to embrace major investors!

深潮2025/12/15 19:56
© 2025 Bitget