Solana’s Double Top Pattern Warns of Sharp Decline as Holder Activity Drops

Solana’s short- and mid-term holders are exiting quickly. With SOPR weakening and a bearish pattern forming, $161 may soon be tested.
Solana has wiped out nearly all its three-month gains. The weekly chart shows a 10% decline, with a 6.2% fall in the past month, raising doubts about whether Solana’s altcoin rally is fading or about to weaken further.
Despite its history of sharp spikes, recent pattern rejections, and waning holder conviction signal potential deeper losses ahead. Here’s what the latest on-chain and chart data reveal.
HODL Waves Shrink, SOPR Signals Weak Conviction
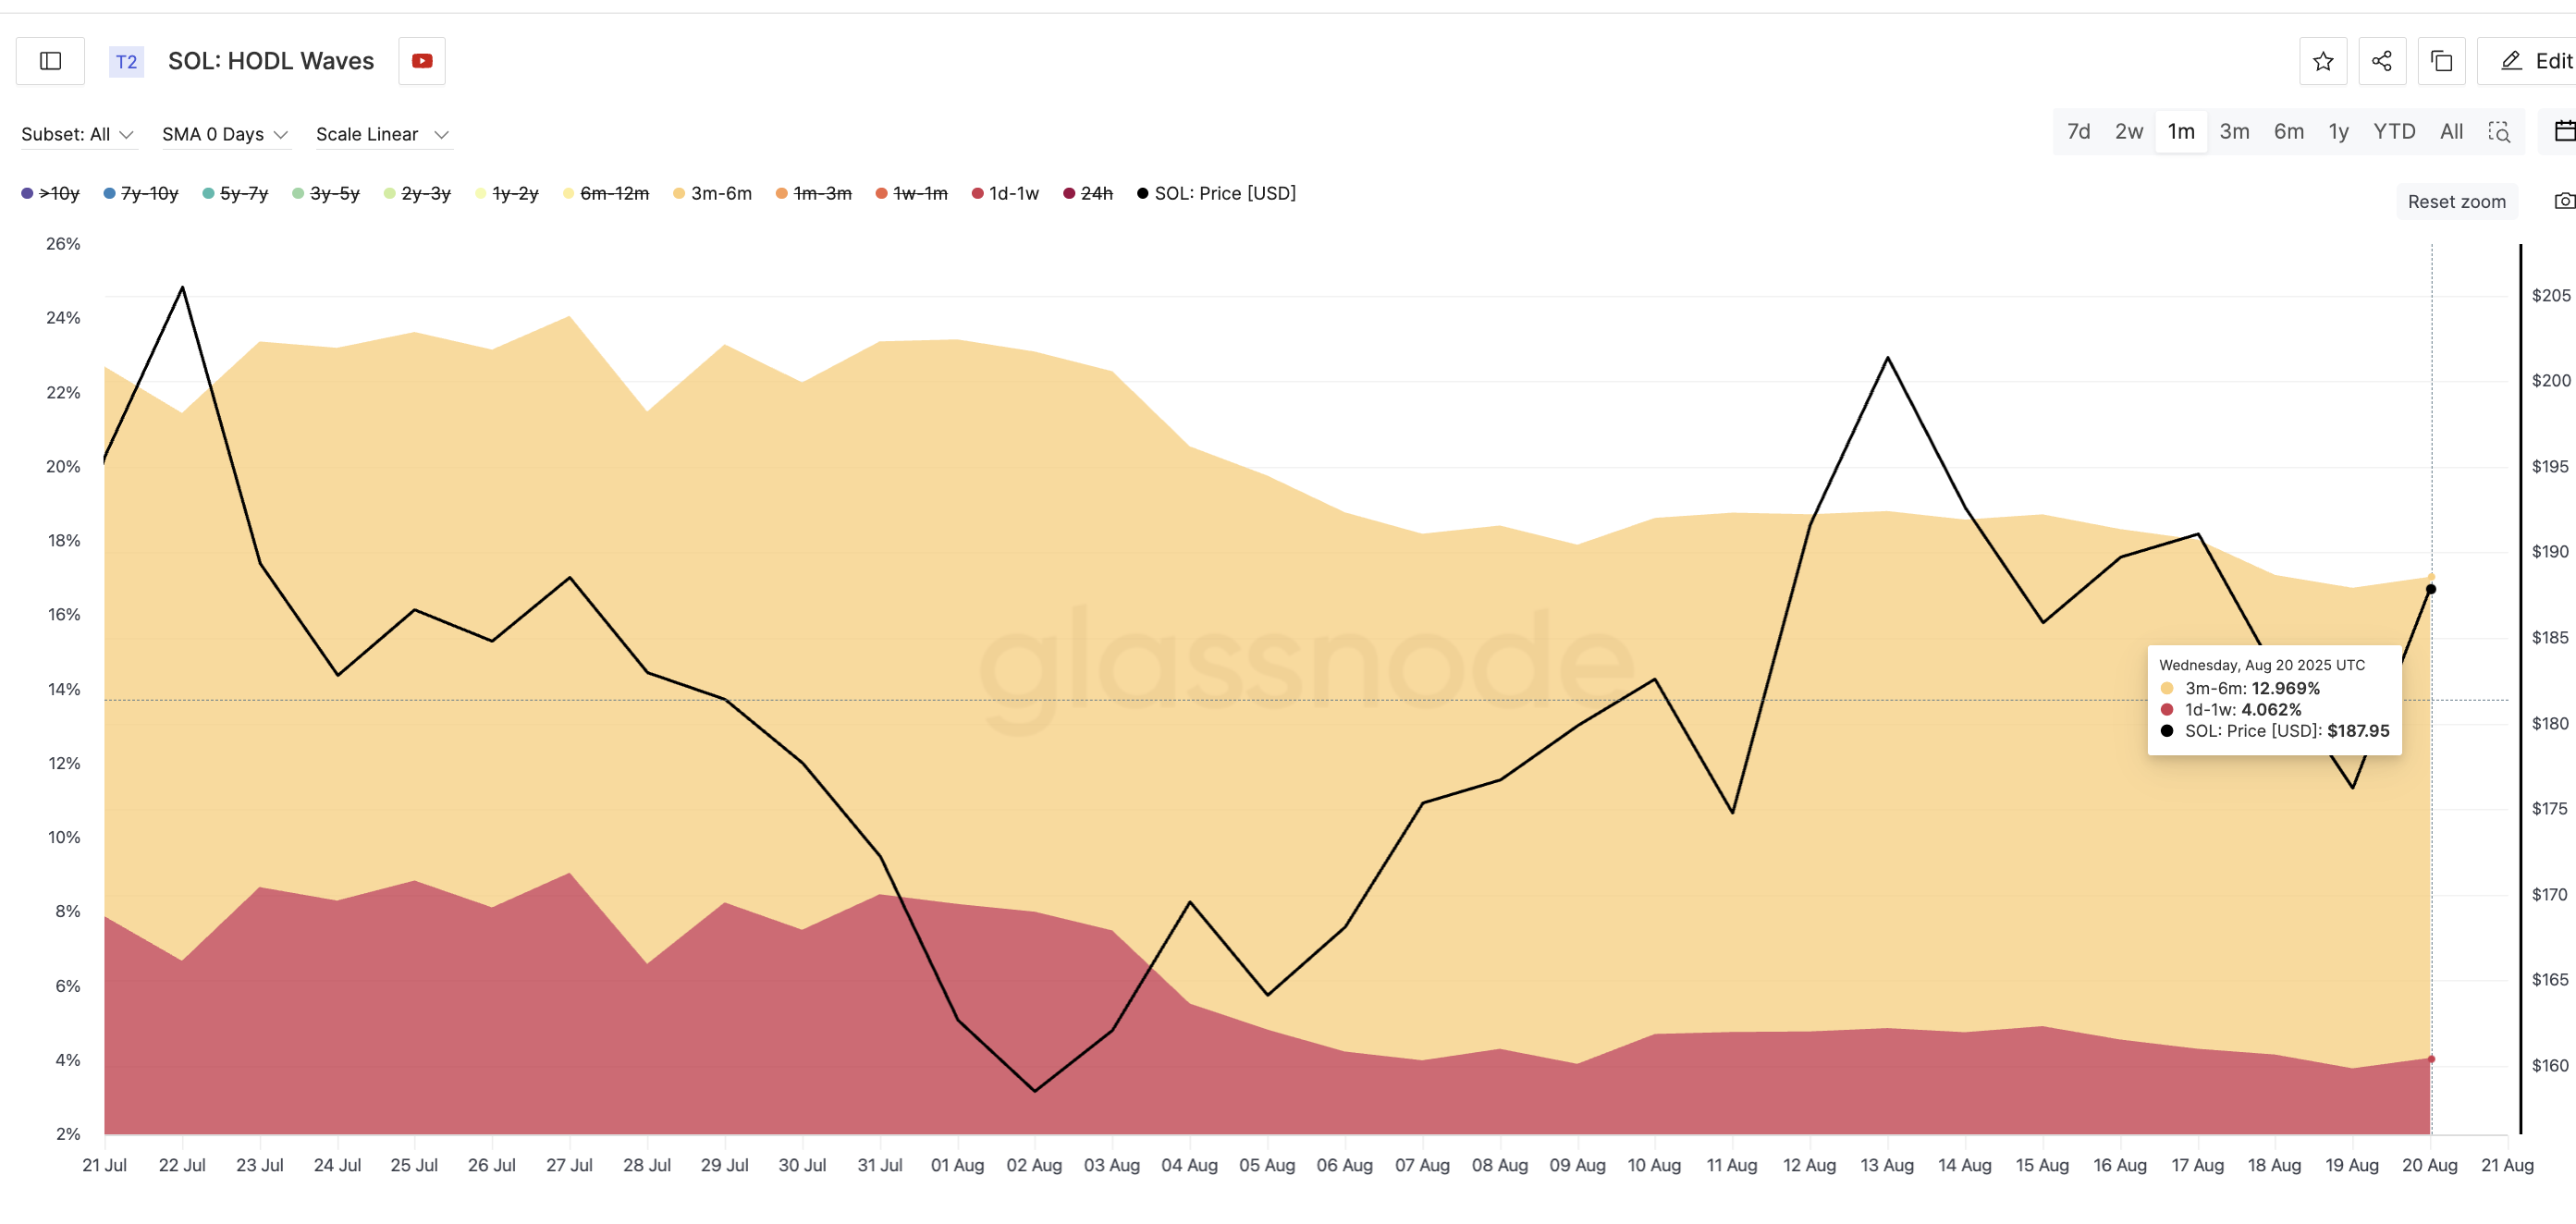
Solana’s 3-month to 6-month cohort—mid-term holders—has dropped from 14.84% on July 21 to 12.96% as of August 20. This shows that wallets that held SOL through a solid portion of the recent rally are now actively exiting positions.
 Solana Holders keep exiting:
Glassnode
Solana Holders keep exiting:
Glassnode
At the same time, short-term holders (1 day to 1 week) have also sharply declined—from 7.87% to just 4.06%. That’s a near 50% drop, showing that even those who jumped in recently aren’t sticking around.
HODL Waves show the distribution of held coins across different time bands, helping identify which age groups (like short-term or mid-term holders) are increasing or decreasing their positions.
For token TA and market updates: Want more token insights like this? Sign up for Editor Harsh Notariya’s Daily Crypto Newsletter
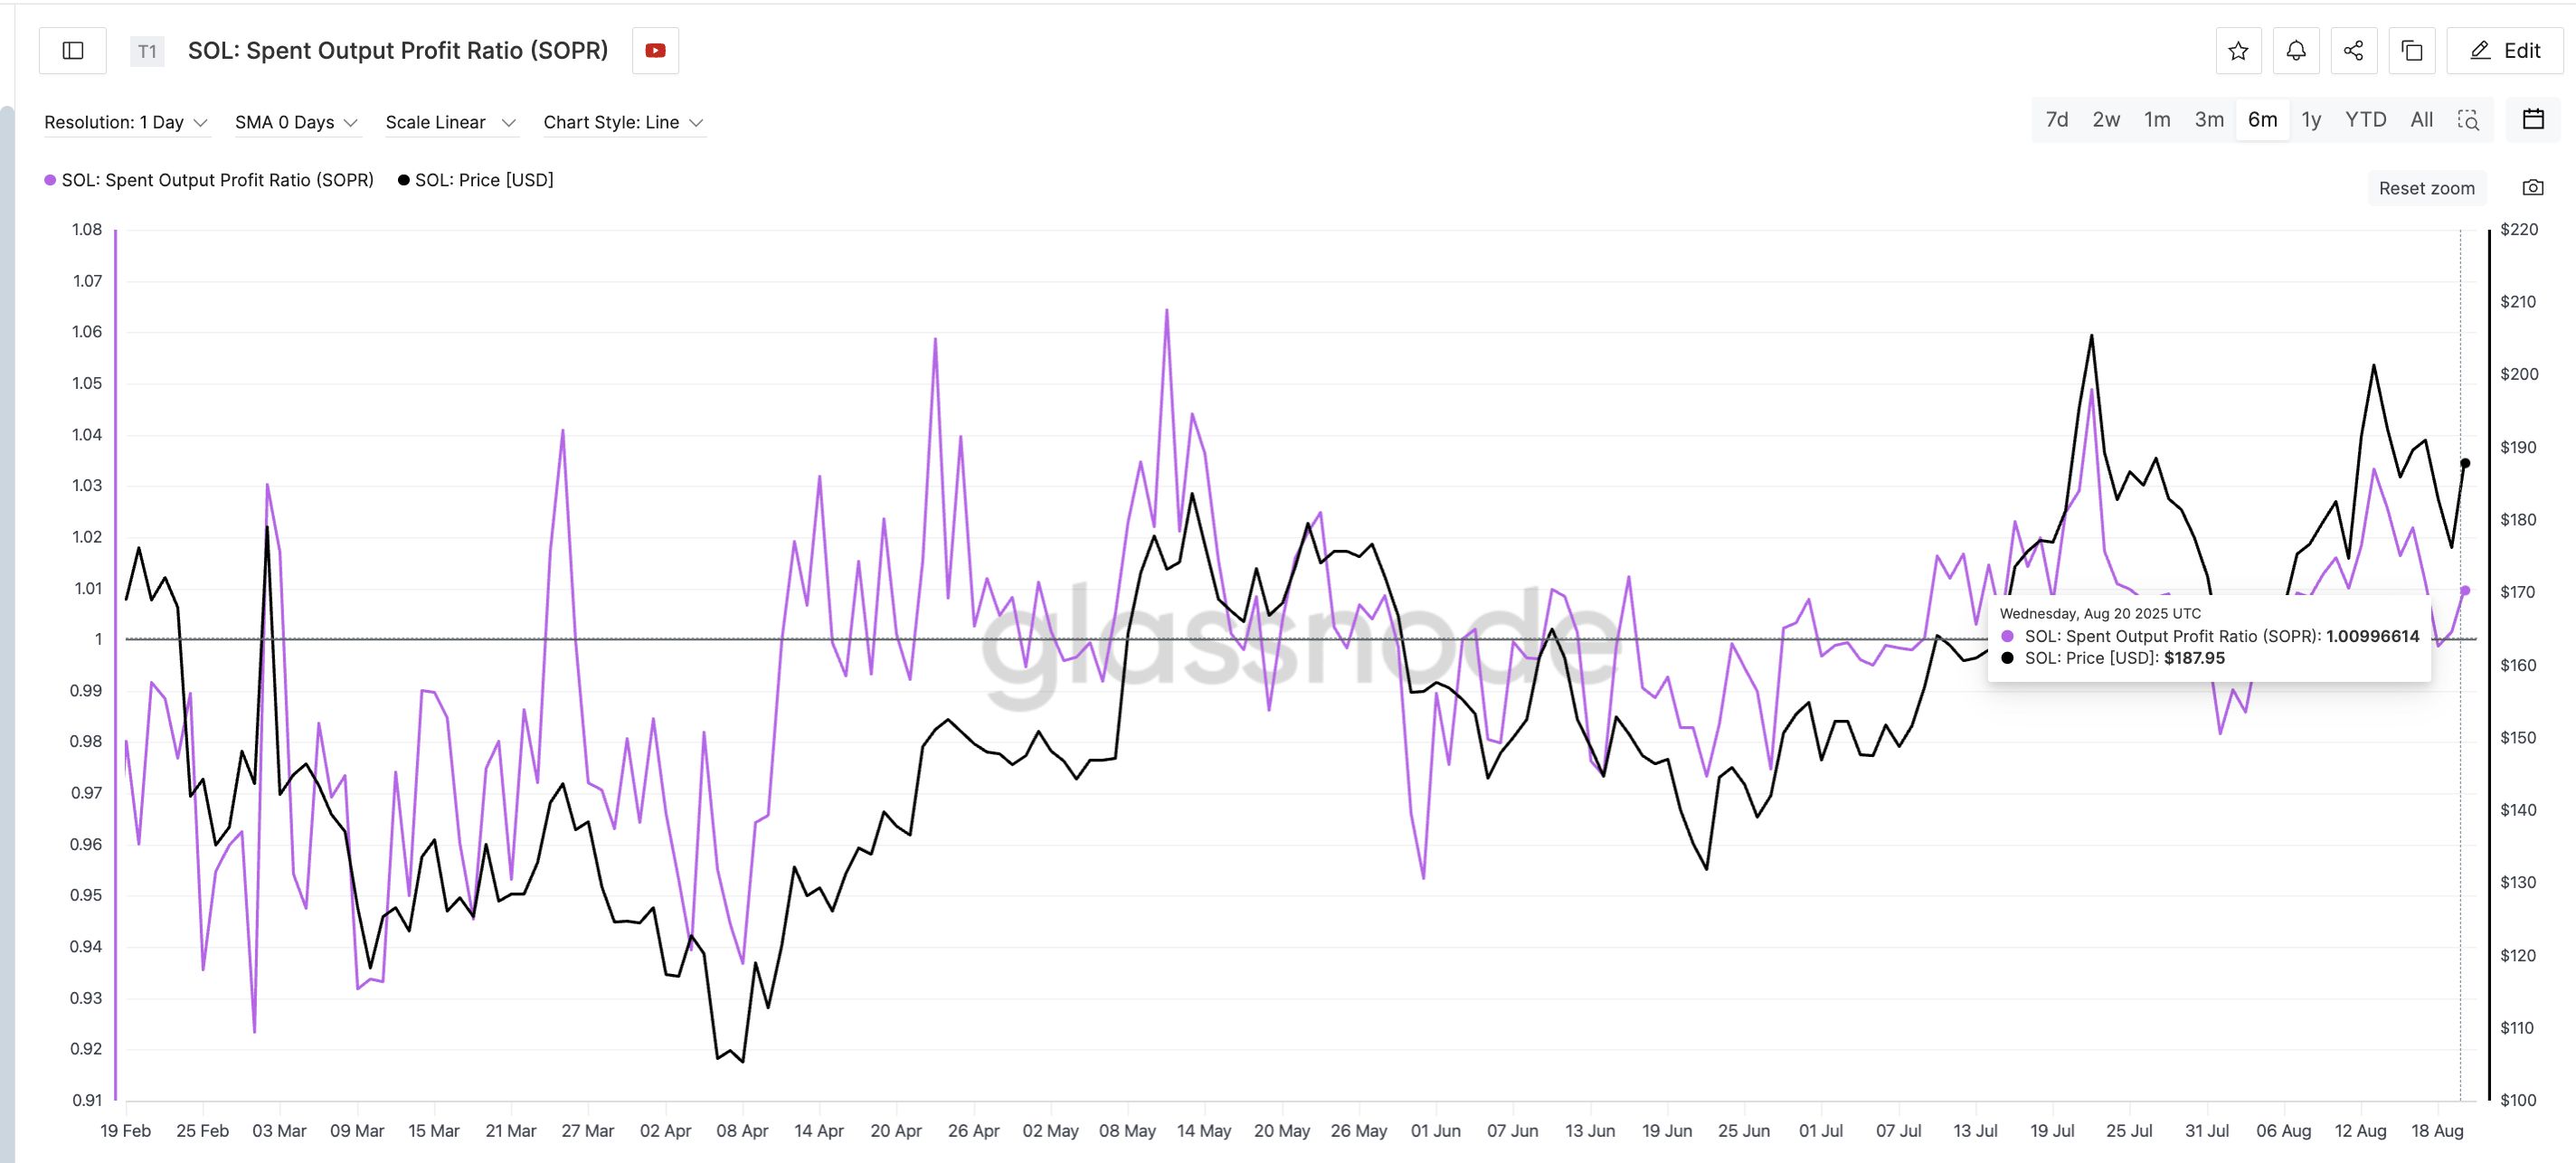
SOPR confirms this weakness. Though it recently bounced from 0.99 to 1.00, it failed to match the previous local peak strength. When the Solana price last hit $201 on August 13, SOPR only touched 1.03, weaker than the 1.04+ levels seen during July’s high.
 Solana profits aren’t attractive anymore:
Glassnode
Solana profits aren’t attractive anymore:
Glassnode
Earlier in the year, SOPR reached 1.05 to 1.06 with even lower prices, suggesting that current sellers either exited with thinner profits or just cut out altogether. It shows conviction is fading fast; even small price upticks trigger exits.
Spent Output Profit Ratio (SOPR) tracks whether coins moved on-chain were sold at a profit or a loss, where values above 1 mean profit-taking and below 1 imply loss realization.
Double Top Solana Price Pattern Spells Trouble: $161 in Sight
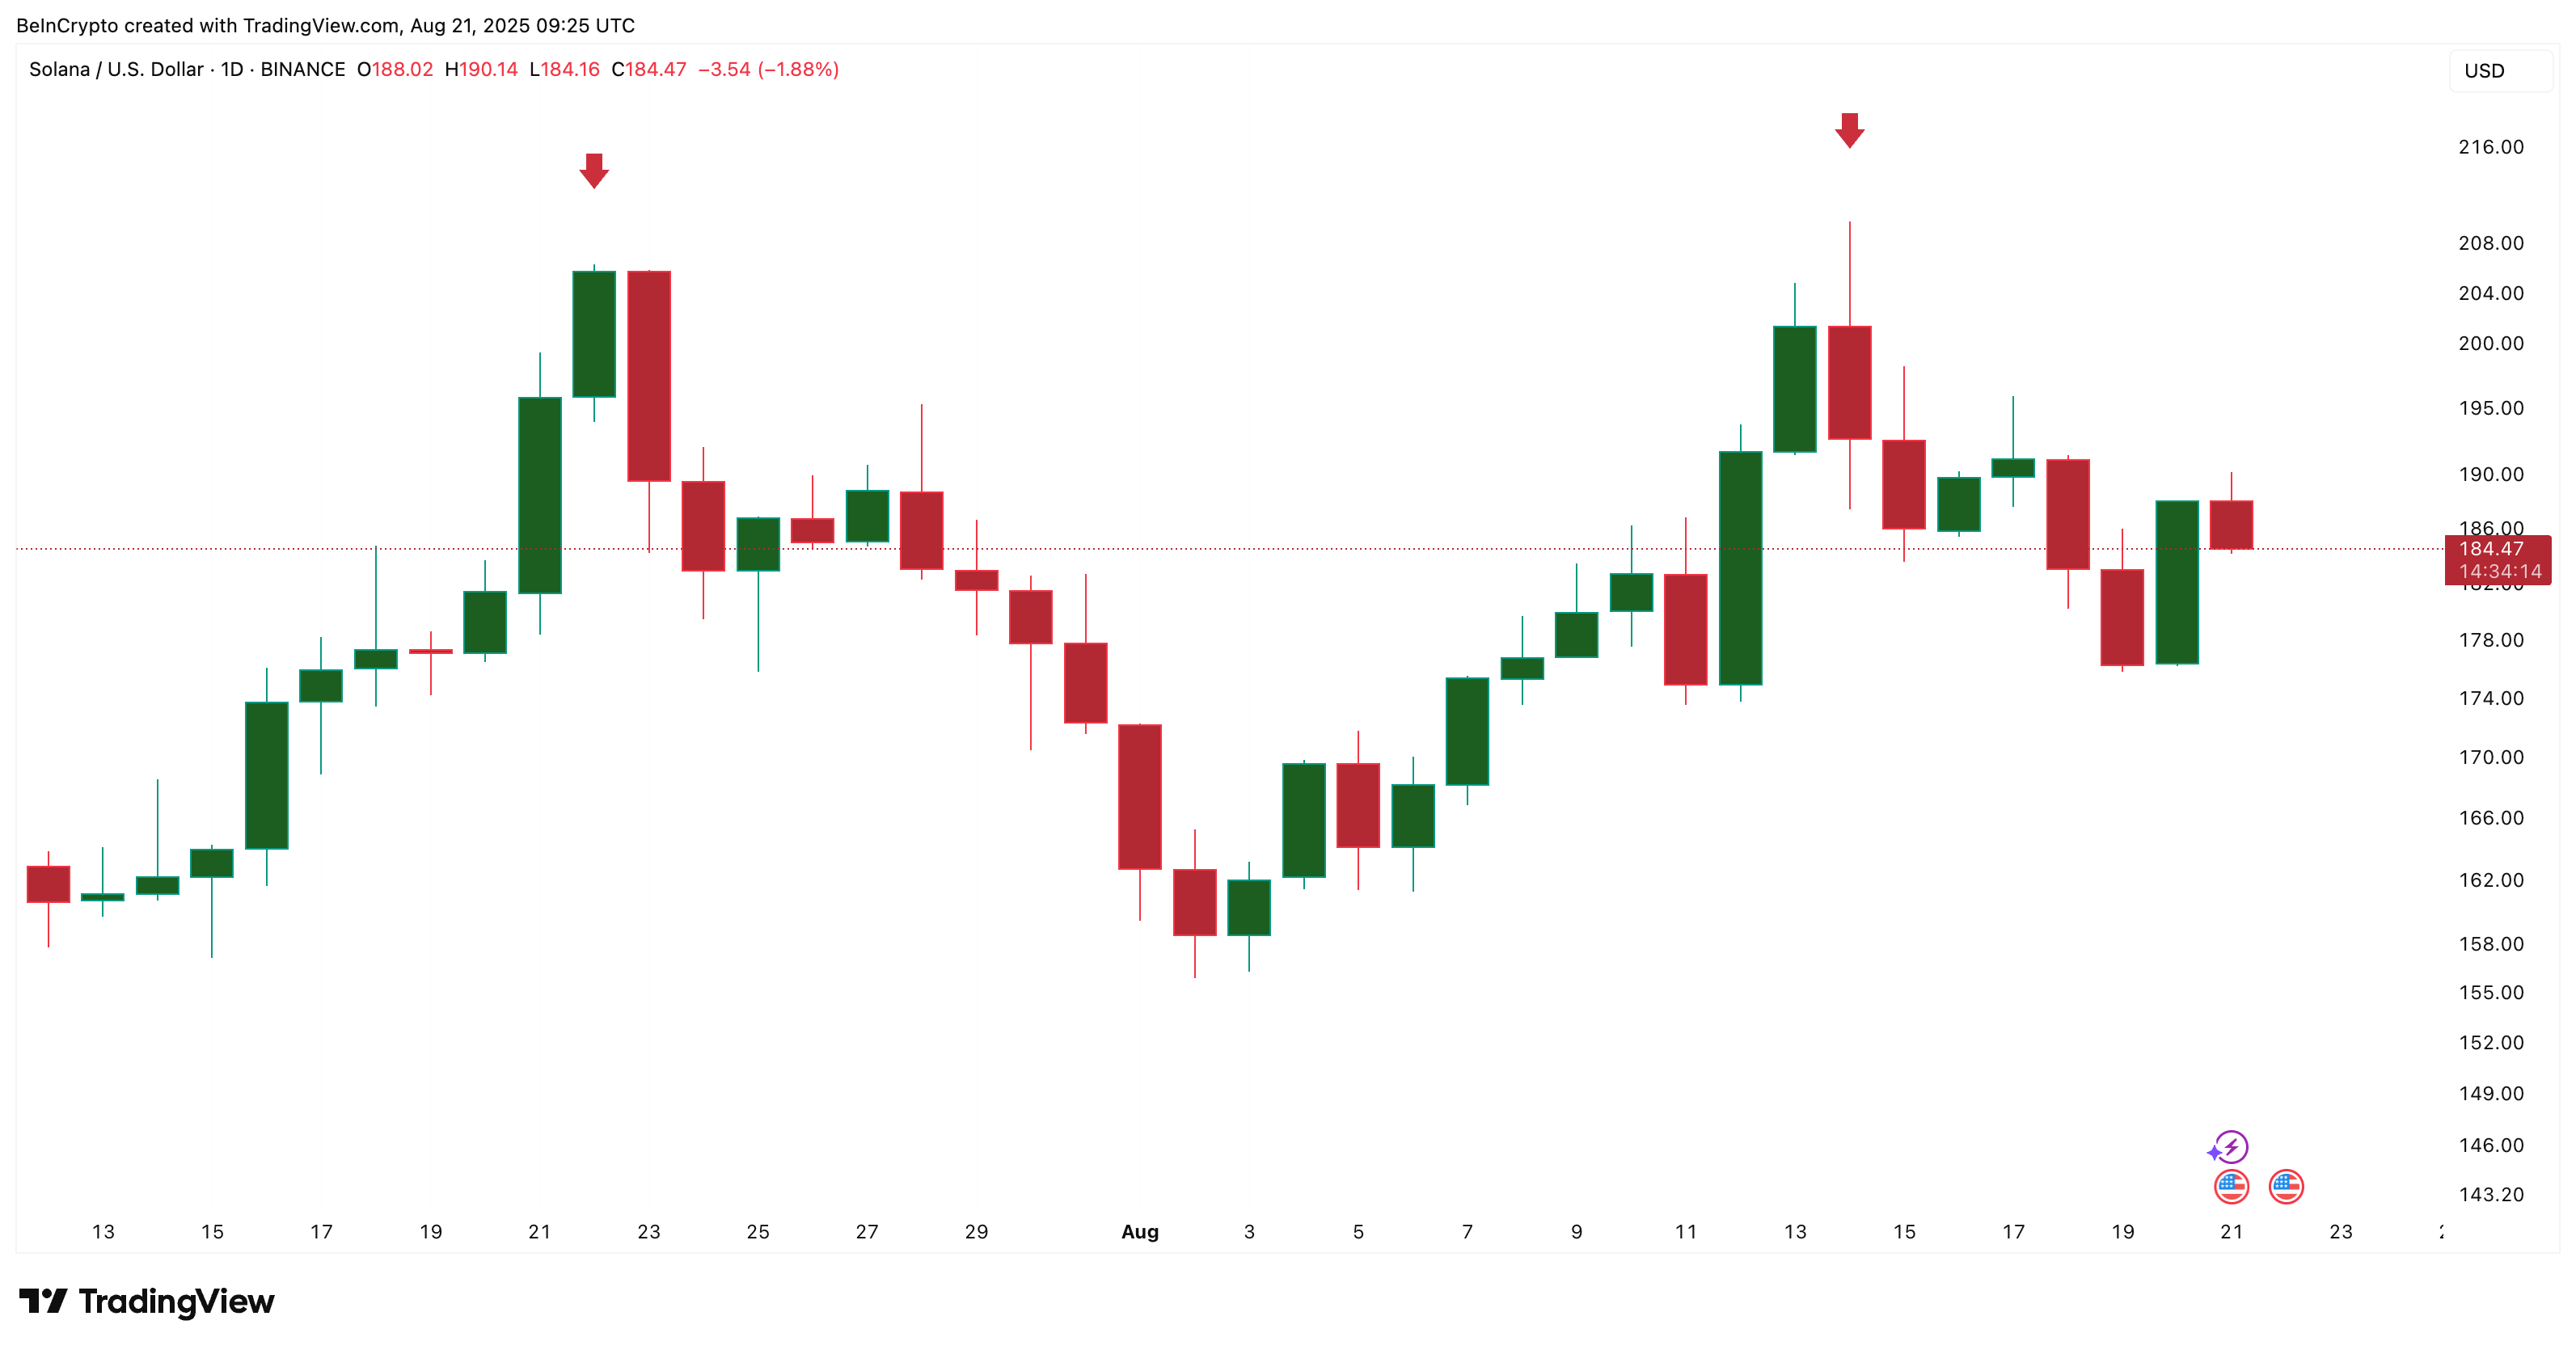
Solana’s price chart is flashing a clean double top. The first peak was $206 on July 21, followed by a slightly higher second peak at $209 on August 14. Despite the higher high, the market rejected both levels strongly; classic double top behavior.
 Solana price pattern (bearish):
TradingView
Solana price pattern (bearish):
TradingView
This is a bearish pattern that often signals further downside.
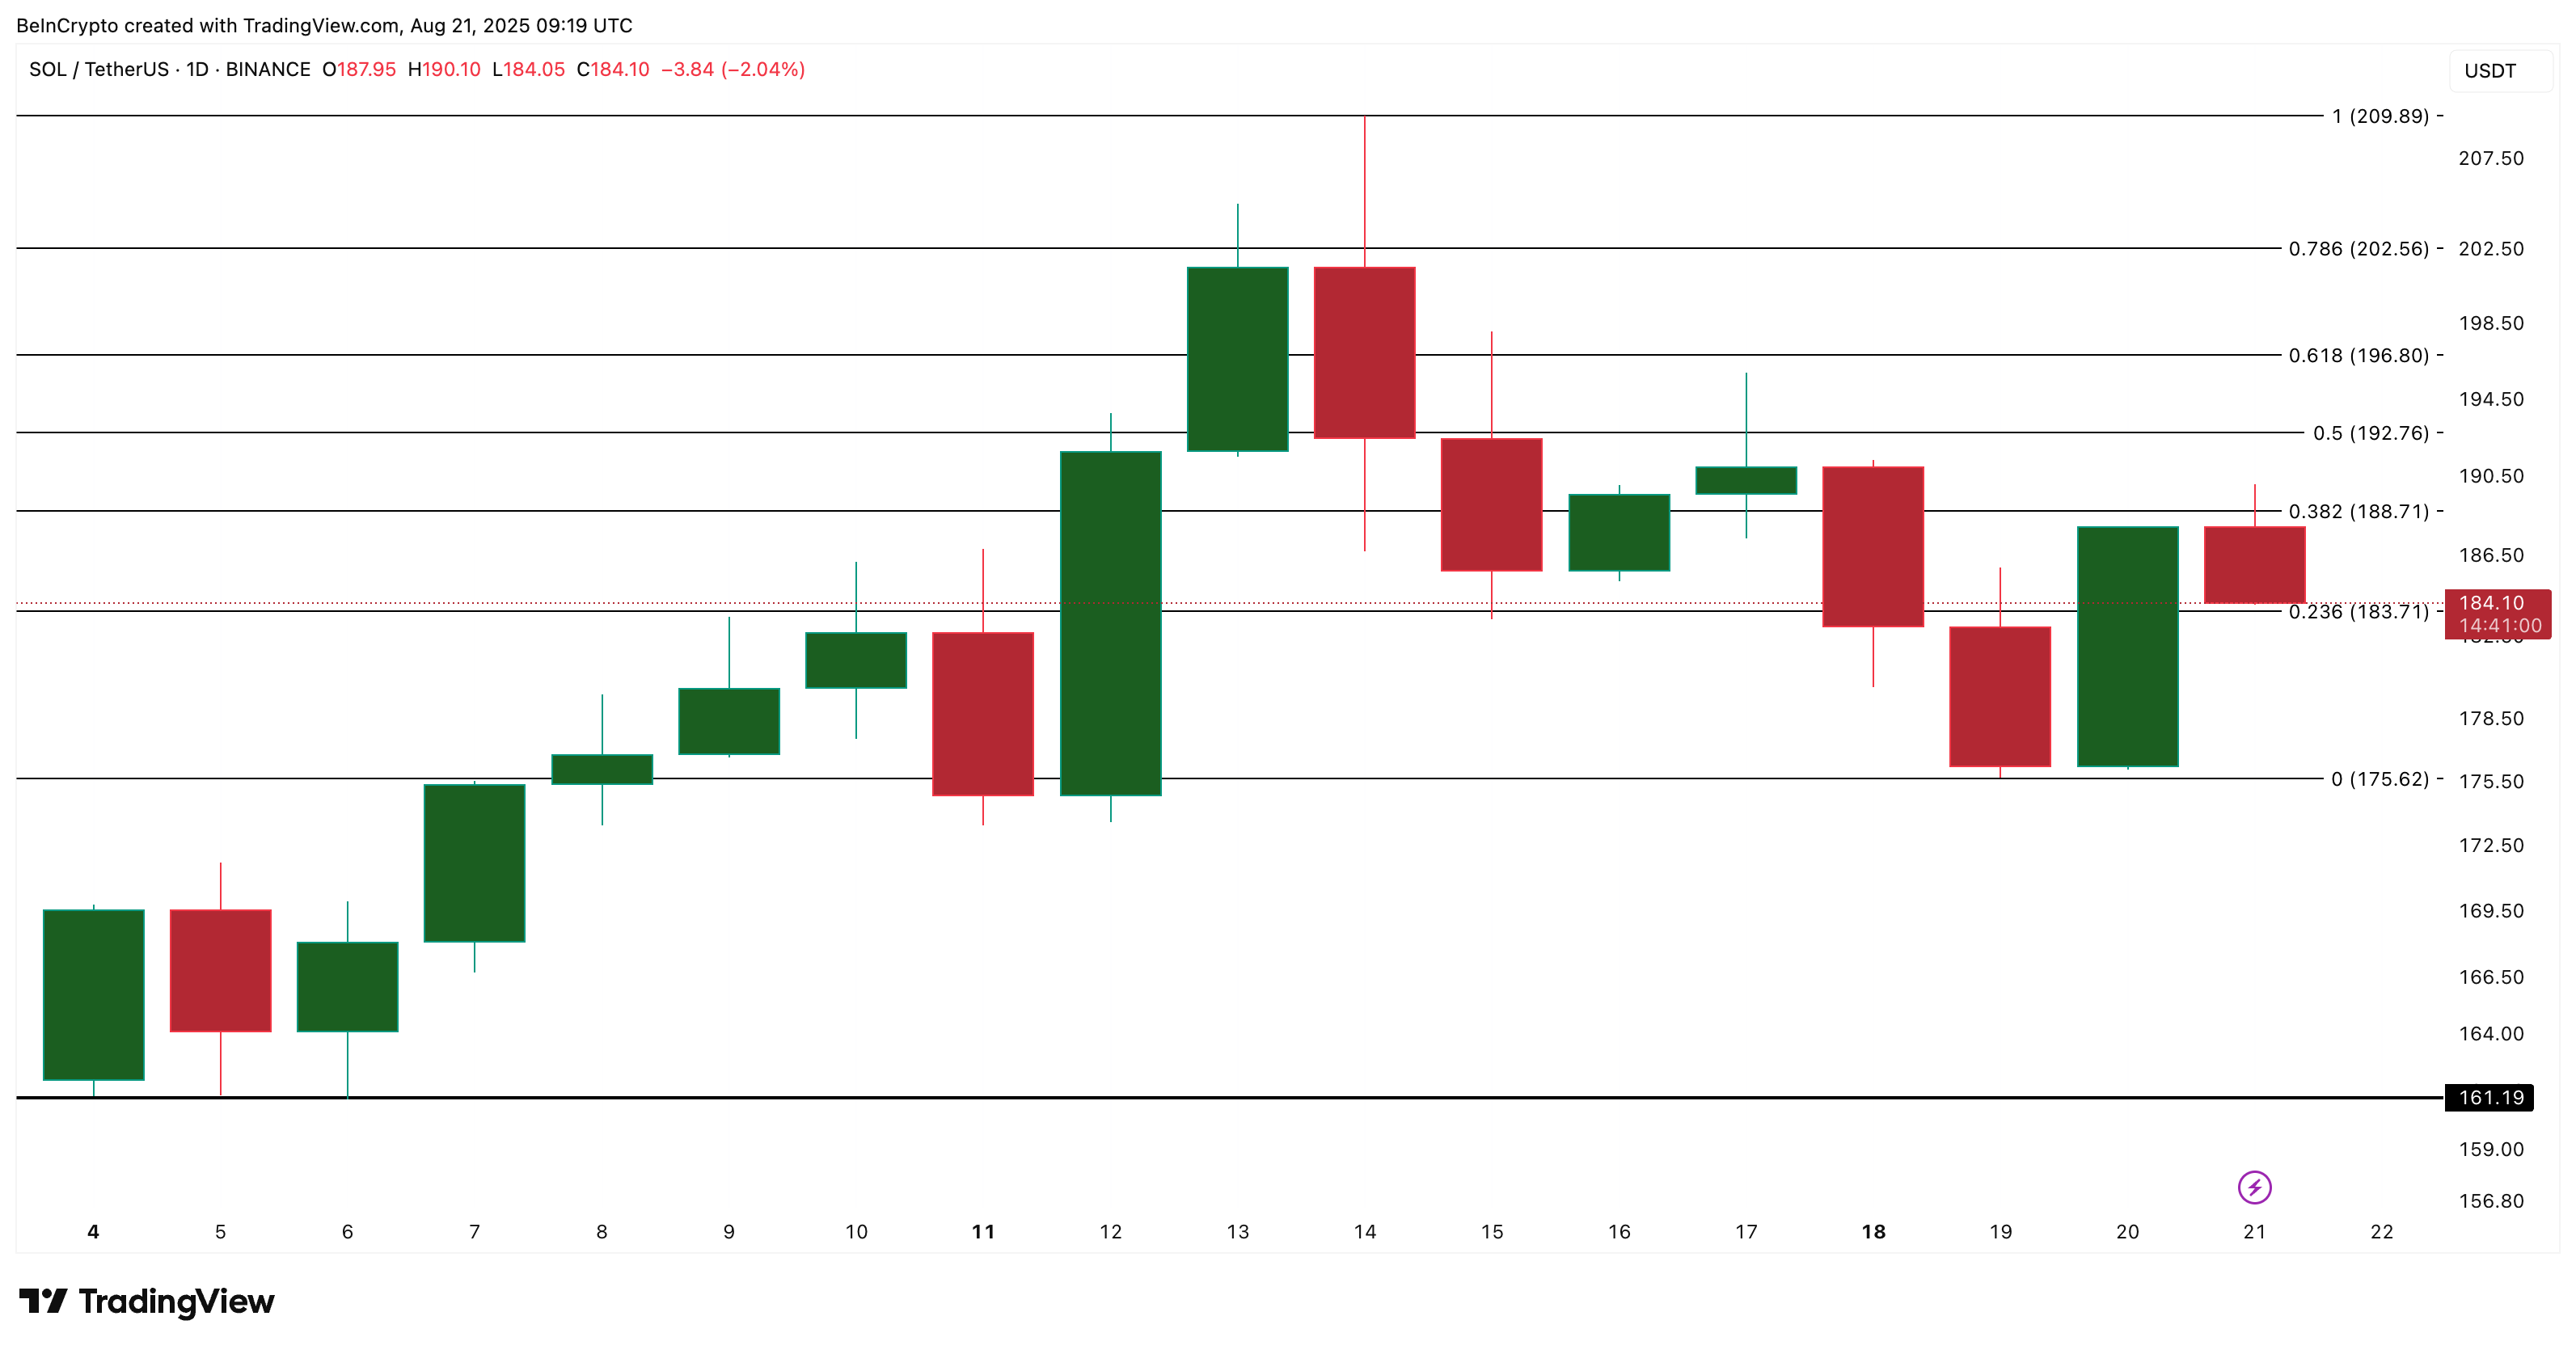
Using Fibonacci retracement from the swing high of $209 to the recent low of $175, Solana’s price structure shows key levels:
- $183 remains crucial support. A breakdown below this increases bearish risk.
- If $175 fails again, the next downside target is $161, below which the entire structure would turn bearish, and the Solana price might start downtrending sharply.
- To invalidate the bearish setup, Solana must break above $200+ with a strong candle close.
 Solana price analysis:
TradingView
Solana price analysis:
TradingView
For now, double rejections and selling pressure from both mid-term and short-term holders put downside at the forefront.
Disclaimer: The content of this article solely reflects the author's opinion and does not represent the platform in any capacity. This article is not intended to serve as a reference for making investment decisions.
You may also like
On the night of the Federal Reserve rate cut, the real game is Trump’s “monetary power grab”
The article discusses the upcoming Federal Reserve interest rate cut decision and its impact on the market, with a focus on the Fed’s potential relaunch of liquidity injection programs. It also analyzes the Trump administration’s restructuring of the Federal Reserve’s powers and how these changes affect the crypto market, ETF capital flows, and institutional investor behavior. Summary generated by Mars AI. This summary was produced by the Mars AI model, and the accuracy and completeness of the generated content are still being iteratively updated.

When the Federal Reserve is politically hijacked, is the next bitcoin bull market coming?
The Federal Reserve announced a 25 basis point rate cut and the purchase of $40 billion in Treasury securities, resulting in an unusual market reaction as long-term Treasury yields rose. Investors are concerned about the loss of the Federal Reserve's independence, believing the rate cut is a result of political intervention. This situation has triggered doubts about the credit foundation of the US dollar, and crypto assets such as bitcoin and ethereum are being viewed as tools to hedge against sovereign credit risk. Summary generated by Mars AI. The accuracy and completeness of this summary are still in the process of iterative updates.
x402 V2 Released: As AI Agents Begin to Have "Credit Cards", Which Projects Will Be Revalued?
Still waters run deep, subtly reviving the narrative thread of 402.

When Belief Becomes a Cage: The Sunk Cost Trap in the Crypto Era
You’d better honestly ask yourself: which side are you on? Do you like cryptocurrency?