Bullish HBAR Indicator Surfaces: Will Price Respond with a Pattern Breakout?

HBAR is flashing a rare combination of strong net outflows, high long account dominance, and a hidden bullish RSI divergence. Add a clean ascending triangle into the mix — and all eyes are now on $0.29 as the potential breakout level for August.
The broader crypto market has had a rocky start to August, but the HBAR price has shown signs of resilience. The token is up over 4% in the last 24 hours and holds monthly gains above 60%, with a 3-month performance still up by more than 43%.
Despite the volatility, the broader uptrend remains intact. The key question now is: can HBAR translate its on-chain strength into a technical breakout?
Sustained Outflows Point to Holder Confidence
HBAR has recorded two consecutive weeks of strong negative net flows: –$46.49 million and –$40.85 million. This indicates a clear trend of tokens being pulled off exchanges, typically a bullish sign, reflecting investor confidence and a reduced likelihood of immediate sell pressure.
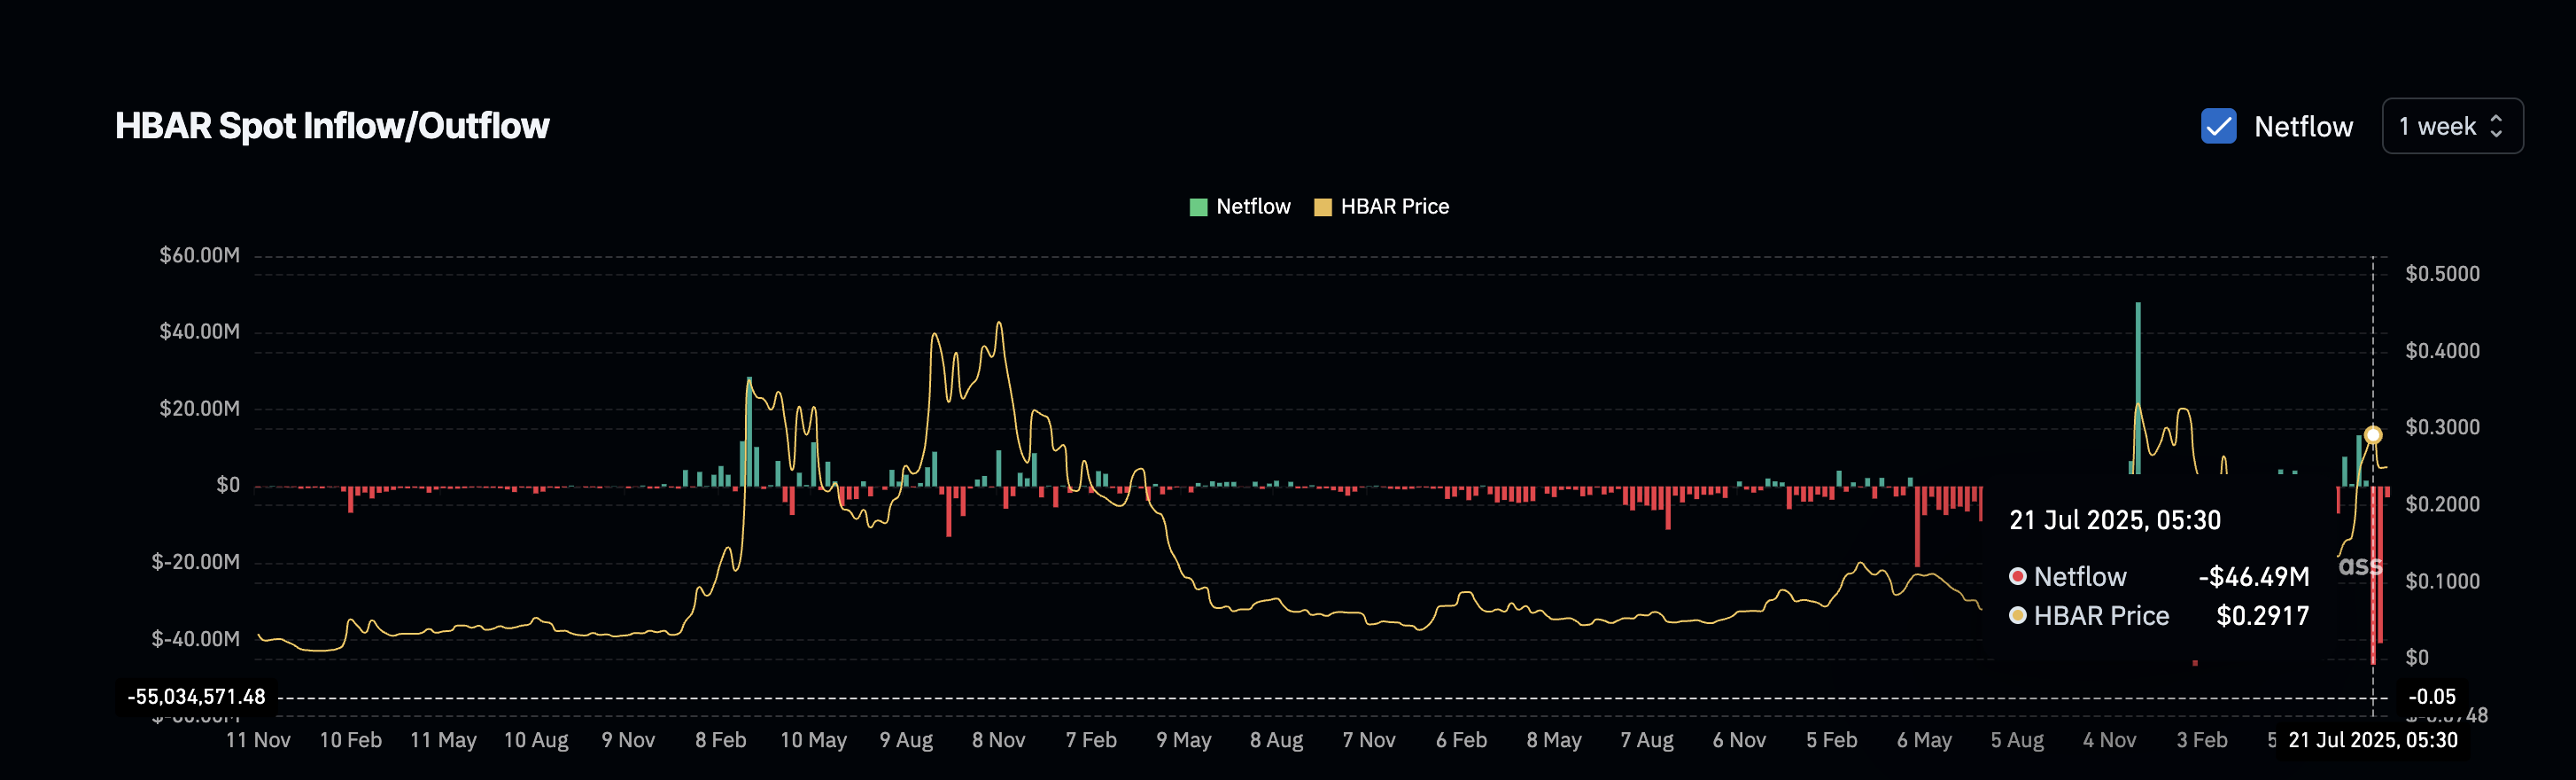 HBAR price and sustained weekly outflows:
Coinglass
HBAR price and sustained weekly outflows:
Coinglass
The new week has just started, and traders should keep an eye on the next set of outflows. A third week of negative netflows would further add weight to the accumulation pattern.
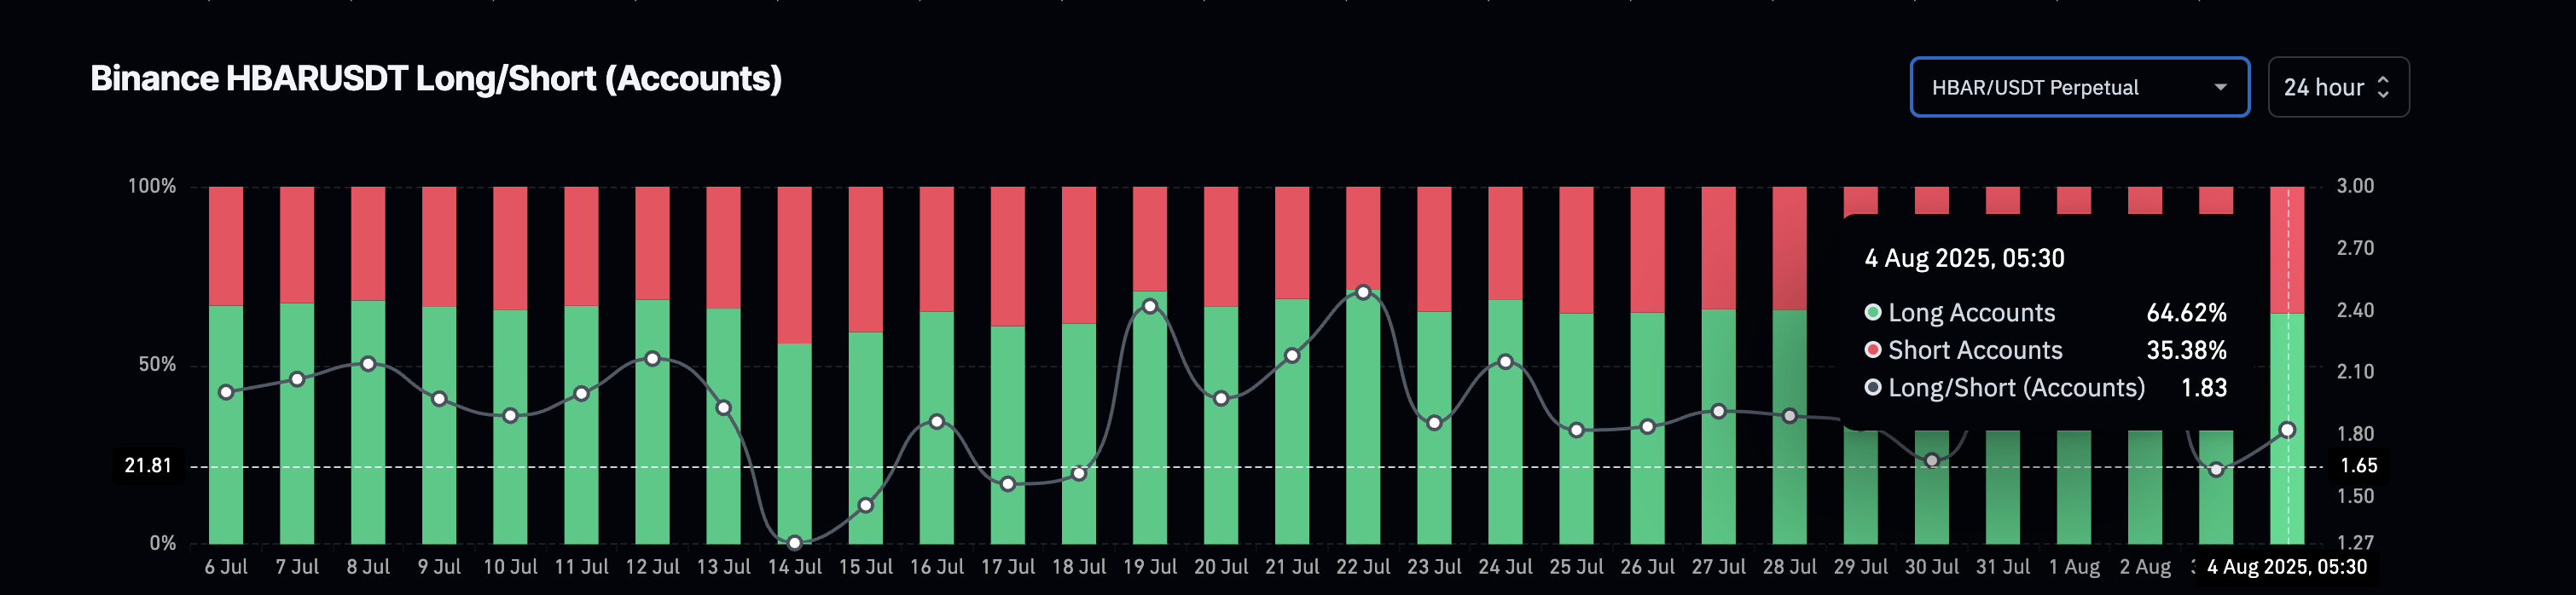 HBAR price and long-short accounts on Binance:
Coinglass
HBAR price and long-short accounts on Binance:
Coinglass
Supporting this is the long-short account ratio from Binance, which sits near 1.83. That means nearly two-thirds of the accounts trading HBAR are positioned long. Unlike long/short volume ratios that track trade sizes, this metric reflects how many traders are betting on price gains. Taken together, the steady outflows and the high long account dominance validate a bullish undercurrent in the market structure.
For token TA and market updates: Want more token insights like this? Sign up for Editor Harsh Notariya’s Daily Crypto Newsletter here.
Short-Term RSI Divergence Suggests Bullish Continuation
To get an early read on momentum, we move to the 4-hour chart, ideal for capturing near-term trend shifts. Between August 1 and August 4, the price formed a marginally lower high ($0.255 to $0.253), but RSI (Relative Strength Index) surged from 42 to 52 over the same period.
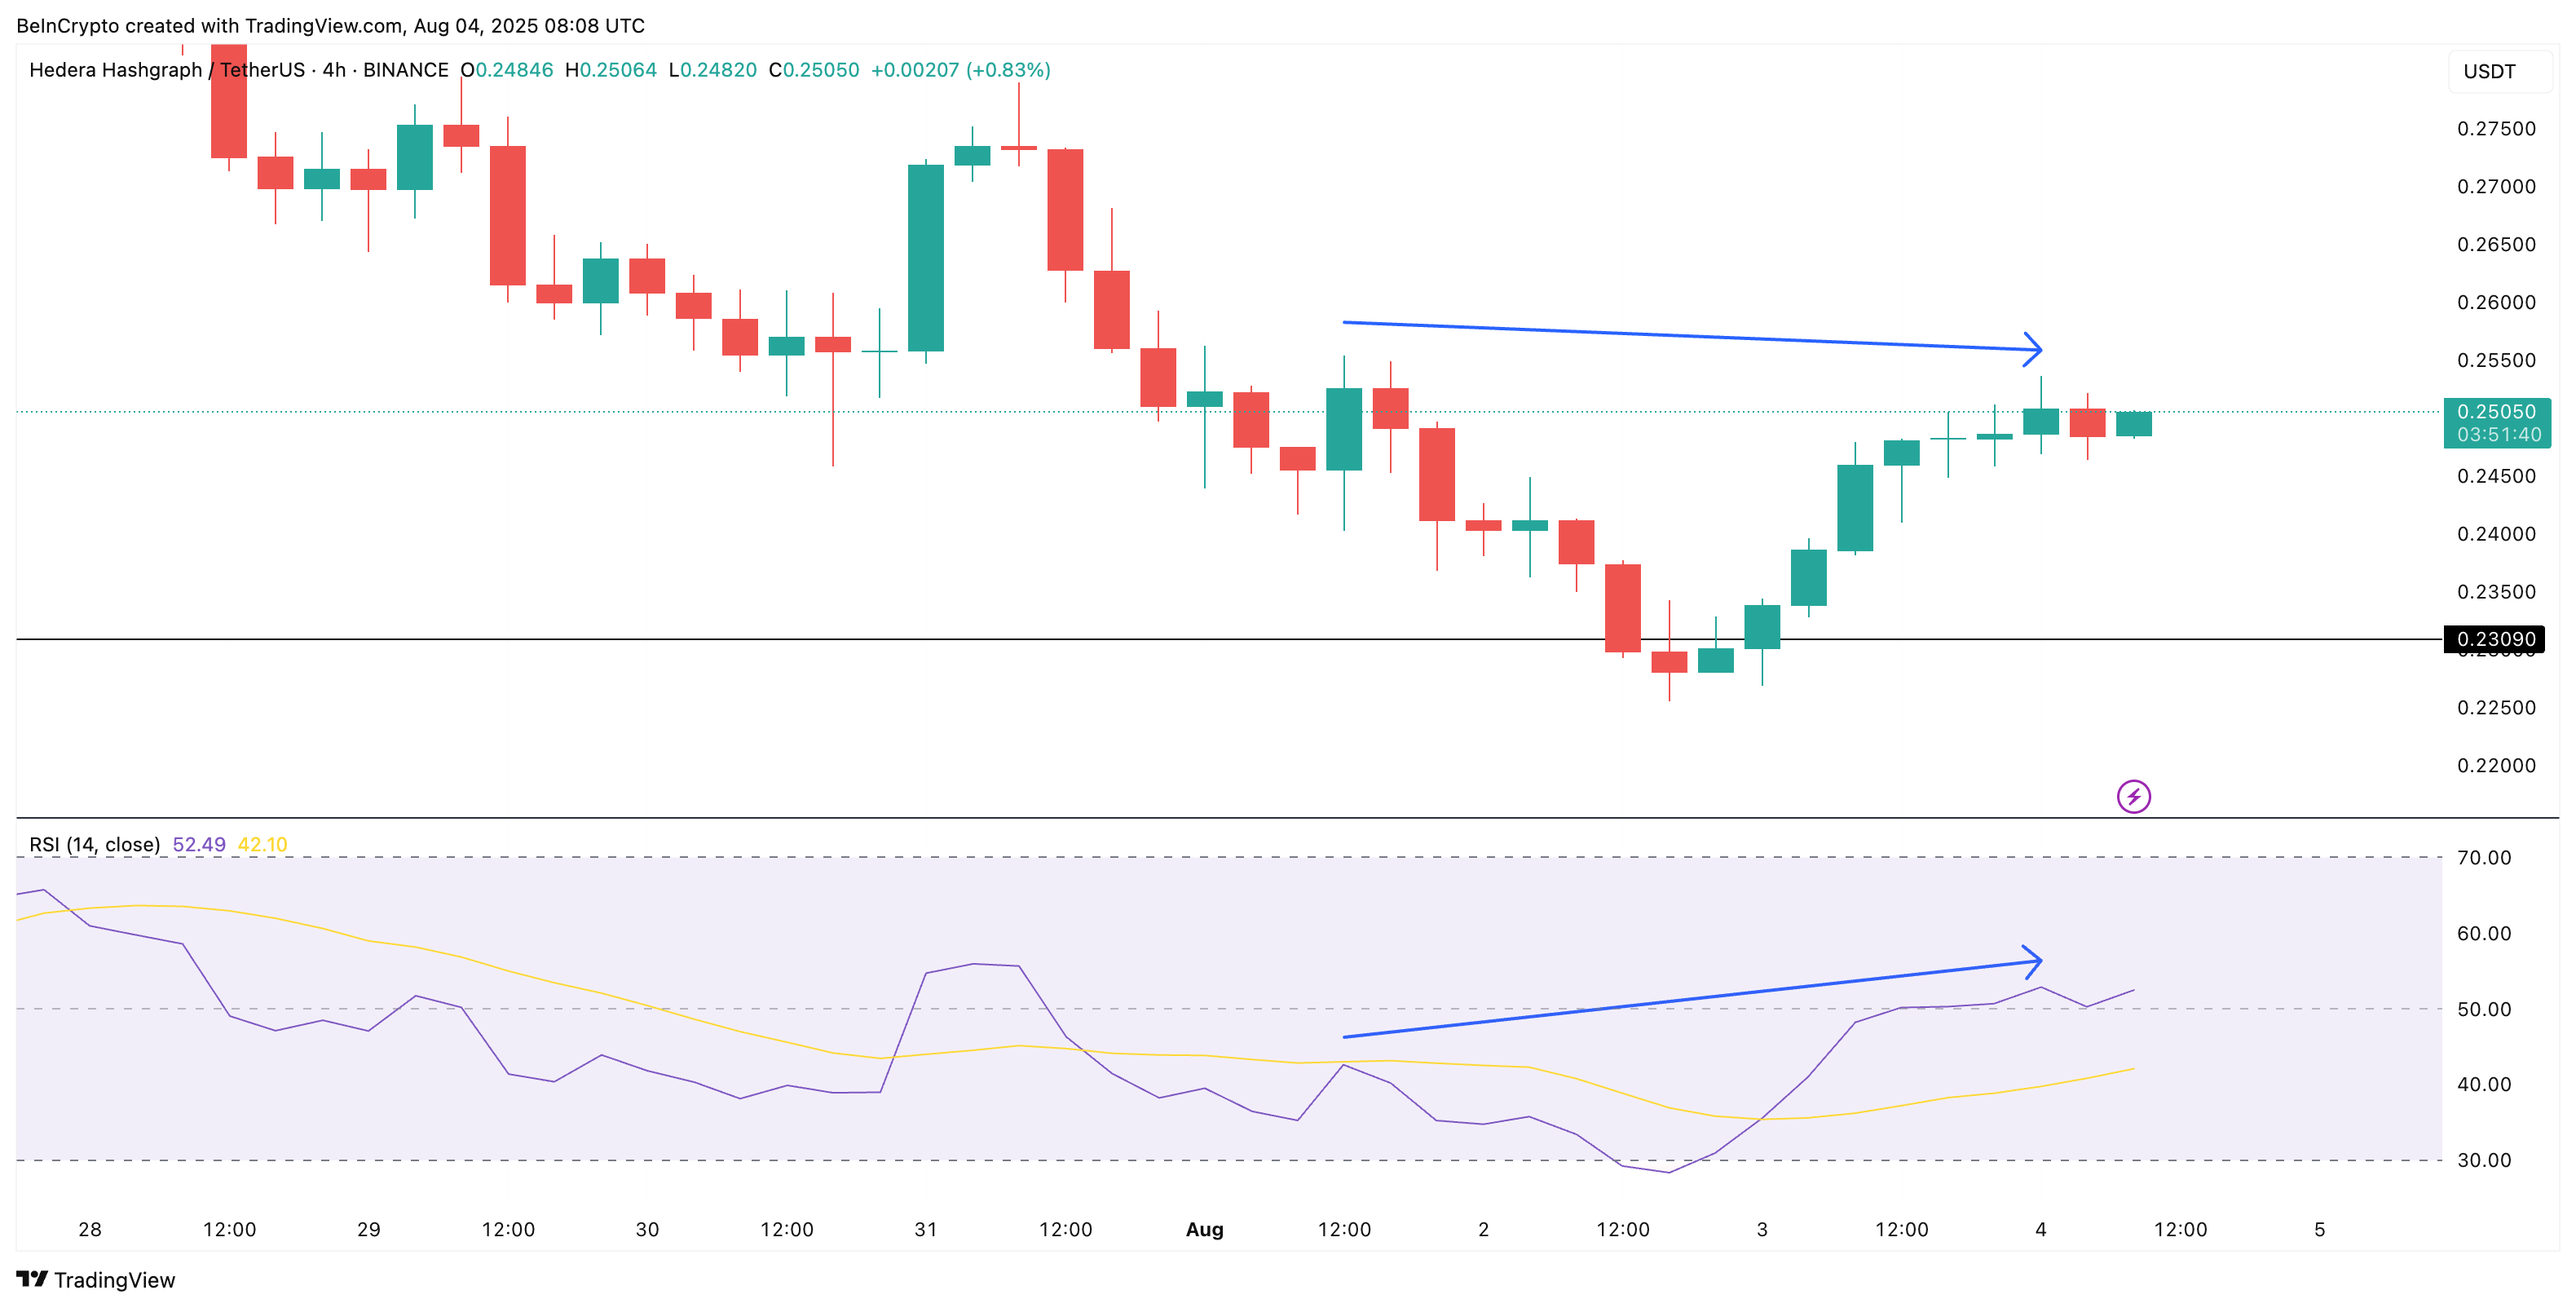 Bullish RSI divergence:
TradingView
Bullish RSI divergence:
TradingView
This is a textbook case of hidden bullish divergence, which signals trend continuation, not reversal, in an uptrend. While not a breakout trigger by itself, it strengthens the case for sustained upward movement when paired with net flow and positioning data.
The Relative Strength Index (RSI) is a momentum oscillator that measures the speed and change of price movements, helping identify overbought or oversold conditions.
The HBAR Price Pattern Breakout Hinges on Key Fibonacci Levels
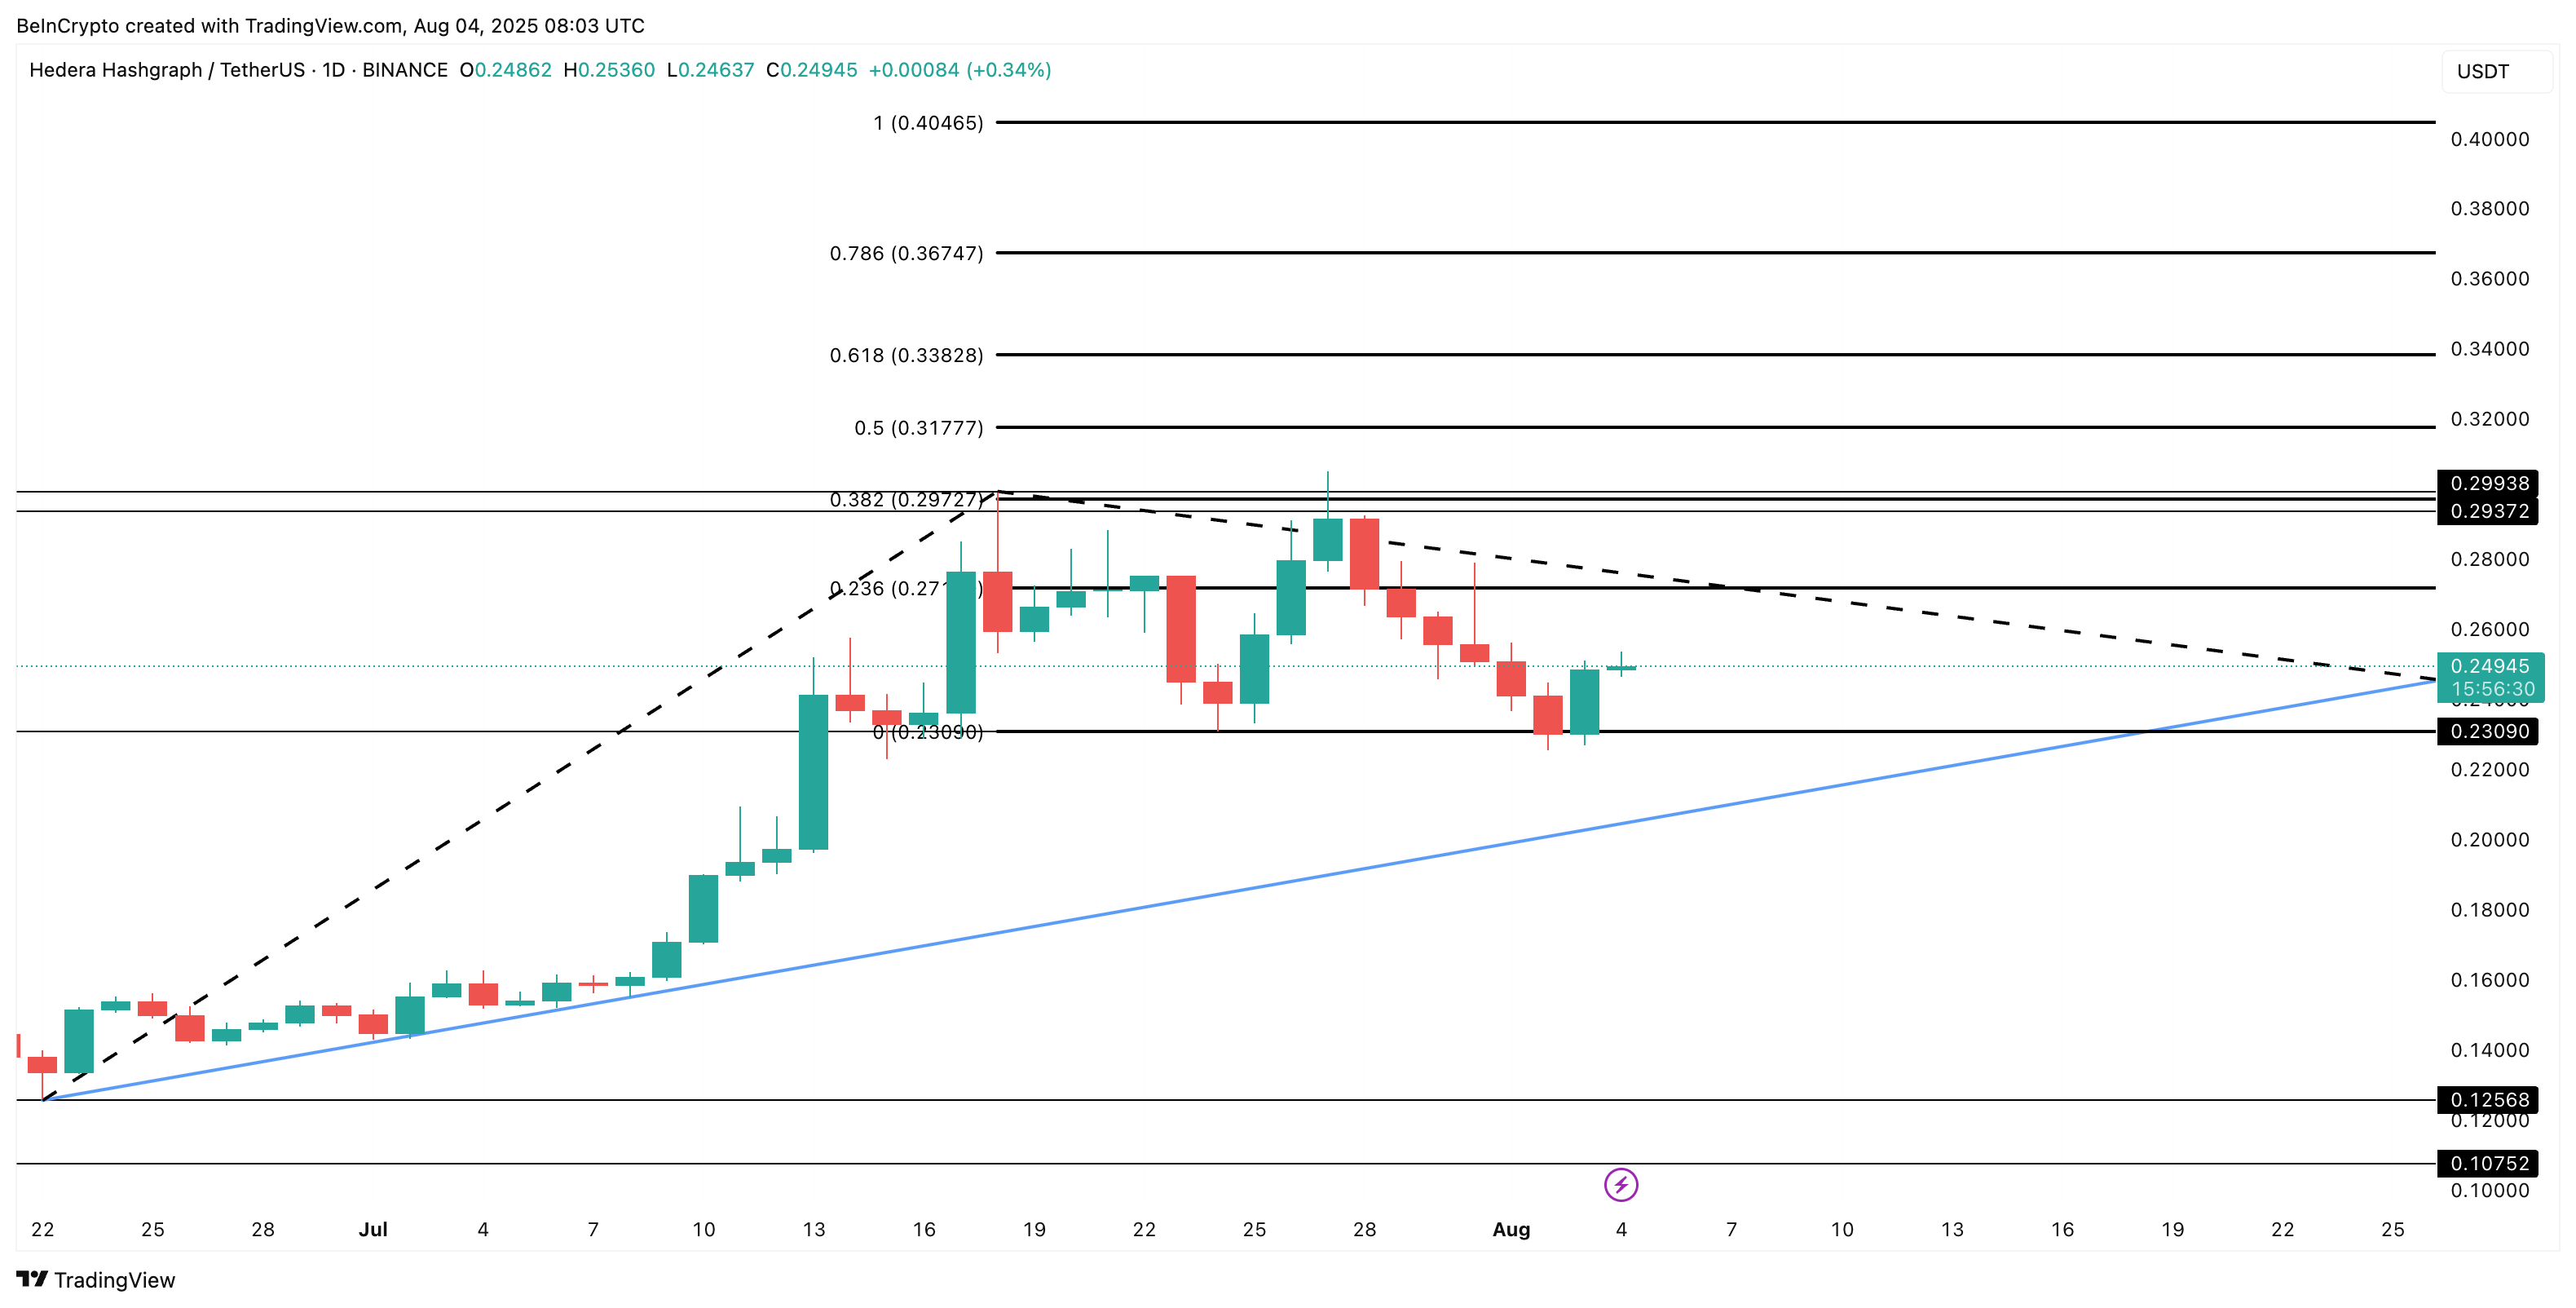
HBAR is forming a clean ascending triangle, a bullish continuation pattern. The rising support trendline started in June, while the horizontal resistance levels are being tested repeatedly. A breakout above $0.27 would confirm the pattern, but $0.29 remains the crucial resistance derived from trend-based Fibonacci extension levels (drawn from $0.12 to $0.29 with retracement to $0.23).
 HBAR price analysis:
TradingView
HBAR price analysis:
TradingView
Trend-based Fibonacci extension is a tool traders use to identify potential future support and resistance levels by projecting price moves from a previous trend swing.
If HBAR price breaks $0.29, it could accelerate toward new swing highs. On the downside, a drop below $0.23 would invalidate the short-term bullish thesis, but the broader structure wouldn’t flip bearish unless the HBAR price breaks out of the triangle’s lower trendline.
Disclaimer: The content of this article solely reflects the author's opinion and does not represent the platform in any capacity. This article is not intended to serve as a reference for making investment decisions.
You may also like
Interview with VanEck Investment Manager: From an Institutional Perspective, Should You Buy BTC Now?
The support levels near $78,000 and $70,000 present a good entry opportunity.

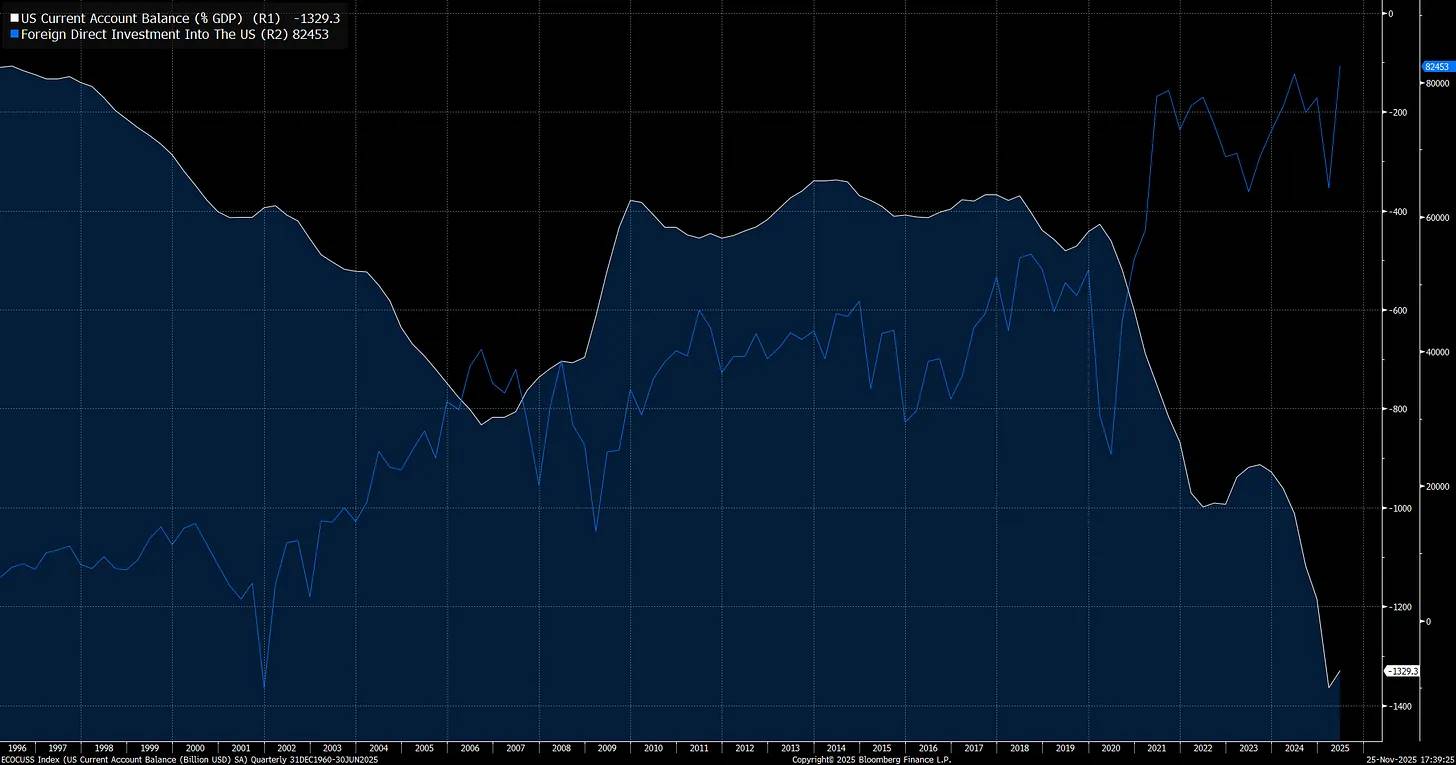
Macroeconomic Report: How Trump, the Federal Reserve, and Trade Sparked the Biggest Market Volatility in History
The deliberate devaluation of the US dollar, combined with extreme cross-border imbalances and excessive valuations, is brewing a volatility event.
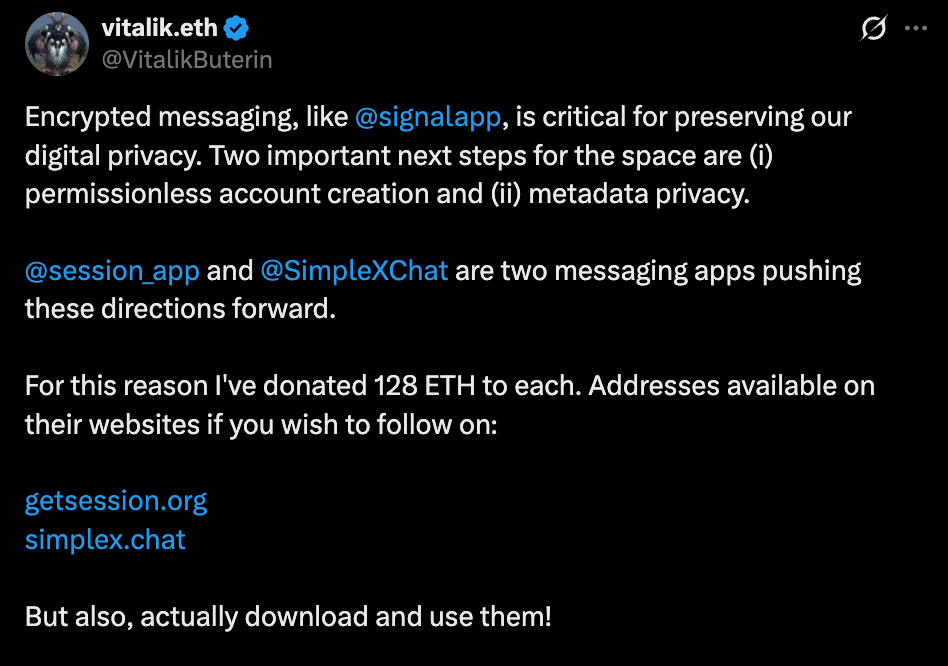
Vitalik donated 256 ETH to two chat apps you've never heard of—what exactly is he betting on?
He made it clear: neither of these two applications is perfect, and there is still a long way to go to achieve true user experience and security.
Prediction Market Supercycle