Fetch.ai (FET) is consolidating near the $0.66 support level, showing mixed signals with bearish momentum on MACD but a rising RSI indicating possible accumulation, while Elliott Wave analysis suggests a bullish continuation could push prices up to $4.00.
-
FET trades near $0.66, testing critical triangle support after rejection at the 0.618 Fibonacci retracement level around $0.78.
-
MACD indicates sustained bearish momentum, but RSI’s subtle rise hints at potential buying interest below $0.70.
-
Long-term Elliott Wave projections target $1.25, $1.60, and $4.00 if the bullish Wave 5 structure confirms.
Fetch.ai (FET) consolidates near key support at $0.66 amid mixed momentum signals. Discover potential price targets and market outlook with COINOTAG’s expert analysis.
What Is Driving Fetch.ai (FET) Price Consolidation Near $0.66 Support?
Fetch.ai (FET) is currently consolidating near the $0.66 support level within a symmetrical triangle pattern formed since early 2025. This consolidation follows a rejection at the 0.618 Fibonacci retracement near $0.78, signaling a critical decision point for the asset’s next move. The price action reflects a balance between bearish pressure and cautious accumulation by buyers.
How Does the Symmetrical Triangle Pattern Impact FET’s Price Movement?
The symmetrical triangle pattern constrains FET’s price between converging trendlines, creating a squeeze toward the apex near $0.66. Since March 2025, FET has oscillated within this formation after a significant drop from $1.80 to $0.42 earlier in the year. A decisive close below $0.67 could trigger a further decline toward $0.38, while holding above this level may support a bullish breakout.

Crypto analyst Ali highlights on X that a close below $0.67 support could lead to a retest of $0.38, emphasizing the importance of this zone for FET’s near-term trend.
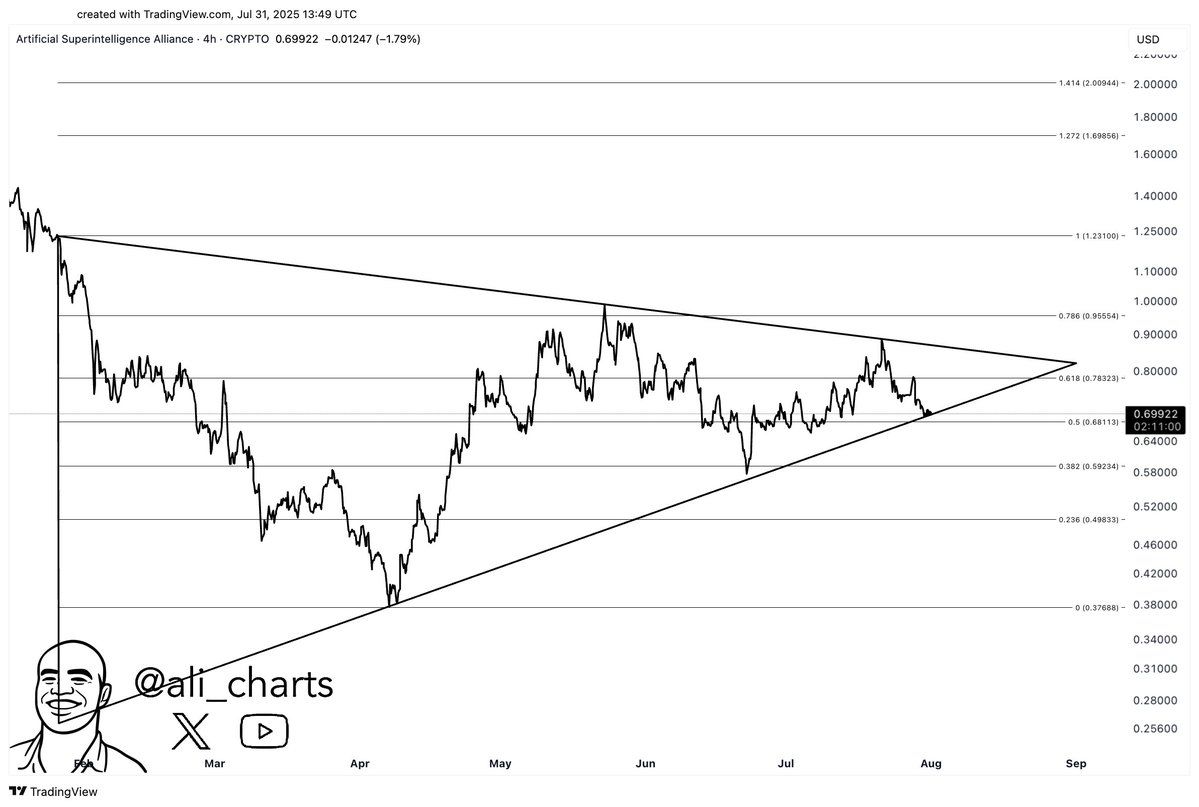
$FET is on the verge of a big price move! A close below the $0.67 support could result in a retest of the $0.38 support. pic.twitter.com/wbL8Gdqxg6
— Ali (@ali_charts) August 1, 2025
Why Does Momentum Analysis Show Mixed Signals for FET?
Technical indicators reveal contrasting momentum signals for Fetch.ai (FET). The MACD remains below zero with dominant red histogram bars, confirming ongoing bearish pressure and weak short-term momentum. Conversely, the RSI is gradually rising, suggesting subtle accumulation and buyer interest near current levels.
Volume has decreased during this consolidation phase, indicating a lack of decisive breakout momentum. Maintaining support above $0.66 is critical for strengthening the recovery case and potentially reversing bearish trends.
What Are the Long-Term Elliott Wave Projections for Fetch.ai (FET)?
Long-term Elliott Wave analysis by Solberg Invest identifies FET as potentially entering a bullish Wave 5 cycle, projecting significant upside targets. Key price levels include $1.25 and $1.60 as intermediate milestones, with a potential peak near $4.00 if bullish momentum sustains.
Volume spikes and market confirmation above $0.78 will be essential to validate this bullish scenario. Breaking above $1.00 could accelerate gains toward higher targets, aligning with the Elliott Wave theory’s forecast for this cycle.
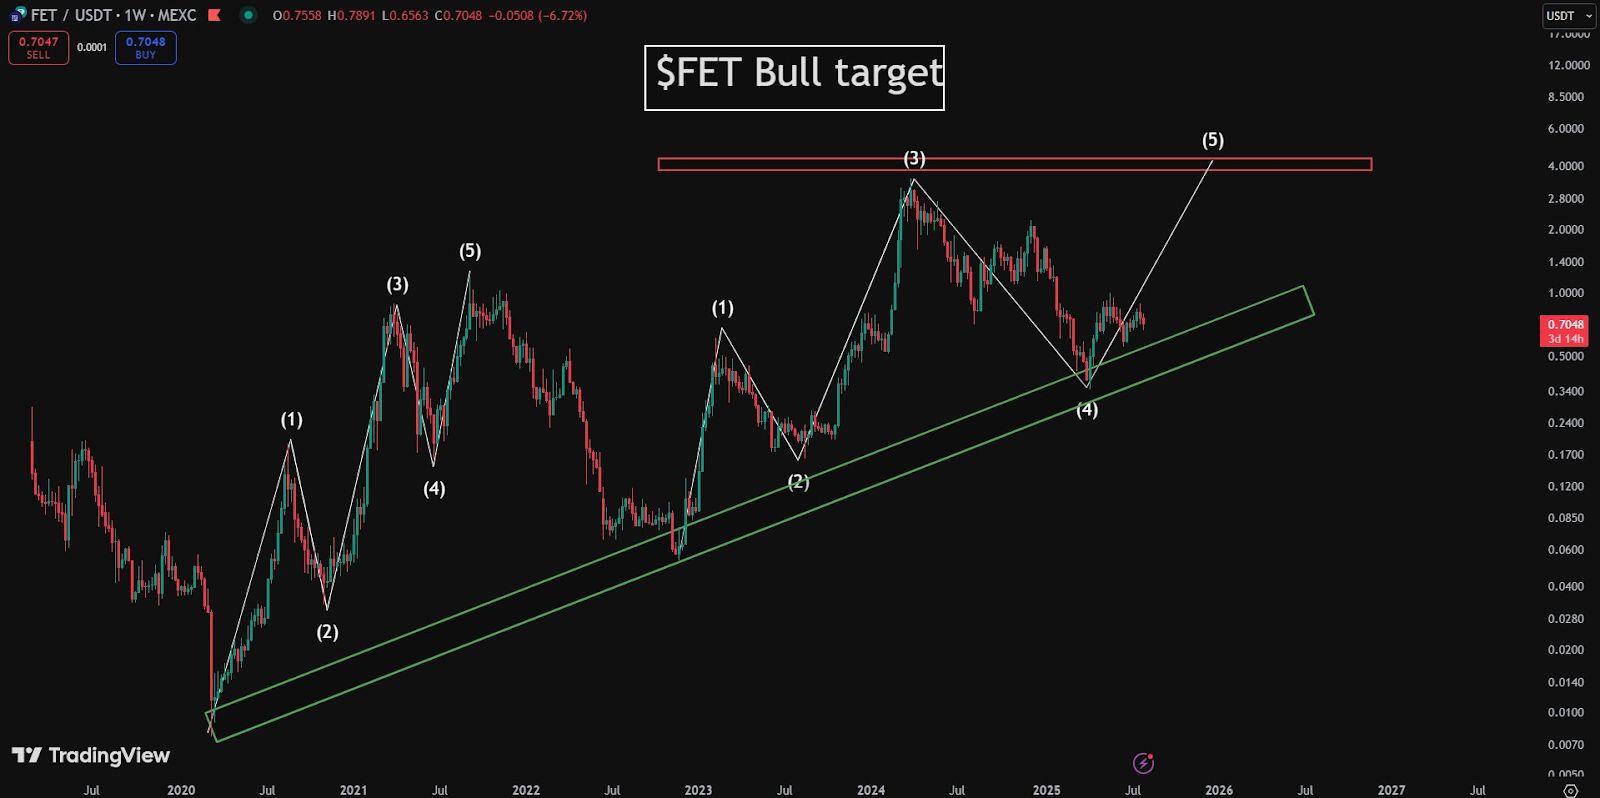
$FET potential!
$4 area possible this cycle, not counting on it but it’s in play 🚀
#FET #CryptoRally #Trading pic.twitter.com/2vjsqOgB5C
— Solberg Invest 🧢 (@SolbergInvest) July 31, 2025
| Support Zone | $0.66 | Triangle Apex & Mid Fibonacci Support |
| Resistance Level | $0.78 | 0.618 Fibonacci Retracement |
| Wave 5 Targets | $1.25, $1.60, $4.00 | Long-Term Elliott Wave Projection |
Frequently Asked Questions
What key support level is Fetch.ai (FET) currently testing?
FET is testing critical support near $0.66, which aligns with the apex of a symmetrical triangle and a mid-level Fibonacci retracement, crucial for determining its next price direction.
Why is the RSI important for understanding FET’s momentum?
The RSI’s gradual rise suggests increasing buying interest despite bearish MACD signals, indicating potential accumulation and a possible trend reversal near current support.
Key Takeaways
- FET is consolidating near $0.66 support: This level is critical within a symmetrical triangle pattern.
- Momentum indicators show mixed signals: Bearish MACD contrasts with a rising RSI, hinting at possible accumulation.
- Elliott Wave projects bullish targets: Potential price points include $1.25, $1.60, and $4.00 if resistance breaks.
Conclusion
Fetch.ai (FET) remains at a pivotal juncture, balancing between bearish momentum and bullish accumulation signals. The symmetrical triangle pattern and Fibonacci levels define critical support and resistance zones. Long-term Elliott Wave analysis offers an optimistic outlook with potential for significant gains if key levels are surpassed. Investors should watch volume and momentum indicators closely for confirmation of the next trend direction.