Hedera (HBAR) Leads Made In USA Coins in Weekly Losses – What’s Next?

HBAR's slight recovery after hitting a 30-day low may be short-lived. Technical indicators point to continued bearish momentum unless buying surges.
A dip in overall crypto trading activity last week sent Hedera’s native token, HBAR, tumbling to a 30-day low of $0.16 on May 31. Although the token has managed to climb around 3% over the past 24 hours, the recovery may not mark a true bullish reversal.
Technical indicators suggest the rebound may be a classic dead cat bounce—a temporary relief in a prevailing downtrend. This analysis explains why this may be the case.
Persistent Selling Pushes HBAR Below Key Technical Level
Hedera dropped over 10% in the past week, facing the worst loss among the top 10 made in USA coins.
HBAR’s steady decline over the past week has pushed the token’s price below its 20-day exponential moving average (EMA). This breakdown confirms the presence of strong selling pressure among spot market participants.
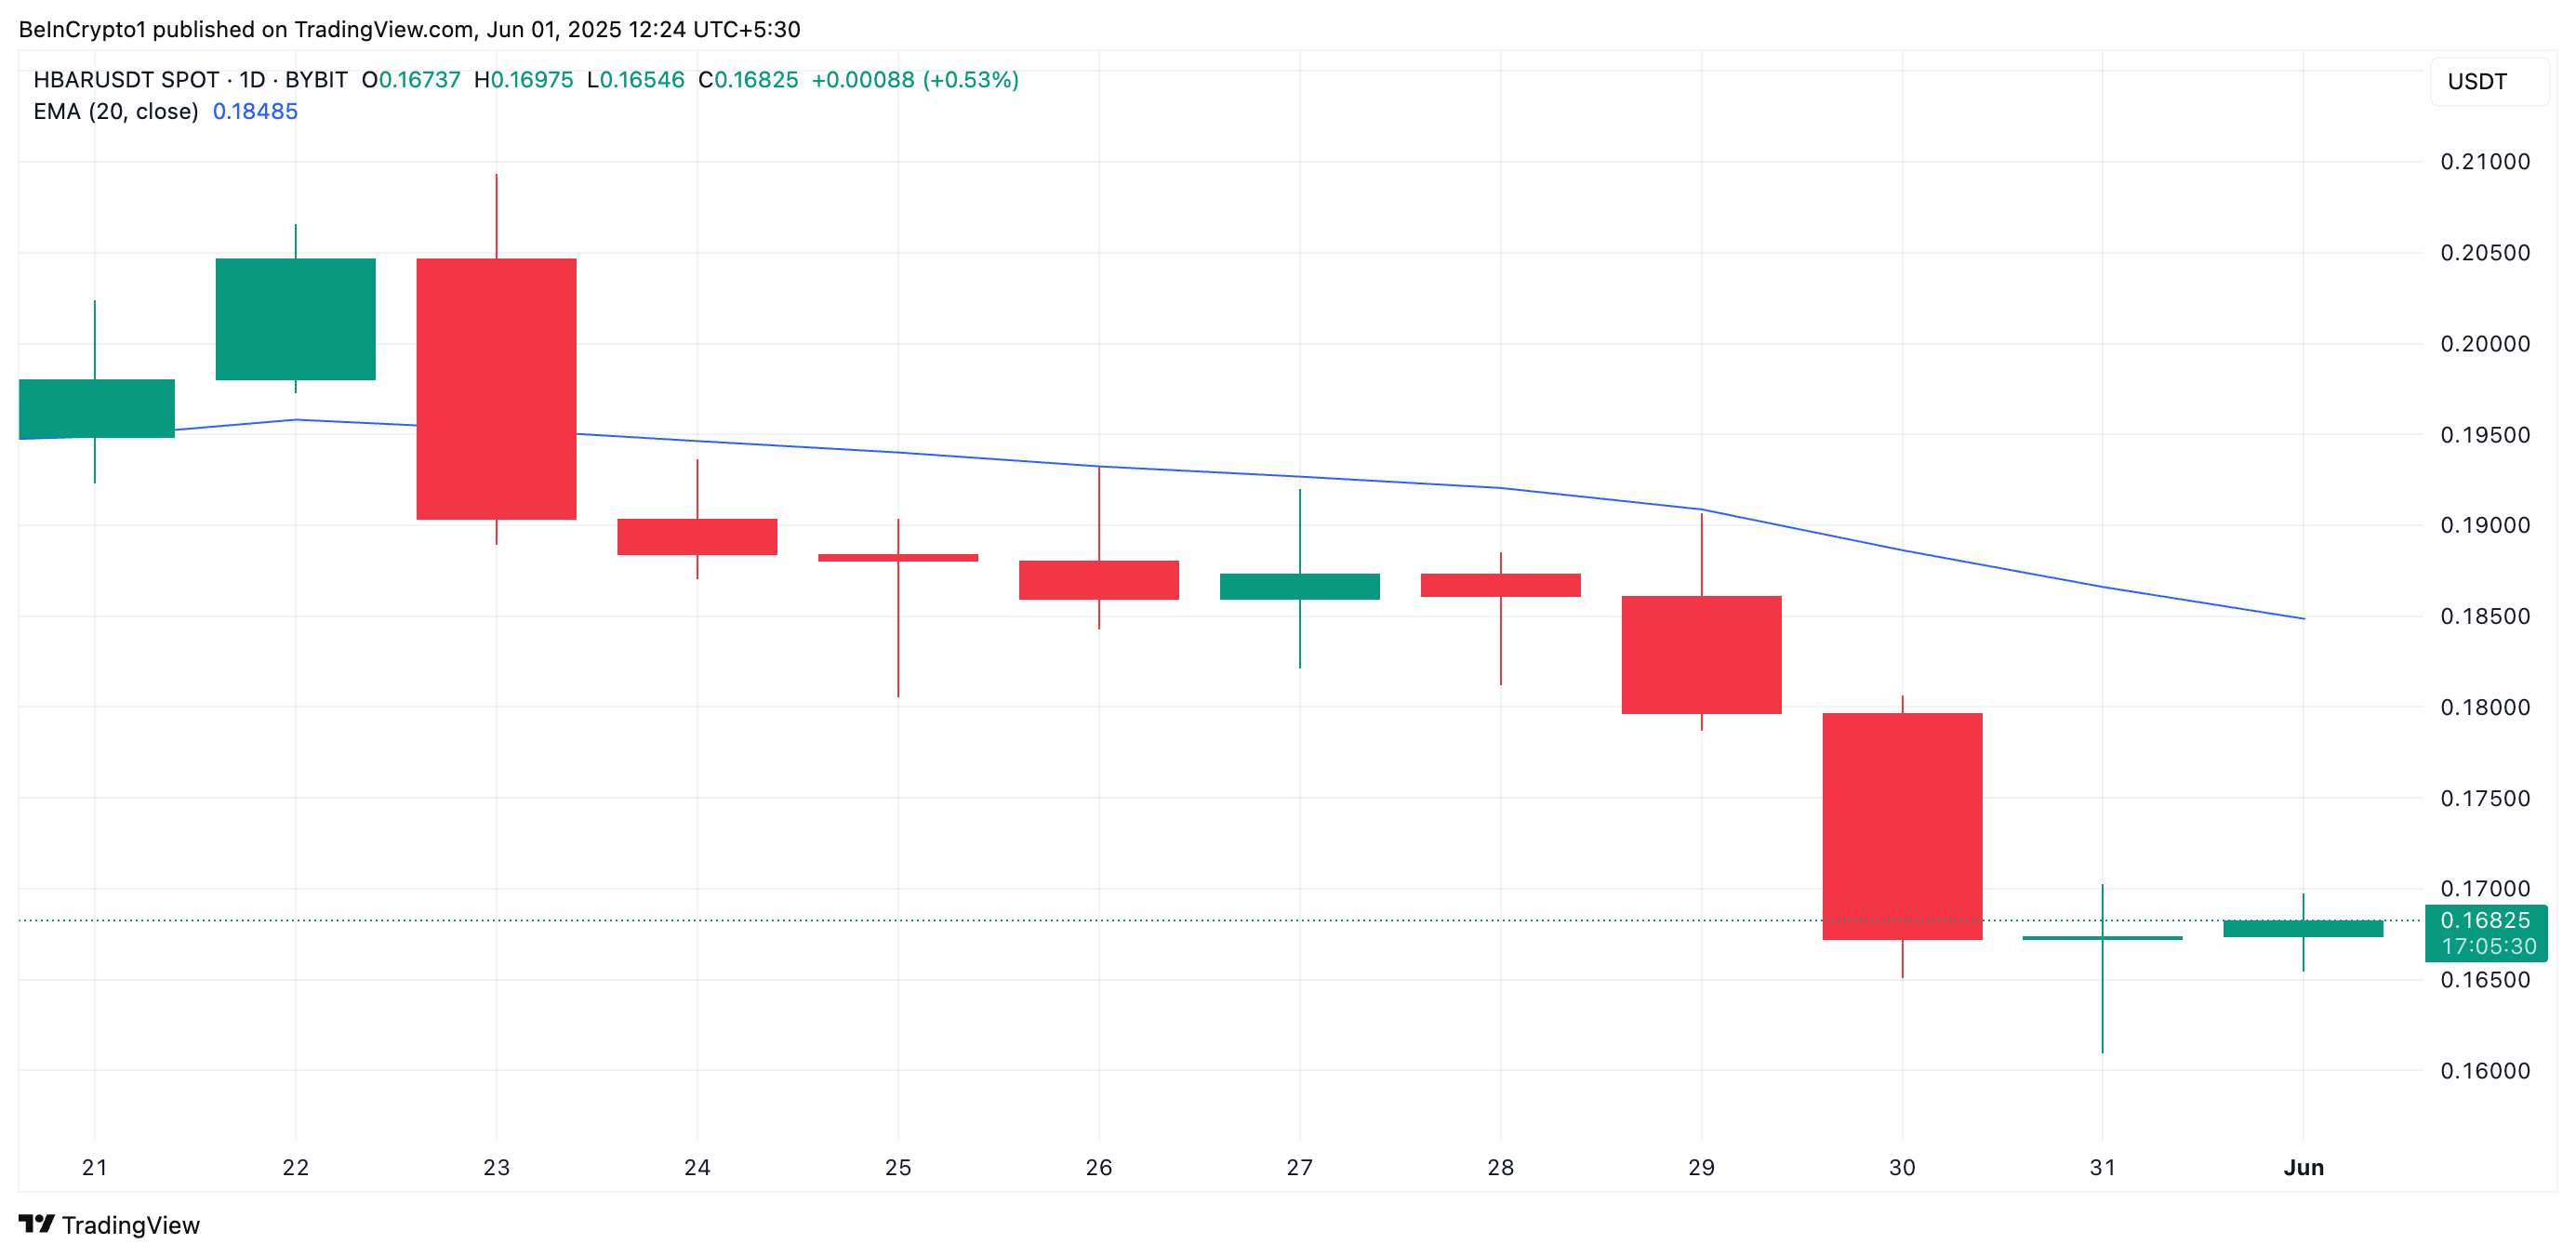 HBAR 20-Day EMA. Source:
TradingView
HBAR 20-Day EMA. Source:
TradingView
The 20-day EMA measures an asset’s average trading price over the past 20 trading days, giving weight to recent price changes.
When an asset falls below this key moving average, it signals a shift in short-term momentum from bullish to bearish. This breach typically suggests that recent selling pressure in the market outweighs buying interest, potentially triggering further downside.
Therefore, for HBAR, slipping below this key support level reinforces bearish sentiment and increases the likelihood of continued price weakness.
Further, the token’s Elder-Ray Index, which measures the strength of its bulls against the bears, shows continued dominance by sellers. The indicator’s red histogram bars remain below the zero line, printing -0.028 at press time.
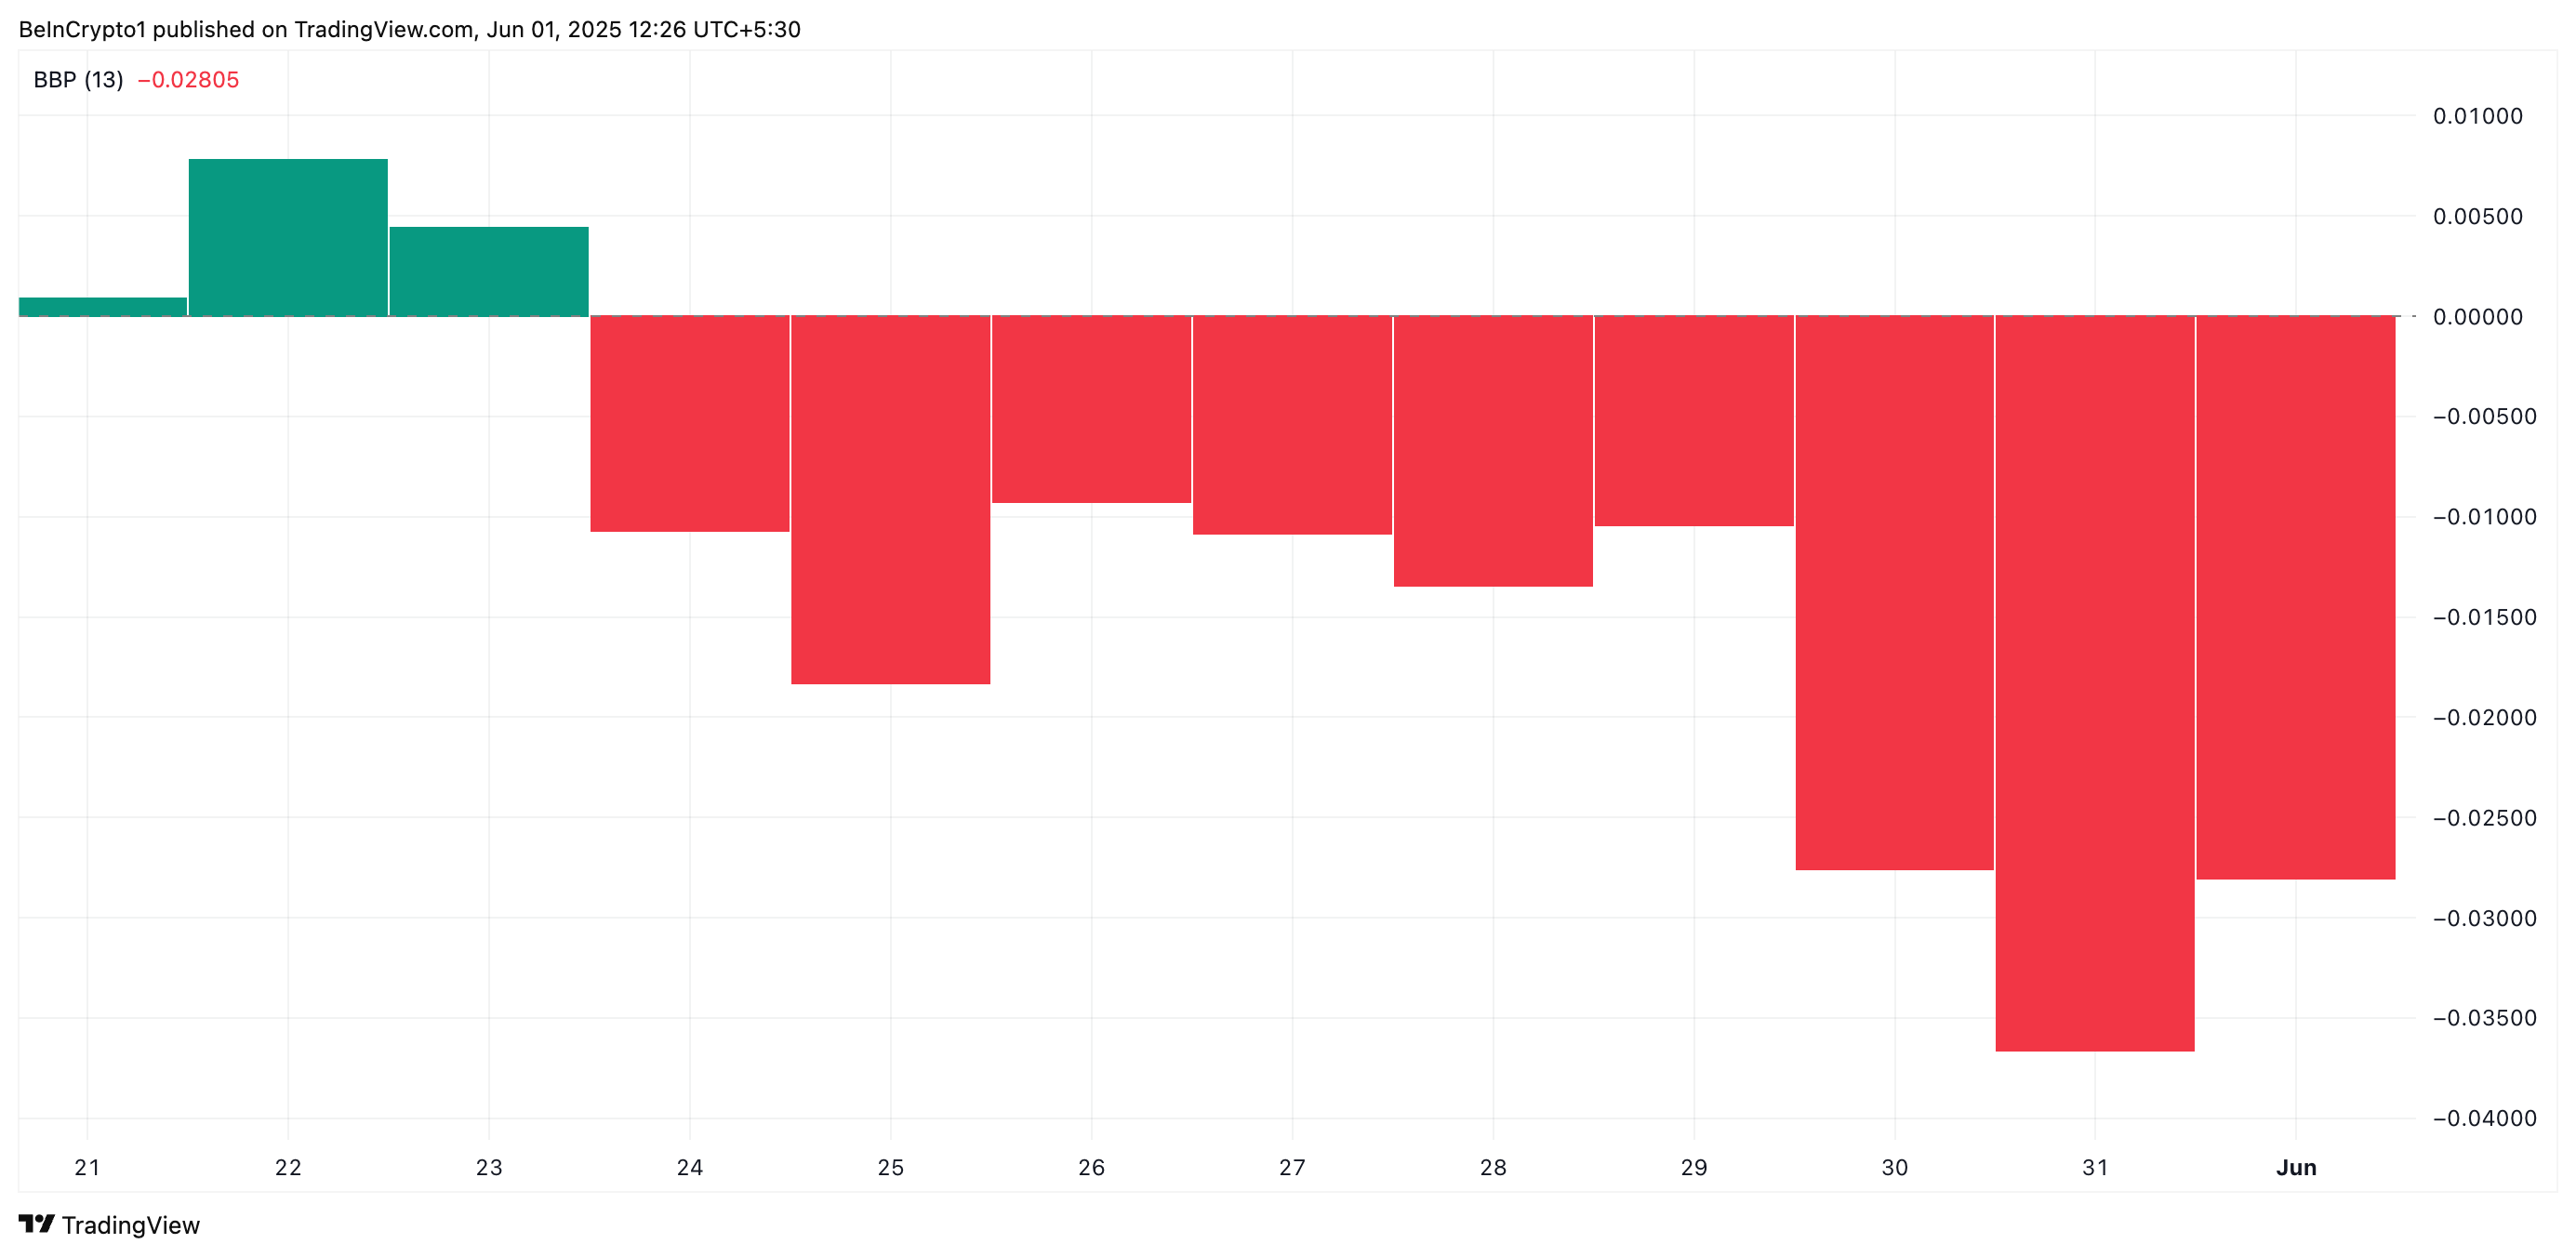 HBAR Elder-Ray Index. Source:
TradingView
HBAR Elder-Ray Index. Source:
TradingView
The indicator has persistently returned negative values since May 24, highlighting a lack of bullish power even during the recent price uptick.
Can Bulls Save HBAR? Price Eyes Critical Support at $0.153
HBAR currently trades at $0.168, with its 20-day EMA forming a dynamic resistance above it at $0.184. This suggests that any uptrend may face strong rejection unless buying momentum strengthens significantly.
Without a strong demand for HBAR, it could resume its decline and fall toward the support floor at $0.153. Should the bulls fail to defend this level, the price fall could deepen to reach $0.124.
 HBAR Price Analysis. Source:
TradingView
HBAR Price Analysis. Source:
TradingView
However, a resurgence in buying pressure will invalidate this bearish outlook. The token’s price could climb above the 20-day EMA to trade at $0.19 in that scenario.
Disclaimer: The content of this article solely reflects the author's opinion and does not represent the platform in any capacity. This article is not intended to serve as a reference for making investment decisions.
You may also like
The Impact of a 30% Increase in ICP Token Value on Investments in Blockchain Infrastructure
- ICP's 30% price surge to $4.71 in November 2025 stems from ICP 2.0 upgrades (Caffeine, Internet Identity 2.0) and institutional partnerships with Microsoft Azure and Google Cloud. - This growth challenges AWS/Azure dominance, with ICP's Fission upgrade enabling scalable decentralized storage and attracting enterprises seeking alternatives to centralized cloud providers. - However, regulatory uncertainty and market volatility (e.g., 91% drop in token transfers during dips) raise questions about long-term

The Economic Impact of Incorporating AI in Sectors Driven by Data
- Global AI infrastructure investments by tech giants like Alphabet and Microsoft are projected to reach $315B in 2025, generating $15T in economic value by 2030 through automation and analytics. - The U.S. leads with $470B in AI infrastructure funding (2013-2024), driven by cloud expansion expected to hit $3.4T by 2040, creating fragmented markets for consolidation. - Data-centric ecosystems (e.g., JHU, ICP Caffeine AI) enable pharmaceuticals and finance firms to build competitive barriers via proprietary

Internet Computer (ICP) Price Rally: Business and Academic Integration Driving Growth
Solana's Abrupt Plunge: Is This a Warning Sign for Cryptocurrency Traders?
- Solana's 2025 crash saw 11% price drop to $125.94 amid $19B liquidation, exposing systemic risks in high-speed blockchain ecosystems. - Technical vulnerabilities like centralized validator sets and thin liquidity amplified volatility, contrasting with Bitcoin/Ethereum's resilient infrastructure. - Governance flaws including token distribution bottlenecks and speculative attacks highlighted Solana's susceptibility to sudden supply shocks. - Macroeconomic pressures and leveraged positions triggered cascadi