
XRP News: Don’t Miss This XRP Rally

Ripple’s XRP is showing renewed strength on the charts, with bullish momentum accelerating both in the short term and on the daily timeframe. Based on the current TradingView hourly and daily charts, here’s a full breakdown of where XRP stands and what could be next.
XRP Price Prediction: What Is XRP Doing Right Now?
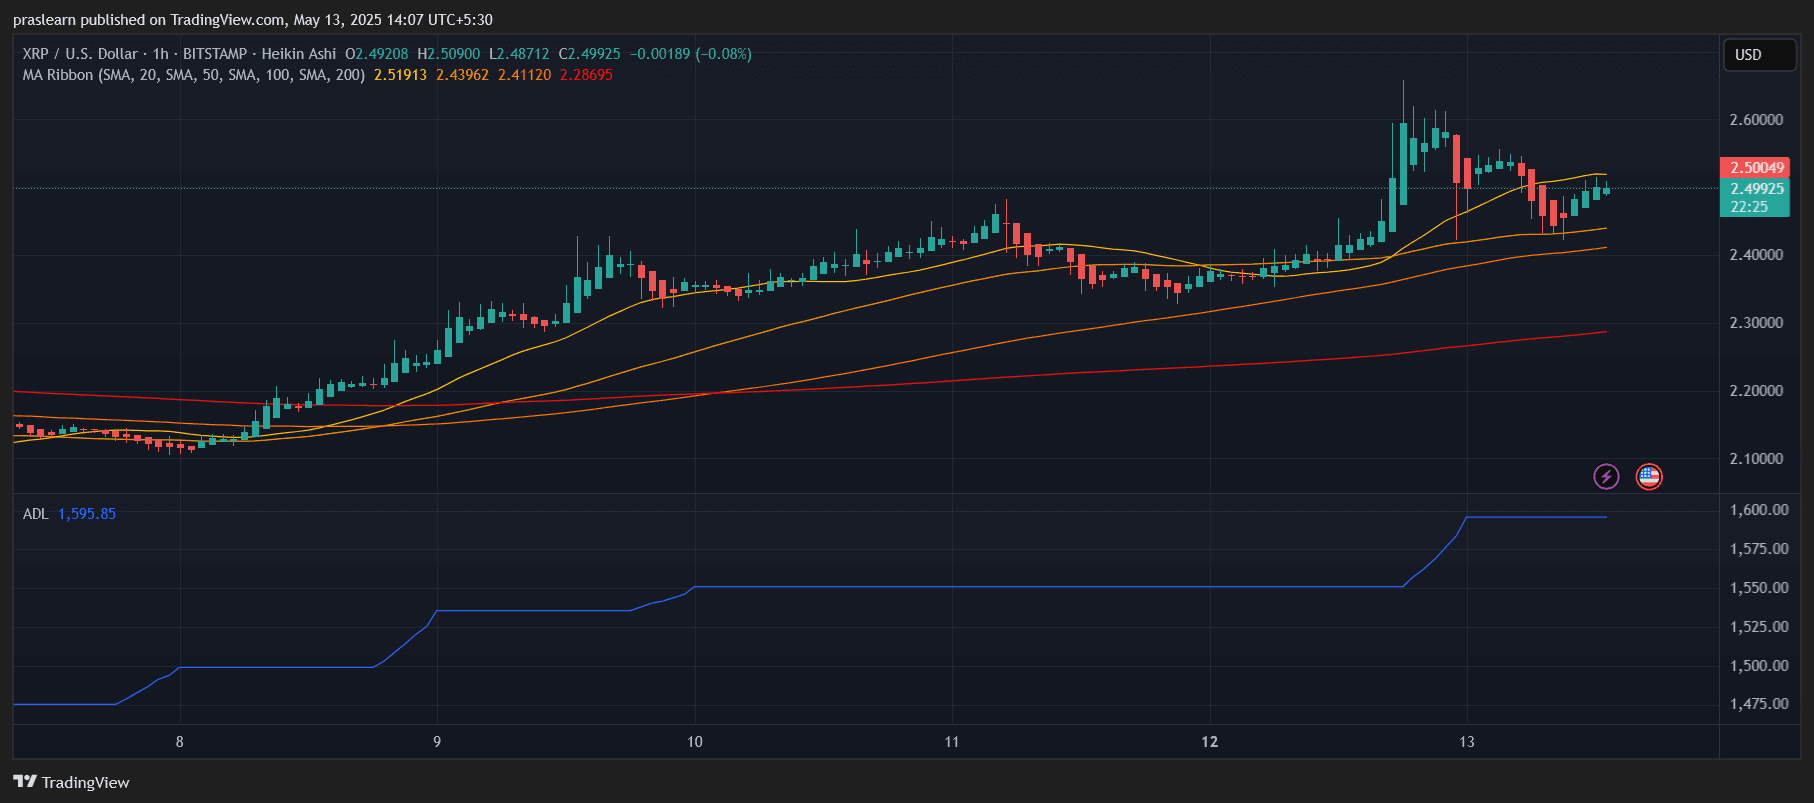 XRP/USD 1 Hr Chart- TradingView
As of May 13, 2025, XRP is trading near $2.50 , showing a solid uptrend supported by multiple moving averages. The daily chart shows XRP bouncing from the $2.10 range and breaking past several key resistances. On the hourly chart, XRP price is maintaining price action above all major short-term moving averages, signaling strong intraday momentum.
Is XRP in a Bullish Trend?
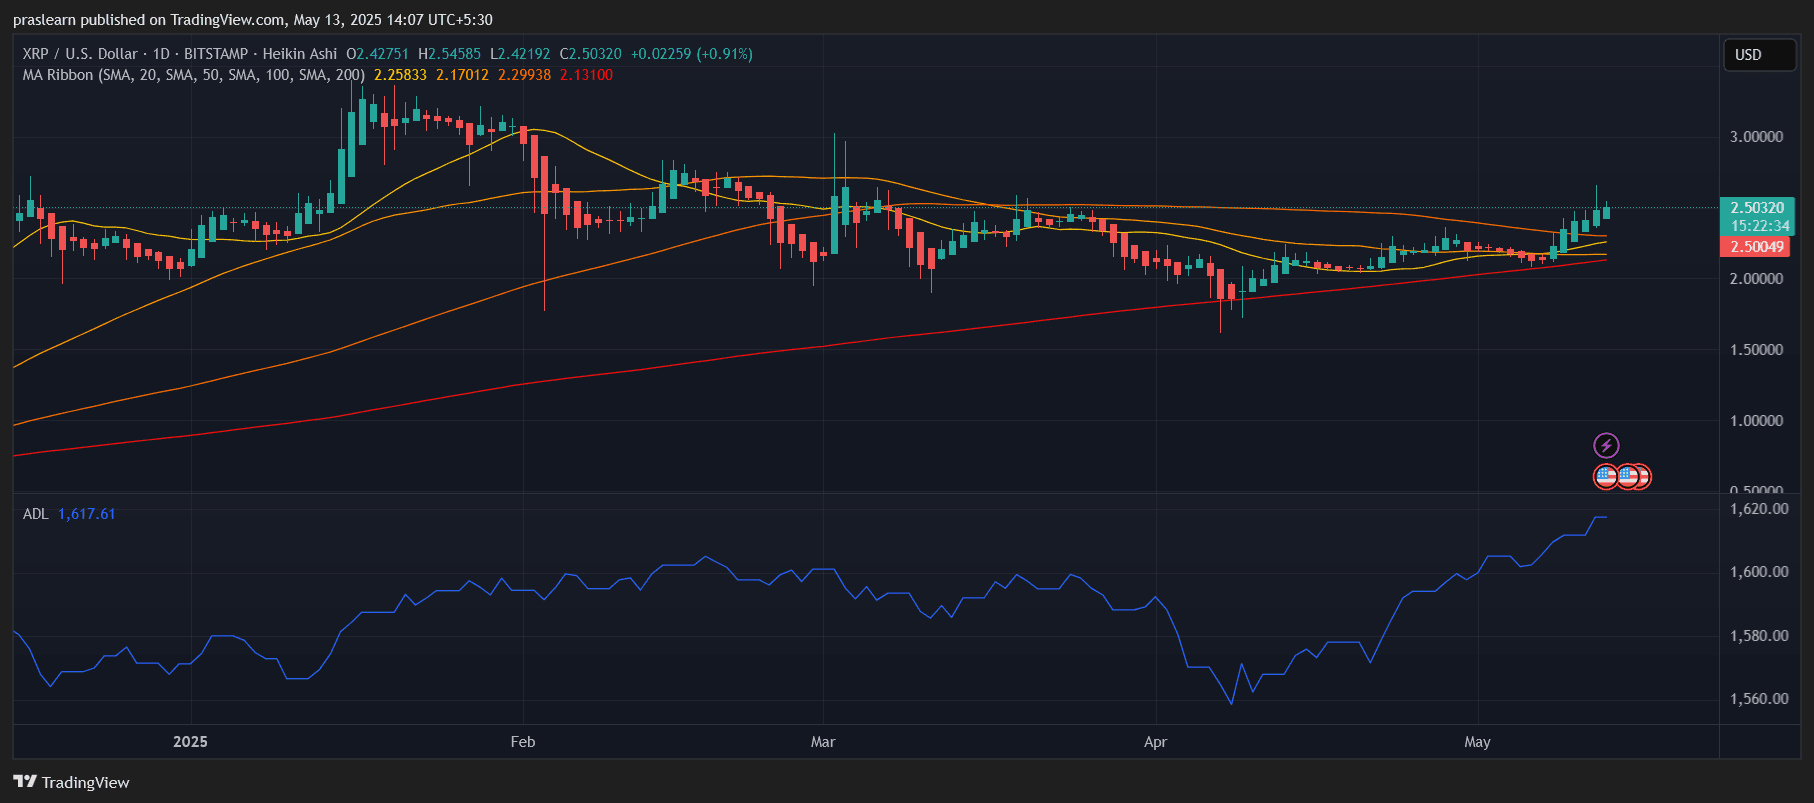 XRP/USD Daily Chart- TradingView
Yes, both timeframes confirm a bullish structure:
- Daily Chart: XRP price is trading above the 20-day ($2.26) , 50-day ($2.17), 100-day ($2.30), and 200-day ($2.13) simple moving averages. This alignment of shorter MAs above longer MAs is a classic bullish signal.
- Hourly Chart: Price remains above the 20-SMA ($2.52), 50-SMA ($2.44), 100-SMA ($2.41), and 200-SMA ($2.28), which indicates strong buyer support even during minor dips.
These alignments suggest both long-term holders and short-term traders are optimistic.
What Do the Accumulation/Distribution Lines Say?
The ADL (Accumulation/Distribution Line) on both charts is steadily rising—up to 1,617 on the daily and 1,595 on the hourly. This indicates consistent accumulation rather than distribution, meaning whales and institutions are likely buying, not selling.
Key Support and Resistance Levels
Based on the charts:
- Immediate resistance: $2.55 – previous intraday high.
- Major resistance: $2.75 and $3.00 – psychological barrier and previous February high.
- Key support: $2.30 (aligned with 100-SMA), then $2.10 (prior swing low).
A sustained breakout above $2.55 could trigger a rally to test the $3.00 level.
XRP Price Prediction: Where Could It Go Next?
Let’s run a Fibonacci extension from the swing low ($2.10) to the recent top near $2.55:
- 0.618 extension: ~$2.75 (likely next resistance)
- 1.0 extension: ~$3.00 (psychological round number)
- 1.618 extension: ~$3.35 (possible breakout target)
Given the bullish crossover of moving averages, the rising ADL, and growing volume, XRP has room to push higher if it holds above $2.30.
Short-Term Trade Idea
If you're considering a short-term trade:
- Buy Zone: $2.40–$2.45 (near 50- and 100-hour SMA)
- Target: $2.75 (first), $3.00 (next)
- Stop-loss: Below $2.30
This offers a favorable risk/reward ratio of about 1:2.5 if targeting $3.00 from a $2.45 entry.
Final Thoughts: Will XRP Explode in 2025?
The charts are aligning for a strong bullish continuation. With XRP price showing strength above its major moving averages, positive accumulation, and bullish sentiment on both hourly and daily timeframes, a break above $2.55 could spark the next leg toward $3.00 and beyond. However, traders should watch closely for volume confirmation and macro news, especially regarding SEC developments or Ripple partnerships.
XRP is not just holding the line — it’s getting ready to charge.
Ripple’s XRP is showing renewed strength on the charts, with bullish momentum accelerating both in the short term and on the daily timeframe. Based on the current TradingView hourly and daily charts, here’s a full breakdown of where XRP stands and what could be next.
XRP Price Prediction: What Is XRP Doing Right Now?
XRP/USD 1 Hr Chart- TradingView
As of May 13, 2025, XRP is trading near $2.50 , showing a solid uptrend supported by multiple moving averages. The daily chart shows XRP bouncing from the $2.10 range and breaking past several key resistances. On the hourly chart, XRP price is maintaining price action above all major short-term moving averages, signaling strong intraday momentum.
Is XRP in a Bullish Trend?
XRP/USD Daily Chart- TradingView
Yes, both timeframes confirm a bullish structure:
- Daily Chart: XRP price is trading above the 20-day ($2.26) , 50-day ($2.17), 100-day ($2.30), and 200-day ($2.13) simple moving averages. This alignment of shorter MAs above longer MAs is a classic bullish signal.
- Hourly Chart: Price remains above the 20-SMA ($2.52), 50-SMA ($2.44), 100-SMA ($2.41), and 200-SMA ($2.28), which indicates strong buyer support even during minor dips.
These alignments suggest both long-term holders and short-term traders are optimistic.
What Do the Accumulation/Distribution Lines Say?
The ADL (Accumulation/Distribution Line) on both charts is steadily rising—up to 1,617 on the daily and 1,595 on the hourly. This indicates consistent accumulation rather than distribution, meaning whales and institutions are likely buying, not selling.
Key Support and Resistance Levels
Based on the charts:
- Immediate resistance: $2.55 – previous intraday high.
- Major resistance: $2.75 and $3.00 – psychological barrier and previous February high.
- Key support: $2.30 (aligned with 100-SMA), then $2.10 (prior swing low).
A sustained breakout above $2.55 could trigger a rally to test the $3.00 level.
XRP Price Prediction: Where Could It Go Next?
Let’s run a Fibonacci extension from the swing low ($2.10) to the recent top near $2.55:
- 0.618 extension: ~$2.75 (likely next resistance)
- 1.0 extension: ~$3.00 (psychological round number)
- 1.618 extension: ~$3.35 (possible breakout target)
Given the bullish crossover of moving averages, the rising ADL, and growing volume, XRP has room to push higher if it holds above $2.30.
Short-Term Trade Idea
If you're considering a short-term trade:
- Buy Zone: $2.40–$2.45 (near 50- and 100-hour SMA)
- Target: $2.75 (first), $3.00 (next)
- Stop-loss: Below $2.30
This offers a favorable risk/reward ratio of about 1:2.5 if targeting $3.00 from a $2.45 entry.
Final Thoughts: Will XRP Explode in 2025?
The charts are aligning for a strong bullish continuation. With XRP price showing strength above its major moving averages, positive accumulation, and bullish sentiment on both hourly and daily timeframes, a break above $2.55 could spark the next leg toward $3.00 and beyond. However, traders should watch closely for volume confirmation and macro news, especially regarding SEC developments or Ripple partnerships.
XRP is not just holding the line — it’s getting ready to charge.
Disclaimer: The content of this article solely reflects the author's opinion and does not represent the platform in any capacity. This article is not intended to serve as a reference for making investment decisions.
You may also like
2025 TGE Survival Ranking: Who Will Rise to the Top and Who Will Fall? Complete Grading of 30+ New Tokens, AVICI Dominates S+
The article analyzes the TGE performance of multiple blockchain projects, evaluating project performance using three dimensions: current price versus all-time high, time span, and liquidity-to-market cap ratio. Projects are then categorized into five grades: S, A, B, C, and D. Summary generated by Mars AI This summary was generated by the Mars AI model, and the accuracy and completeness of its content are still being iteratively updated.

Mars Finance | "Machi" increases long positions, profits exceed 10 million dollars, whale shorts 1,000 BTC
Russian households have invested 3.7 billion rubles in cryptocurrency derivatives, mainly dominated by a few large players. INTERPOL has listed cryptocurrency fraud as a global threat. Malicious Chrome extensions are stealing Solana funds. The UK has proposed new tax regulations for DeFi. Bitcoin surpasses $91,000. Summary generated by Mars AI. The accuracy and completeness of this summary are still being iteratively updated by the Mars AI model.

How much is ETH really worth? Hashed provides 10 different valuation methods in one go
After taking a weighted average, the fair price of ETH exceeds $4,700.

Dragonfly partner: Crypto has fallen into financial cynicism, and those valuing public blockchains with PE ratios have already lost
People tend to overestimate what can happen in two years, but underestimate what can happen in ten years.
