Date: Tue, March 18, 2025 | 08:01 AM GMT
The cryptocurrency market is experiencing mixed performance ahead of tomorrow’s crucial FOMC meeting, where the Federal Reserve will decide on interest rate changes. Amidst this uncertainty, Pi Network (PI) has continued its downward movement, dropping over 14% in the past 24 hours. The price declined from its 24-hour high of $1.39 to a low of $1.08 before slightly recovering to $1.17.
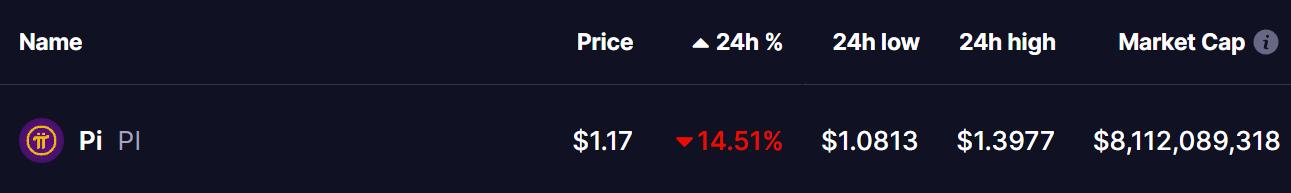 Source: Coinmarketcap
Despite this correction, current price action suggests that PI may be preparing for a potential trend reversal, which could lead to a strong bullish breakout.
Falling Wedge Formation Suggests a Potential Reversal
On the 4-hour chart, PI appears to be forming a falling wedge pattern, a bullish reversal setup. After reaching its peak of $3.00 on February 26, the token has been in a downtrend, losing more than 60% of its value. Today, PI tested the lower support of the wedge at $1.08, a critical level that has previously acted as strong support.
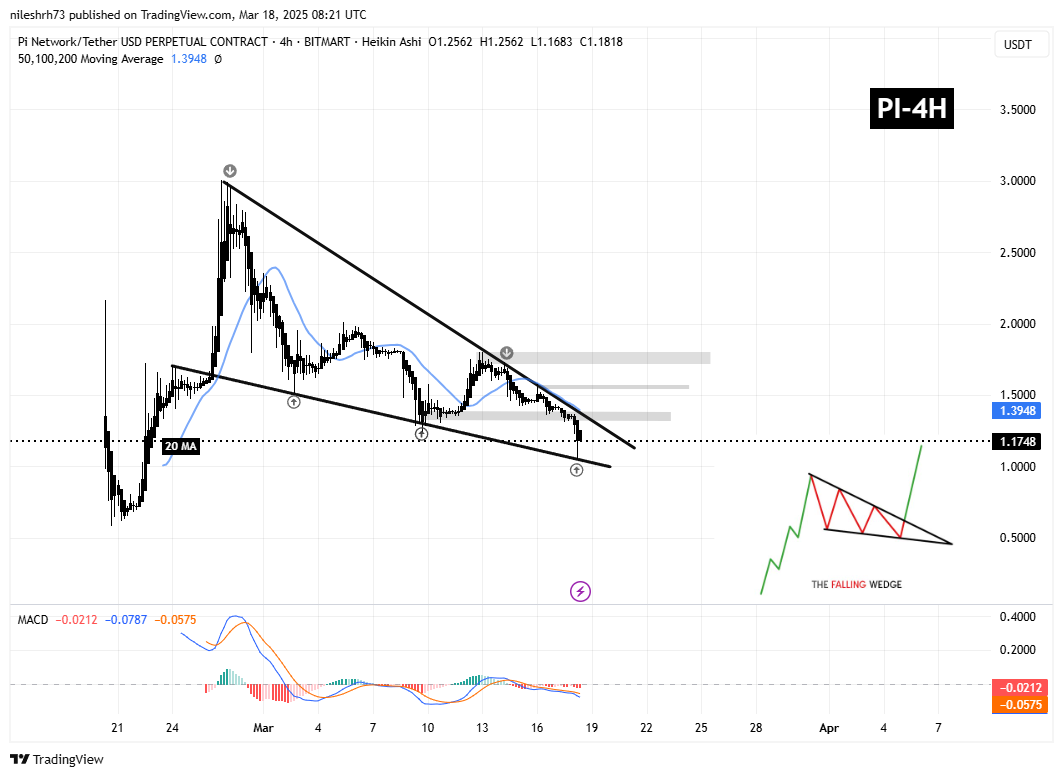 Pi Network (PI) 4-H Chart/Coinsprobe (Source: Tradingview)
Following this test, PI has managed to bounce slightly and is now trading at $1.17. The price still has room for sideways consolidation before attempting a move toward the upper resistance of the wedge and the 20-day moving average (MA). If this pattern holds and PI makes a successful bounce, a breakout from the wedge could trigger a bullish rally, with the next key resistance levels at $1.36, $1.57, and $1.80. A breakout at these levels could push PI’s price up by more than 50% from current levels.
However, if PI fails to hold the support of the wedge, another wave of selling pressure could push its price down toward the $0.75 support zone, leading to a deeper correction.
The MACD indicator on the 4-hour chart is showing signs of a potential reversal. Although the MACD line remains below the signal line, the histogram is beginning to show reduced bearish momentum. If PI continues to consolidate and the MACD line crosses above the signal line, it could confirm a shift in momentum toward a bullish breakout.
Final Thoughts
PI is at a crucial decision point, with the falling wedge pattern providing a clear setup for either a breakout or further downside movement. A successful bounce from current levels could pave the way for a strong bullish trend, while a breakdown below support could lead to further losses. As the broader market awaits the FOMC decision, traders should keep a close eye on PI’s price action and technical indicators for confirmation of its next move.
Disclaimer: This article is for informational purposes only and does not constitute financial advice. Always conduct your own research before investing in cryptocurrencies.