Cardano (ADA) Momentum Builds: Rally Has More Room to Run

Cardano price started a fresh surge above the $1.00 zone. ADA is consolidating and might aim for a fresh increase above the $1.1150 level.
- ADA price started a downside correction from the $1.1150 zone.
- The price is trading above $1.00 and the 100-hourly simple moving average.
- There is a short-term rising channel forming with support at $1.075 on the hourly chart of the ADA/USD pair (data source from Kraken).
- The pair could start another increase if it clears the $1.1150 resistance zone.
Cardano Price Starts Fresh Surge
After forming a base above the $0.80 level, Cardano started a fresh increase, beating Bitcoin and Ethereum . ADA surged above the $0.90 and $1.00 levels.
The bulls even pushed the price above $1.120. A high was formed at $1.1156 and the price is now consolidating gains. There was a minor decline below $1.1120, but the price remained above the 23.6% Fib retracement level of the upward move from the $0.8373 swing low to the $1.1156 high.
Cardano price is now trading above $1.00 and the 100-hourly simple moving average. There is also a short-term rising channel forming with support at $1.075 on the hourly chart of the ADA/USD pair.
Source: ADAUSD on TradingView.comOn the upside, the price might face resistance near the $1.10 zone. The first resistance is near $1.1120. The next key resistance might be $1.1150. If there is a close above the $1.1150 resistance, the price could start a strong rally. In the stated case, the price could rise toward the $1.20 region. Any more gains might call for a move toward $1.250 in the near term.
Downside Correction in ADA?
If Cardano’s price fails to climb above the $1.1120 resistance level, it could start another decline. Immediate support on the downside is near the $1.080 level.
The next major support is near the $1.050 level. A downside break below the $1.050 level could open the doors for a test of $0.975 or the 50% Fib retracement level of the upward move from the $0.8373 swing low to the $1.1156 high. The next major support is near the $0.950 level where the bulls might emerge.
Technical Indicators
Hourly MACD – The MACD for ADA/USD is gaining momentum in the bullish zone.
Hourly RSI (Relative Strength Index) – The RSI for ADA/USD is now above the 50 level.
Major Support Levels – $1.0800 and $1.050.
Major Resistance Levels – $1.1120 and $1.1150.
Disclaimer: The content of this article solely reflects the author's opinion and does not represent the platform in any capacity. This article is not intended to serve as a reference for making investment decisions.
You may also like
Interview with VanEck Investment Manager: From an Institutional Perspective, Should You Buy BTC Now?
The support levels near $78,000 and $70,000 present a good entry opportunity.

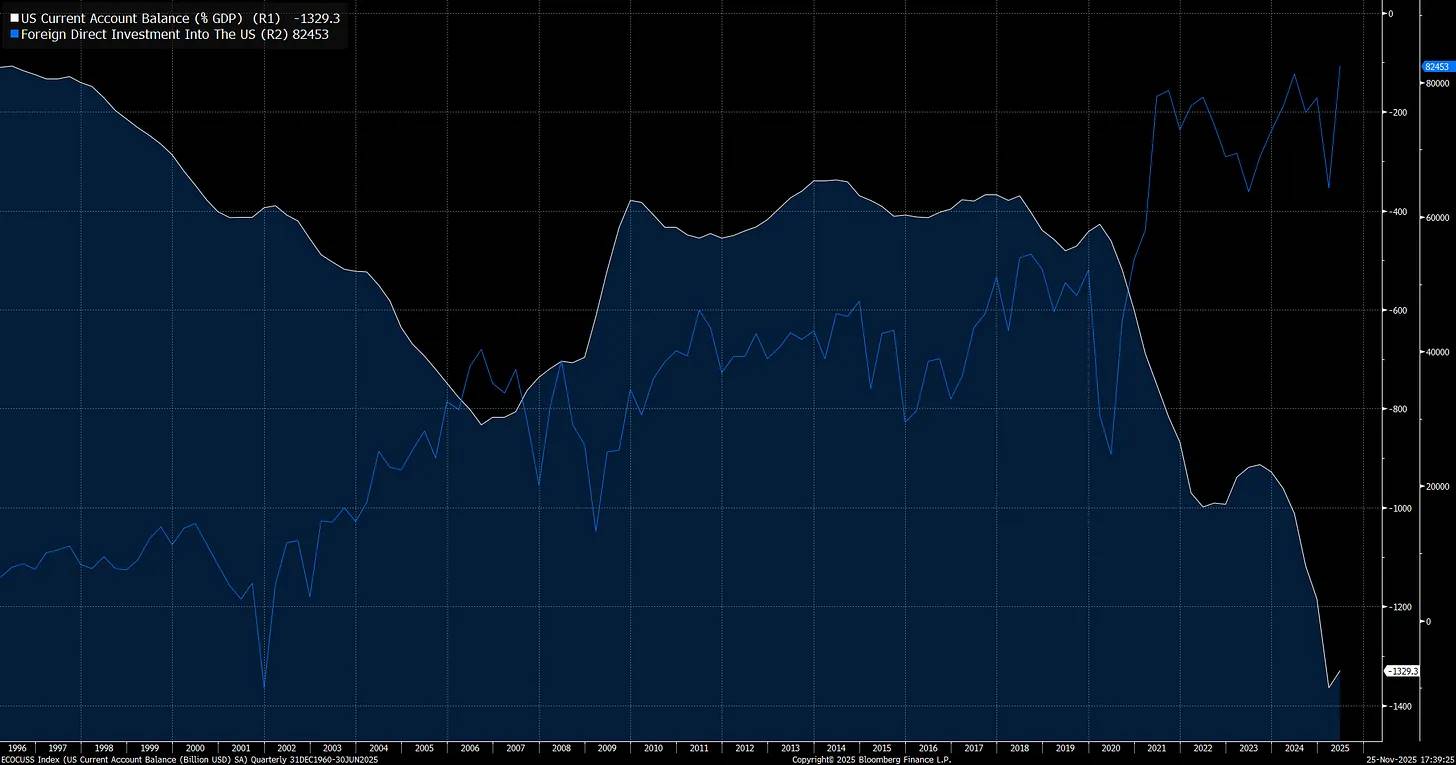
Macroeconomic Report: How Trump, the Federal Reserve, and Trade Sparked the Biggest Market Volatility in History
The deliberate devaluation of the US dollar, combined with extreme cross-border imbalances and excessive valuations, is brewing a volatility event.
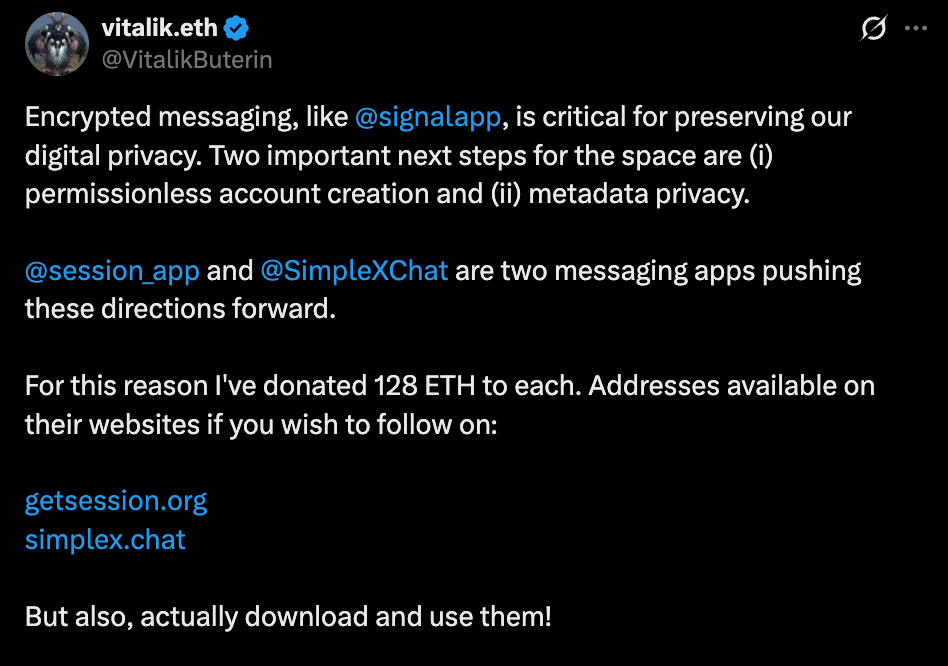
Vitalik donated 256 ETH to two chat apps you've never heard of—what exactly is he betting on?
He made it clear: neither of these two applications is perfect, and there is still a long way to go to achieve true user experience and security.
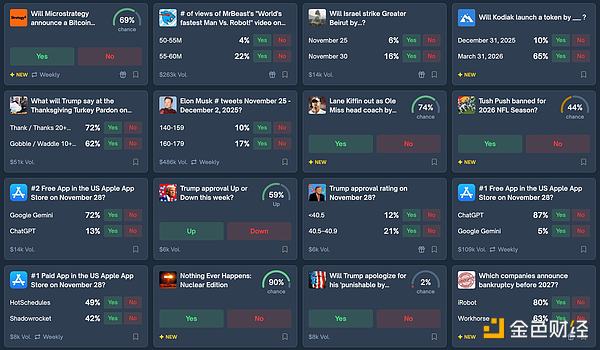
Prediction Market Supercycle