Bitget App
Trade smarter
Buy cryptoMarketsTradeFuturesEarnSquareMore
Solana’s on-chain data defies bearish technical indicators

Solana’s on-chain data defies bearish technical indicators

Cryptopolitan2024/07/13 09:25
By:By Jai Hamid

Share link:In this post: Solana’s daily non-vote transactions have surged to 50 million, indicating growing activity in DeFi, gaming, and other DApps. Active addresses on Solana have reached 2 million daily and 60 million monthly, showing increasing user adoption. Despite a drop in SOL derivatives trading volume, long/short ratios indicate a bullish sentiment among traders.Disclaimer. The information provided is not trading advice. Cryptopolitan.com holds no liability for any investments made based on the

Solana’s on-chain data show a picture that’s quite different from what technical indicators are showing. Despite bearish signals, the network has been buzzing with activity.

Bullish network

Daily non-vote transactions on the Solana network have been climbing steadily, reaching around 50 million. This rise since early 2024 indicates more users are engaging with decentralized finance (DeFi) apps, gaming, and other DApps. 

On a monthly scale, non-vote transactions peaked at about 1.2 billion, aligning with the daily trend and showing strong network activity.
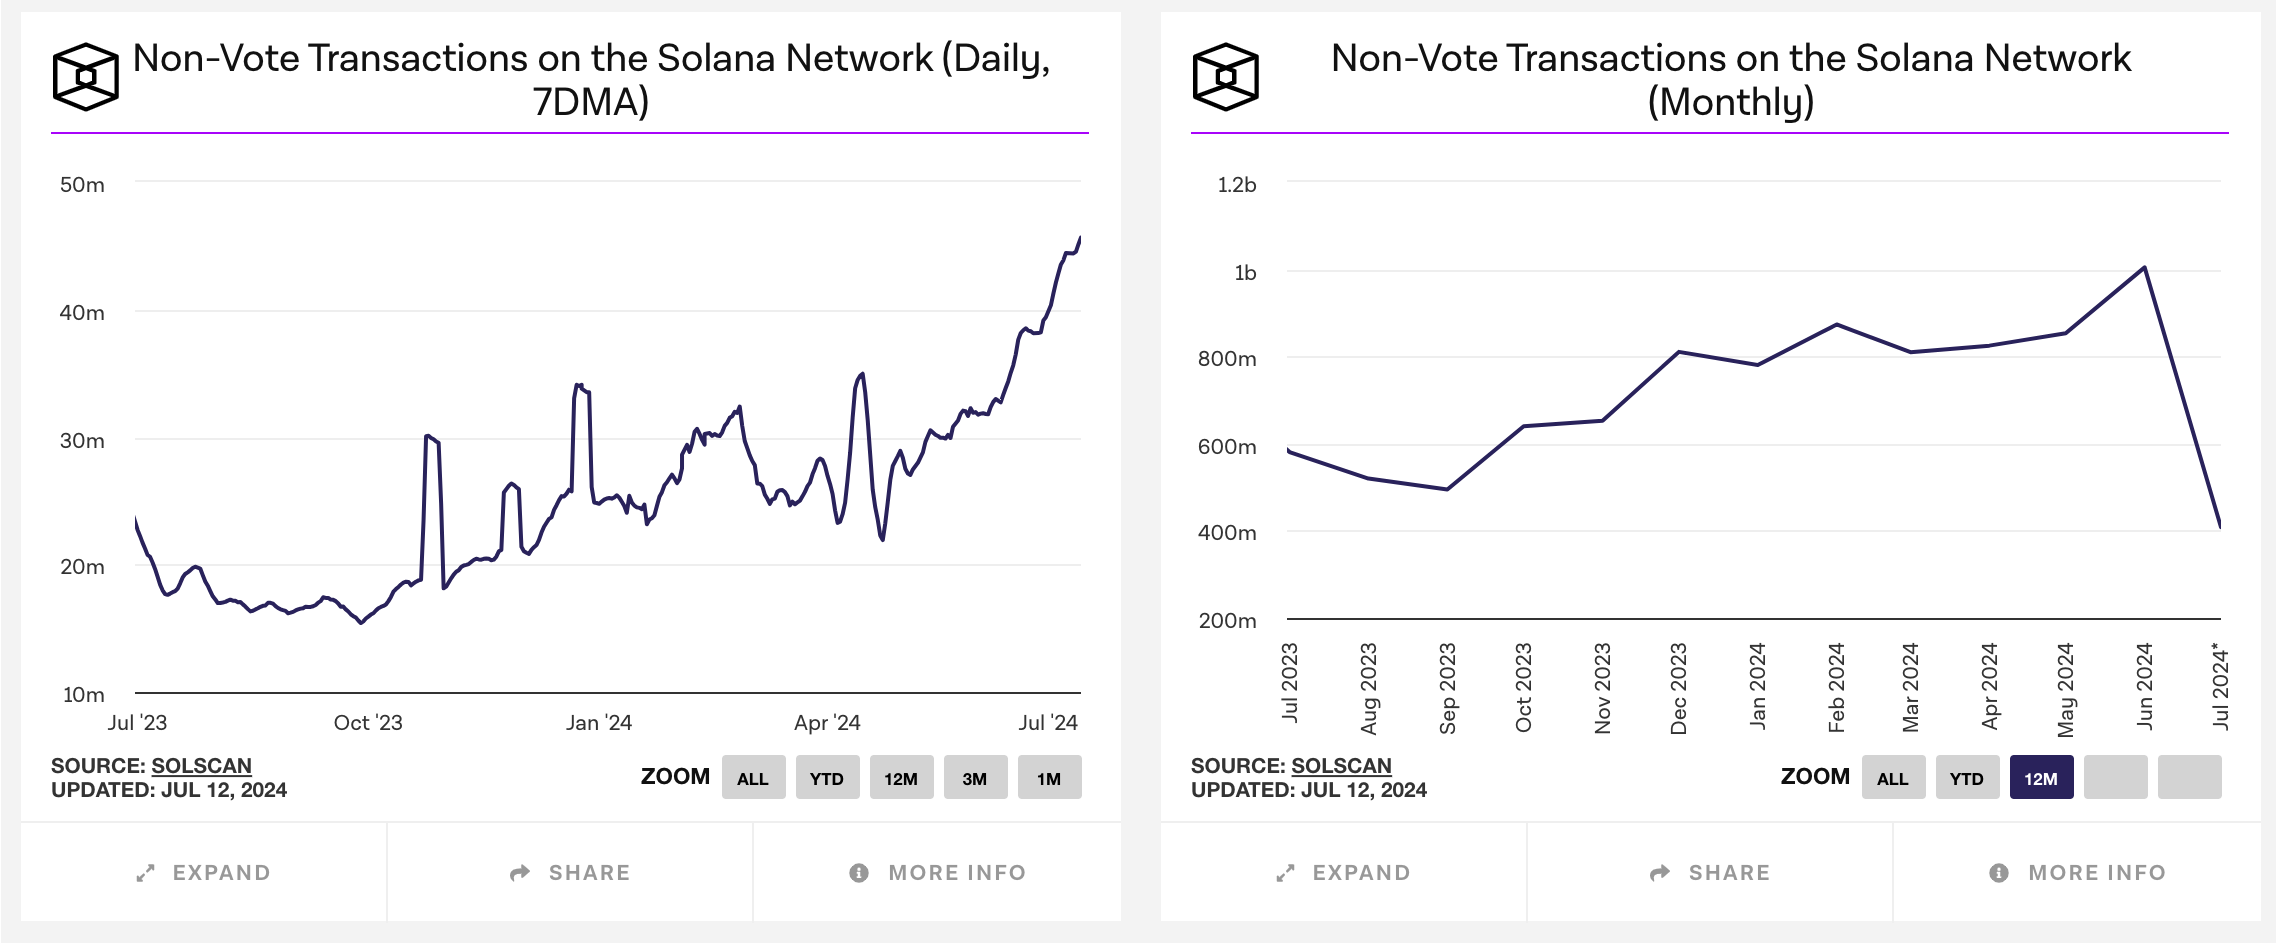
Solana’s on-chain data defies bearish technical indicators image 0 Source: The Block

The number of active addresses on Solana has also increased sharply. Daily active addresses have hit around 2 million, so more users are adopting Solana. 

Monthly active addresses mirror this trend, reaching about 60 million. The increase in fees, despite Solana’s low-cost transactions, shows a dramatic uptick in transaction volume and network usage. 

Priority fees, in particular, have seen huge spikes, reflecting urgent transactions, while standard transactions continue to make up for a huge part of the fee structure. The bulls have slightly more power than the bears, per the on-chain data.
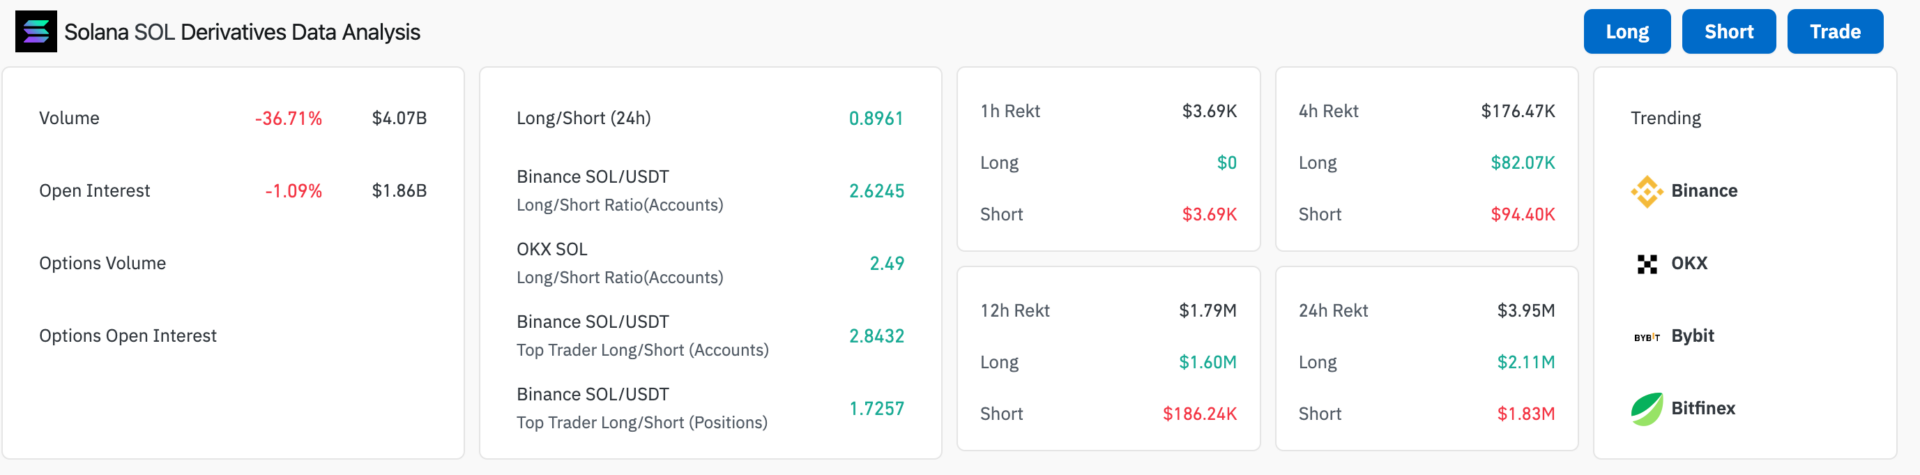
Solana’s on-chain data defies bearish technical indicators image 1 Source: Coinglass

SOL’s derivatives data show us a notable drop in trading volume and open interest. Trading volume has decreased by 36.71%, standing at $4.07 billion, while open interest is down by 1.09%, at $1.86 billion. 

There has been reduced trading activity, possibly due to recent market volatility. Traders are waiting for more market clarity. In the last 24 hours, there have been liquidations of $3.95 million, with $2.11 million in longs and $1.83 million in shorts.

Bearish technicals

Strong though as the on-chain data might be, SOL’s trading chart is as bearish as it gets. The 50-day moving average, currently at $149.19, is a short-term resistance level. The 200-day moving average is at $138.33. 

SOL’s price is currently trading below the 50-day moving average but hovers around the 200-day moving average, suggesting support at this level.

The MACD line is at 0.60 and the signal line at -2.23, resulting in a negative histogram value of -2.83.
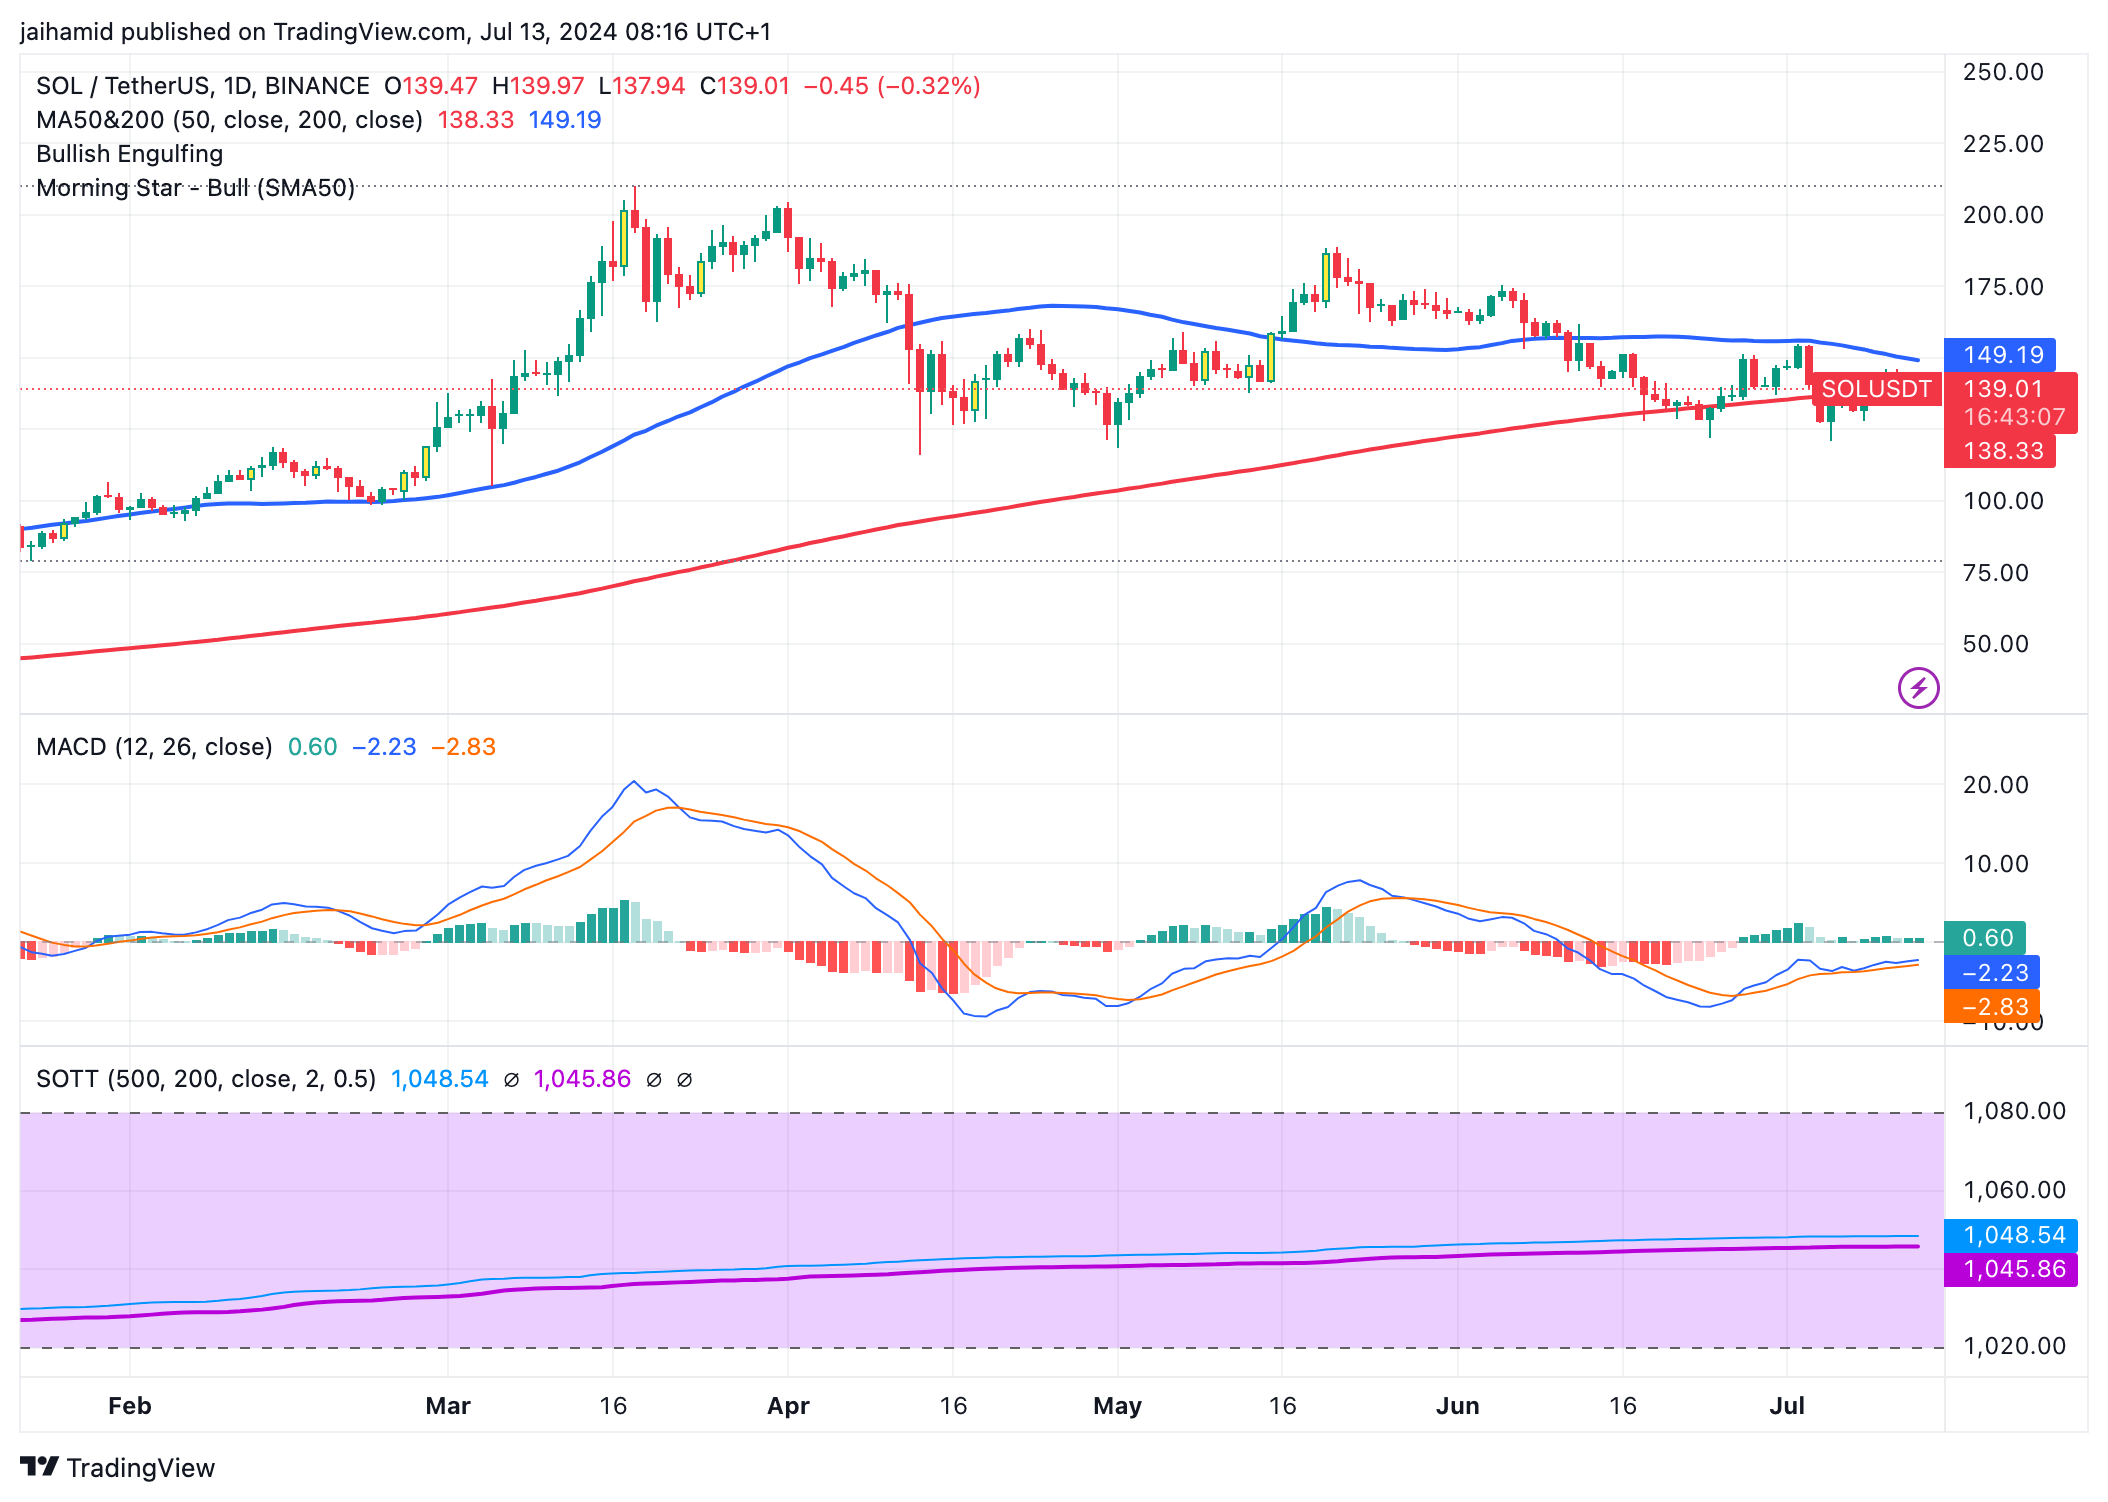
Solana’s on-chain data defies bearish technical indicators image 2 Source: TradingView

This setup means a bullish crossover is forming, but overall momentum remains bearish.

Also, the SOTT (Sum of Total Turnover) indicator shows stable market turnover, with values at 1048.54 and 1045.86. This stability again tells us that traders are waiting for a clear signal before making any decisive moves.

If the price holds above the 200-day moving average and the MACD crossover materializes, the bulls could indeed reverse the sentiment. At press time, SOL was worth $139.

1

Disclaimer: The content of this article solely reflects the author's opinion and does not represent the platform in any capacity. This article is not intended to serve as a reference for making investment decisions.

PoolX: Earn new token airdrops
Lock your assets and earn 10%+ APR
Lock now!

You may also like

2025 TGE Survival Ranking: Who Will Rise to the Top and Who Will Fall? Complete Grading of 30+ New Tokens, AVICI Dominates S+

The article analyzes the TGE performance of multiple blockchain projects, evaluating project performance using three dimensions: current price versus all-time high, time span, and liquidity-to-market cap ratio. Projects are then categorized into five grades: S, A, B, C, and D. Summary generated by Mars AI This summary was generated by the Mars AI model, and the accuracy and completeness of its content are still being iteratively updated.

MarsBit2025/11/28 16:26
2025 TGE Survival Ranking: Who Will Rise to the Top and Who Will Fall? Complete Grading of 30+ New Tokens, AVICI Dominates S+

Mars Finance | "Machi" increases long positions, profits exceed 10 million dollars, whale shorts 1,000 BTC

Russian households have invested 3.7 billion rubles in cryptocurrency derivatives, mainly dominated by a few large players. INTERPOL has listed cryptocurrency fraud as a global threat. Malicious Chrome extensions are stealing Solana funds. The UK has proposed new tax regulations for DeFi. Bitcoin surpasses $91,000. Summary generated by Mars AI. The accuracy and completeness of this summary are still being iteratively updated by the Mars AI model.

MarsBit2025/11/28 16:26
Mars Finance | "Machi" increases long positions, profits exceed 10 million dollars, whale shorts 1,000 BTC

How much is ETH really worth? Hashed provides 10 different valuation methods in one go

After taking a weighted average, the fair price of ETH exceeds $4,700.

ForesightNews 速递2025/11/28 15:05
How much is ETH really worth? Hashed provides 10 different valuation methods in one go

Dragonfly partner: Crypto has fallen into financial cynicism, and those valuing public blockchains with PE ratios have already lost

People tend to overestimate what can happen in two years, but underestimate what can happen in ten years.

深潮2025/11/28 14:53
Dragonfly partner: Crypto has fallen into financial cynicism, and those valuing public blockchains with PE ratios have already lost