Bitcoin Price Consolidates Above $70K As Bulls Prepare For More Gains
Bitcoin price is consolidating gains above the $70,000 resistance zone. BTC could rally again if there is a move above the $71,500 resistance in the near term.
- Bitcoin price moved in a positive zone above the $66,500 level.
- The price is trading above $70,000 and the 100 hourly Simple moving average.
- There is a key bullish trend line forming with support at $68,500 on the hourly chart of the BTC/USD pair (data feed from Kraken).
- The pair could start another increase if it clears the $71,500 resistance zone.
Bitcoin Price Regains Strength
Bitcoin price started a decent increase above the $68,800 resistance zone. BTC climbed higher above the $69,500 and $70,000 resistance levels. Finally, the price tested the $71,500 resistance zone.
A new weekly high was formed near $71,557 and the price is now consolidating gains. There was a minor decline below the 23.6% Fib retracement level of the upward move from the $66,811 swing low to the $71,557 high. However, the price remained stable above $69,000.
Bitcoin is now trading above $70,000 and the 100 hourly Simple moving average . There is also a key bullish trend line forming with support at $68,500 on the hourly chart of the BTC/USD pair. The trend line is close to the 61.8%% Fib retracement level of the upward move from the $66,811 swing low to the $71,557 high.
Immediate resistance is near the $70,800 level. The first major resistance could be $71,500. If there is a clear move above the $71,500 resistance zone, the price could continue to gain strength. In the stated case, the price could even clear the $72,500 resistance zone in the near term. The next key resistance sits at $73,500.
Another Decline In BTC?
If Bitcoin fails to rise above the $71,500 resistance zone, it could start another decline. Immediate support on the downside is near the $70,000 level.
The first major support is $69,000. The next support sits at $68,500 and the trend line. If there is a close below $68,500, the price could start a drop toward the $67,000 level and the 100 hourly SMA. Any more losses might send the price toward the $66,000 support zone in the near term.
Technical indicators:
Hourly MACD – The MACD is now losing pace in the bullish zone.
Hourly RSI (Relative Strength Index) – The RSI for BTC/USD is now above the 50 level.
Major Support Levels – $68,500, followed by $67,000.
Major Resistance Levels – $70,500, $71,500, and $73,500.
Disclaimer: The content of this article solely reflects the author's opinion and does not represent the platform in any capacity. This article is not intended to serve as a reference for making investment decisions.
You may also like
Bitcoin security reaches a historic high, but miner revenue drops to a historic low. Where will mining companies find new sources of income?
The current paradox of the Bitcoin network is particularly striking: while the protocol layer has never been more secure due to high hash power, the underlying mining industry is facing pressure from capital liquidation and consolidation.

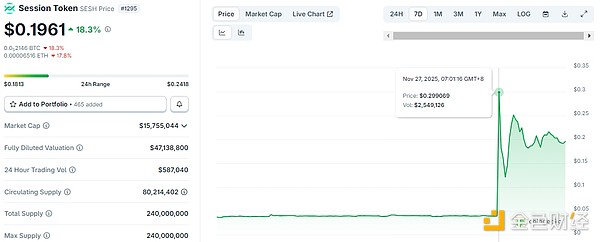
What are the privacy messaging apps Session and SimpleX donated by Vitalik?
Why did Vitalik take action? From content encryption to metadata privacy.

The covert war escalates: Hyperliquid faces a "kamikaze" attack, but the real battle may have just begun
The attacker incurred a loss of 3 million in a "suicidal" attack, but may have achieved breakeven through external hedging. This appears more like a low-cost "stress test" targeting the protocol's defensive capabilities.