
Will Bitcoin Drop Below $40K or is a Major Bounce in Play? (BTC Price Analysis)

Bitcoin’s price has been rallying aggressively, breaking past several resistance levels with ease. Yet, the market is once again consolidating, and a correction might be on the cards.
Technical Analysis
By TradingRage
Bitcoin Price Analysis: The Daily Chart
On the daily chart, the price has clearly been bullish over the past few weeks, making higher highs and lows. Yet, the rally has seemingly come to a halt, and the price is moving sideways above the $40K mark.
While the $40K level is holding firm, a deeper correction might occur, and the price could drop to $38K or even toward the 200-day moving average, located around the $32K mark.
However, as the market is yet to make a lower low and the relative strength index is indicating that the momentum is still bullish, BTC could still reach the critical $48K resistance level before beginning a significant correction.
The 4-Hour Chart
Looking at the 4-hour chart, it becomes clear that the price has been forming a triangle pattern above the $40K mark. If the pattern gets broken to the downside, a drop toward the $38K level could be expected.
On the contrary, a bullish breakout would likely result in a surge toward the $48K level. The relative strength index has also recently risen above the 50% threshold, signaling that a bullish breakout might be more likely.
On-Chain Analysis
By TradingRage
Bitcoin NUPL
Bitcoin’s price has been rapidly rising over the last couple of months, making investors hopeful that a new bull market is on the horizon. Analyzing the on-chain metrics can provide helpful insight into whether that is the case or not.
This chart demonstrates the net unrealized profit/loss (NUPL) metric, which measures the amount of unrealized profits or losses of all market participants. It is evident that following the recent surge in price, many investors are now holding their coins in profit.
This is a logical sign of a bull market. However, the metric has already entered the region previously seen on the last all-time high. This might lead to a profit realization by investors, and subsequently, the resulting supply can push the price back lower. Therefore, while Bitcoin might be on its way to making a new all-time high, this might not be a good time to enter the market as a correction may occur in the short term.
Disclaimer: The content of this article solely reflects the author's opinion and does not represent the platform in any capacity. This article is not intended to serve as a reference for making investment decisions.
You may also like
A decade-long tug-of-war ends: "Crypto Market Structure Bill" sprints to the Senate
At the Blockchain Association Policy Summit, U.S. Senators Gillibrand and Lummis stated that the "Crypto Market Structure Bill" is expected to have its draft released by the end of this week, with revisions and hearings scheduled for next week. The bill aims to establish clear boundaries for digital assets by adopting a classification-based regulatory framework, clearly distinguishing between digital commodities and digital securities, and providing a pathway for exemptions for mature blockchains to ensure that regulation does not stifle technological progress. The bill also requires digital commodity trading platforms to register with the CFTC and establishes a joint advisory committee to prevent regulatory gaps or overlapping oversight. Summary generated by Mars AI. The accuracy and completeness of this summary, generated by the Mars AI model, is still being iteratively updated.

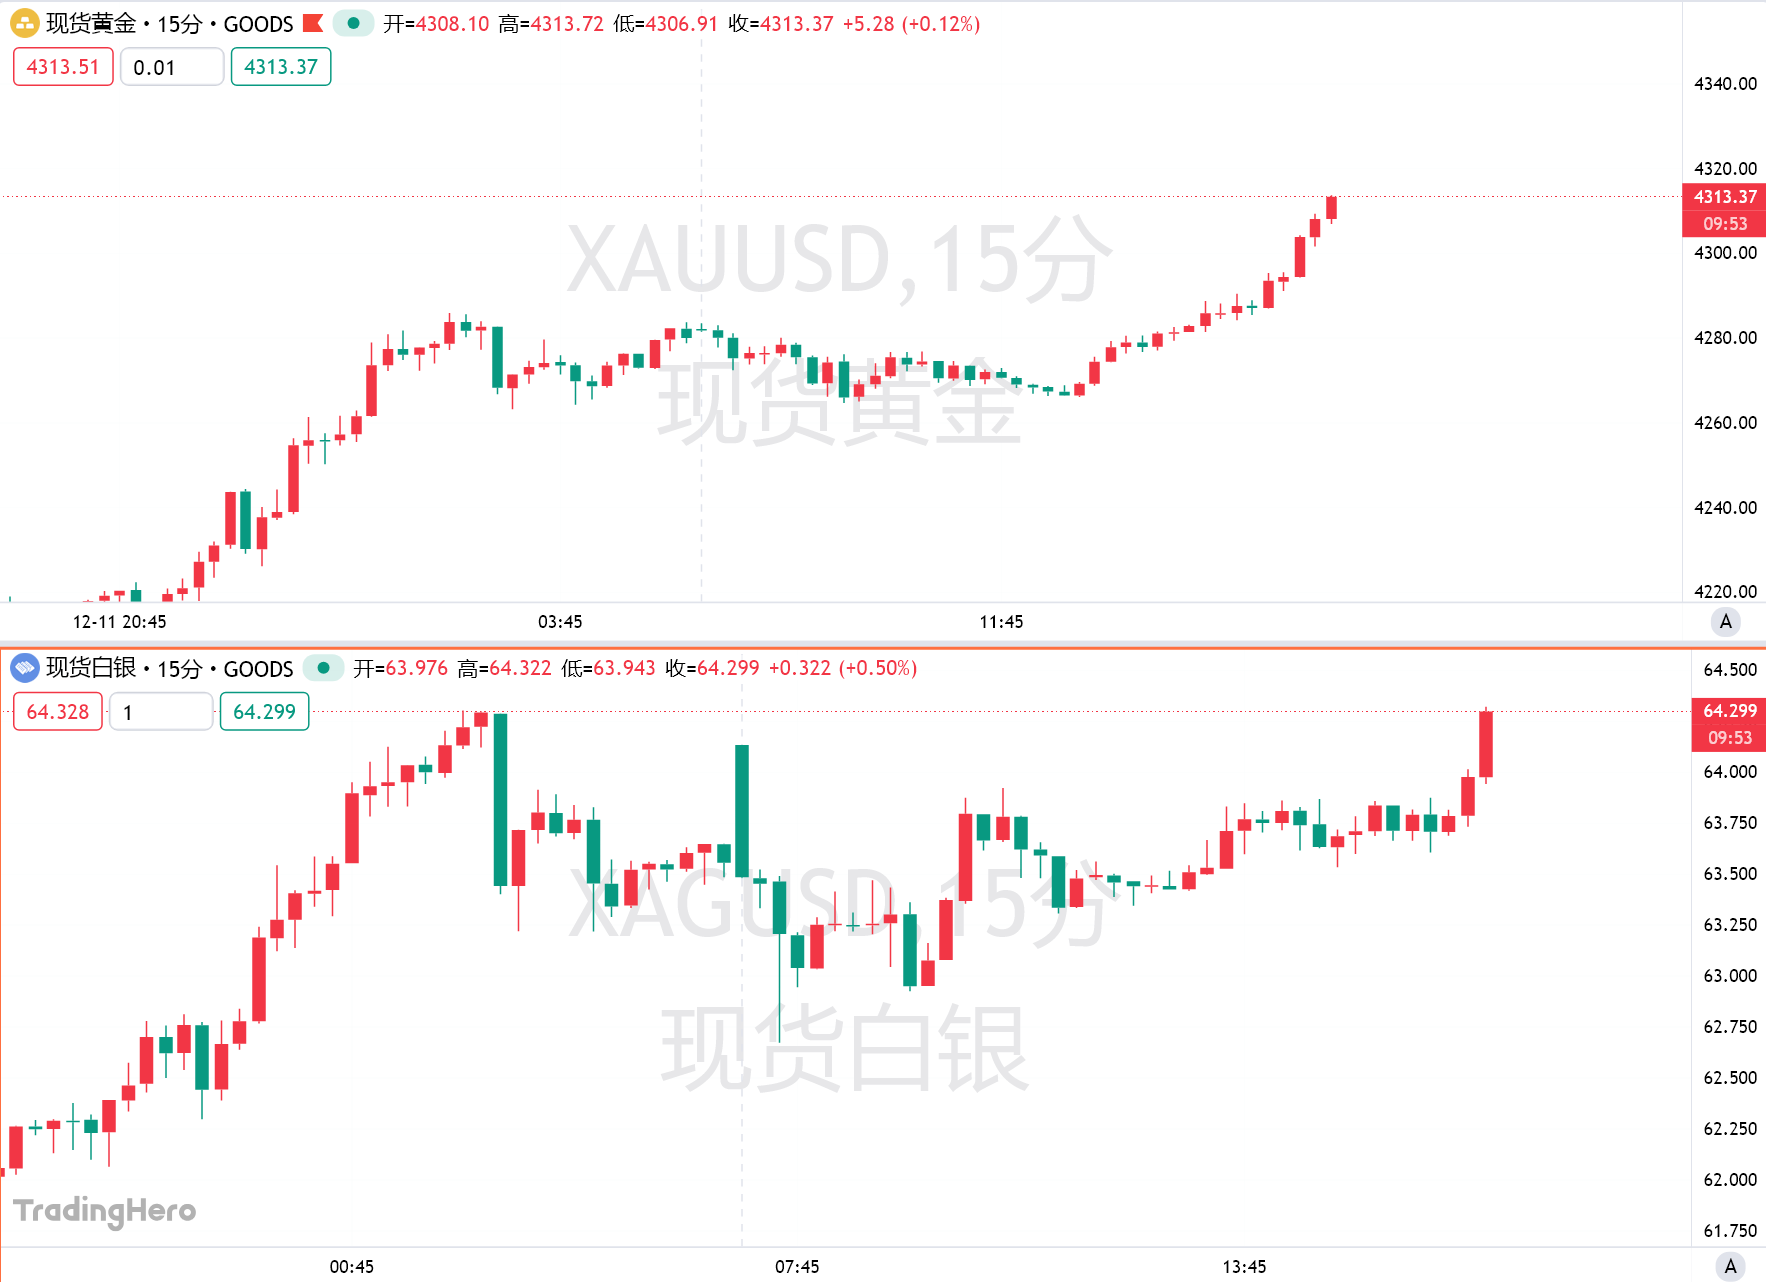
Gold surpasses the $4,310 mark—Is the "bull frenzy" returning?
Boosted by expectations of further easing from the Federal Reserve, gold has risen for four consecutive days. Technical indicators show strong bullish signals, but there remains one more hurdle before reaching a new all-time high.
Trend Research: Why Are We Still Bullish on ETH?
Against the backdrop of relatively accommodative expectations in both China and the US, which suppress asset downside volatility, and with extreme fear and capital sentiment not yet fully recovered, ETH remains in a favorable "buy zone."
