Date: Mon, Dec 29, 2025 | 08:30 AM GMT
The broader cryptocurrency market has kicked off the final week of 2025 on a constructive note, with both Bitcoin (BTC) and Ethereum (ETH) posting gains of over 2%. This steady strength among major assets has helped stabilize market sentiment, creating room for select altcoins — including Sui (SUI) — to develop promising technical structures.
SUI is trading with a modest intraday gain, but more importantly, its price action is beginning to reflect a clear structural shift. The chart suggests that selling pressure is fading and that a potential bullish continuation phase may be forming beneath the surface.
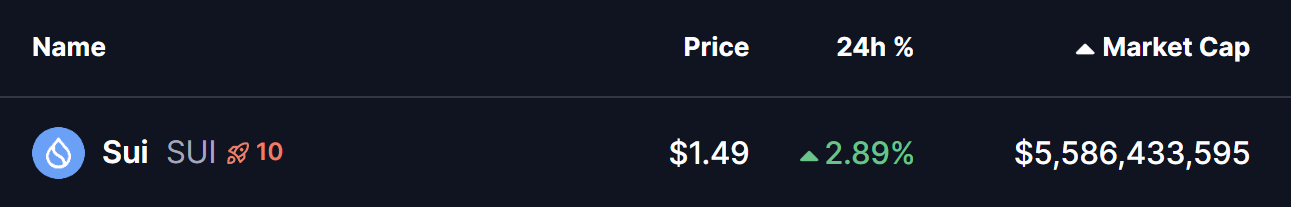 Source: Coinmarketcap
 Bearish Bat Pattern in Play?
On the 4-hour timeframe, SUI appears to be carving out a Bearish Bat harmonic pattern. Despite its name, this structure often allows for an upside move toward the completion point before any broader trend decision takes place.
The formation started from Point X near the $1.728 area, followed by a sharp decline into Point A. Price then staged a recovery toward Point B before undergoing a deeper corrective move into Point C around $1.35. This region acted as a strong demand zone, where buyers consistently stepped in to absorb selling pressure.
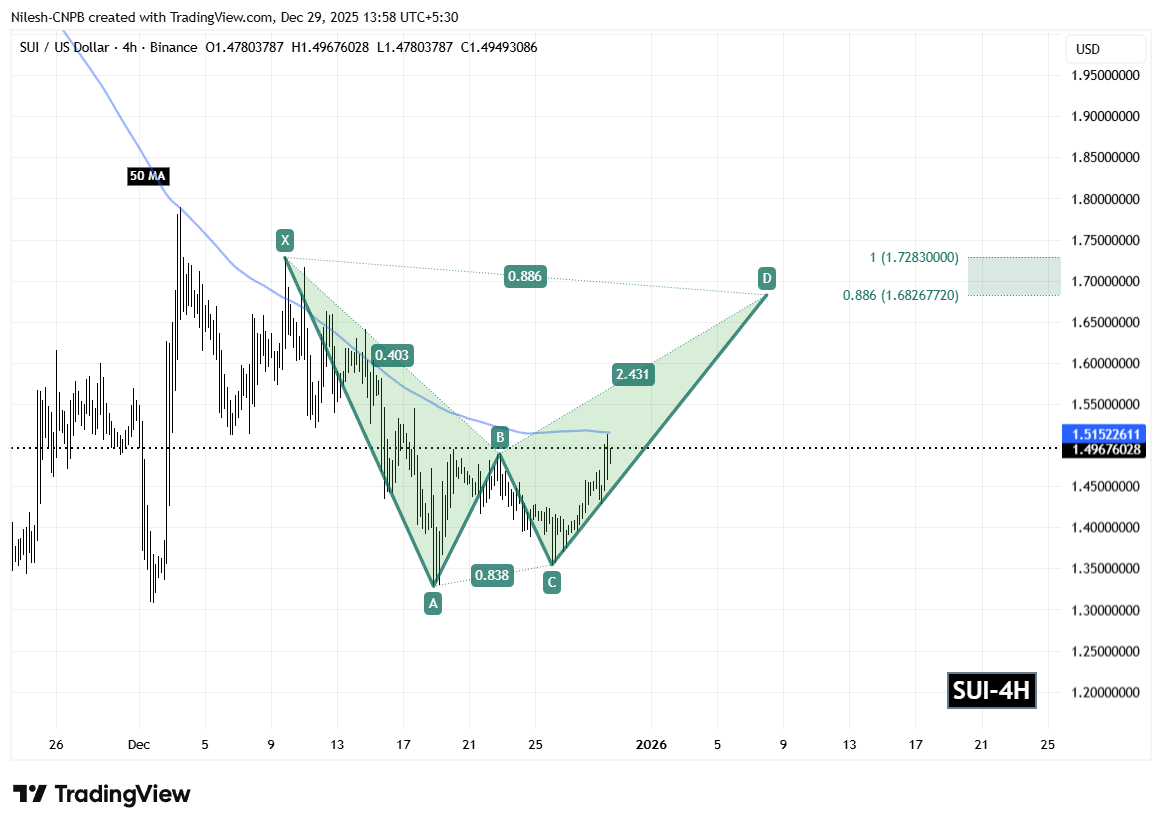 Sui (SUI) 4H Chart/Coinsprobe (Source: Tradingview)
 Since printing the Point C low, SUI has shown steady recovery behavior and is currently trading around the $1.49 level. This rebound highlights waning bearish momentum and growing buyer confidence at lower prices.
Adding further technical weight to the setup, the 50-period moving average on the 4-hour chart is positioned near $1.51. A decisive reclaim and sustained hold above this level would reinforce bullish momentum and validate the ongoing recovery structure.
What’s Next for SUI?
If buyers continue to defend the $1.43 support zone and successfully flip the 50-hour moving average into support, the harmonic structure suggests a continuation move toward the Potential Reversal Zone (PRZ).
Based on Fibonacci projections, the PRZ lies between $1.6826 (0.886 extension) and $1.7283 (1.0 extension). This zone represents a potential upside of roughly 15% from current levels and aligns closely with classic harmonic completion targets, where price reactions often intensify.
For now, SUI’s technical outlook remains constructive. As long as support holds and momentum continues to build, the harmonic pattern indicates that the next meaningful move may favor the upside, positioning SUI for a test of higher resistance zones in the sessions ahead.
Disclaimer
About Author