Bitget App
Trade smarter
MarketsTradeFuturesEarnSquareMore
Aster (ASTER) Dips To Test Key Support — Could This Pattern Trigger an Rebound?

Aster (ASTER) Dips To Test Key Support — Could This Pattern Trigger an Rebound?

CoinsProbeCoinsProbe2025/12/15 19:33
By:Nilesh Hembade

Date: Mon, Dec 15, 2025 | 06:20 PM GMT

The cryptocurrency market continues to face heavy selling pressure as both Bitcoin (BTC) and Ethereum (ETH) dropped more than 4.50% over the past 24 hours. This sharp correction sparked heightened volatility across the market, triggering over $618 million in liquidations , with long positions absorbing the bulk of the damage.

Altcoins have not been spared from the selloff, and Aster (ASTER) is no exception. The token has slipped more than 10% during the downturn. However, beneath the surface, ASTER’s price structure is beginning to reveal a potentially bullish setup that could hint at a recovery attempt if key levels continue to hold.

Aster (ASTER) Dips To Test Key Support — Could This Pattern Trigger an Rebound? image 0 
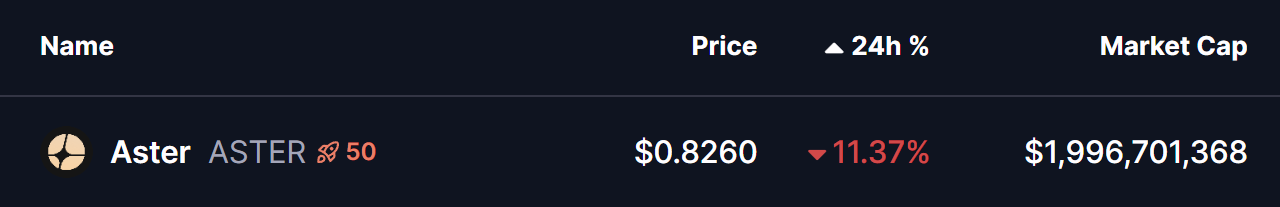
Source: Coinmarketcap

Double Bottom Pattern in Focus

On the daily chart, ASTER appears to be forming a classic double-bottom structure, a pattern that often signals seller exhaustion and a possible trend reversal. The token has remained under pressure since mid-November, following a failed breakout above the $1.4073 neckline resistance. That rejection led to a sharp decline of nearly 42%, dragging price back toward the critical $0.80–$0.81 support zone.

Notably, this area has already acted as a strong demand region in the past. The chart now shows price revisiting this same zone, where buyers are once again stepping in. If this level continues to hold, the current pullback may represent the second bottom of the emerging double-bottom formation — a key ingredient needed for a bullish reversal.

Aster (ASTER) Dips To Test Key Support — Could This Pattern Trigger an Rebound? image 1 
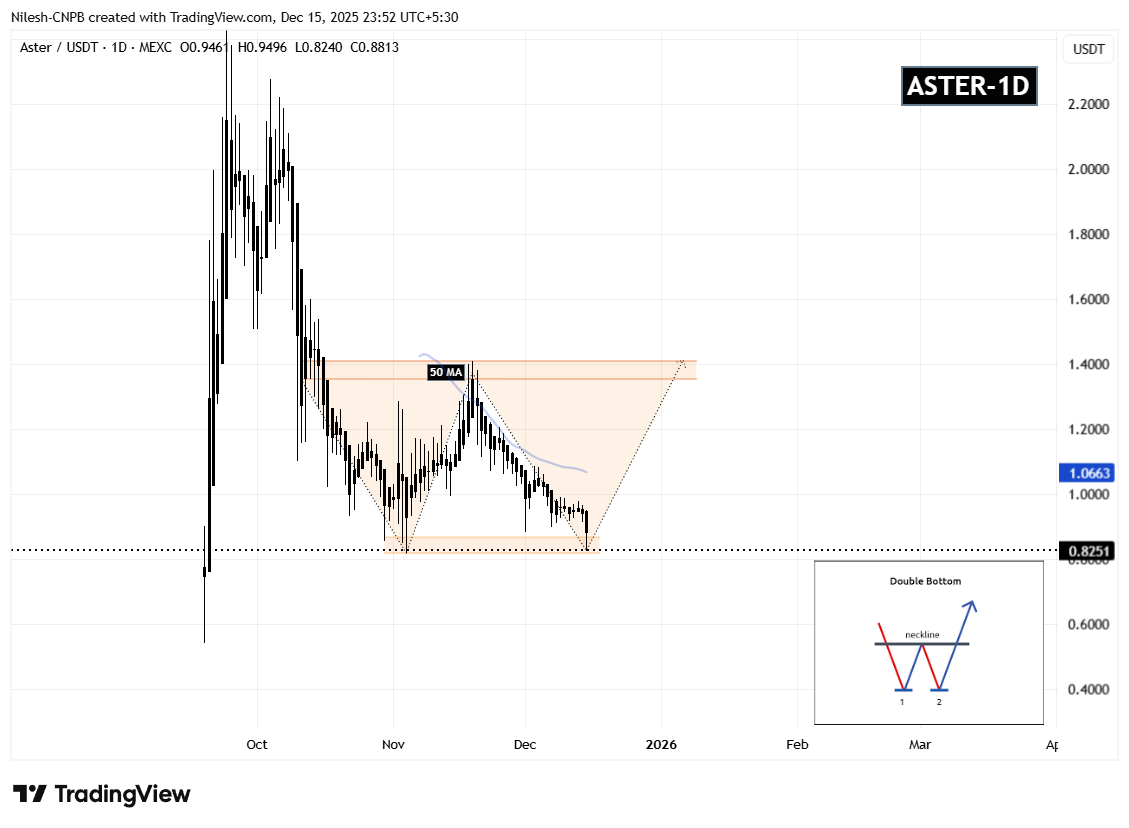
ASTER Daily Chart/Coinsprobe (Source: Tradingview)

What’s Next for ASTER?

The importance of the $0.80–$0.81 support cannot be overstated. Sustained defense of this zone keeps the bullish structure intact and allows momentum to gradually rebuild. The first major upside test sits at the 50-day moving average near $1.0663, which has acted as dynamic resistance throughout the recent downtrend.

A successful reclaim of this moving average would be an early confirmation that buyers are regaining control. In that scenario, ASTER could attempt a broader recovery toward the neckline resistance at $1.4073. A decisive breakout above this level would complete the double-bottom pattern and significantly strengthen the bullish outlook.

On the downside, a daily close below the $0.80 support would invalidate the setup, exposing ASTER to deeper downside risk and delaying any meaningful recovery attempt.

For now, repeated reactions from the same demand zone suggest that selling pressure is weakening. While confirmation is still needed, the chart structure indicates that ASTER may be approaching a critical turning point, with the next few sessions likely to define its short-term direction.

0
0

Disclaimer: The content of this article solely reflects the author's opinion and does not represent the platform in any capacity. This article is not intended to serve as a reference for making investment decisions.

You may also like

The Rise of CFTC-Regulated Clean Energy Markets: Opening a New Chapter for Institutional Investors

- CFTC's 2025 approval of REsurety's CleanTrade as a SEF marks a landmark shift in clean energy markets by introducing standardized, transparent trading for VPPAs and RECs. - The platform attracted $16B in notional value within two months, enabling rapid institutional-grade transactions that previously took months to negotiate. - By addressing liquidity gaps and enabling precise risk modeling, CleanTrade is accelerating capital flows into decarbonization while bridging ESG investment gaps for institutional

Bitget-RWA2025/12/16 04:44
The Rise of CFTC-Regulated Clean Energy Markets: Opening a New Chapter for Institutional Investors

The Increasing Overlap Between Health and Financial Wellbeing in Managing Personal Finances

- Global wellness economy to hit $9 trillion by 2028, driven by holistic well-being trends. - Millennials/Gen Z prioritize wellness as lifestyle, with 55% spending over $100/month on health. - Employers integrate financial wellness into health programs to reduce burnout and boost productivity. - Investors target wellness-driven SaaS, healthcare tech , and financial literacy platforms for holistic solutions.

Bitget-RWA2025/12/16 04:22
The Increasing Overlap Between Health and Financial Wellbeing in Managing Personal Finances

Revealing the Value of Green Gold: The Transformative Impact of Institutional-Grade Platforms on Clean Energy Markets

- Clean energy markets hit $35.42B in 2025 but face VPPA/PPA liquidity gaps as U.S. policy rollbacks raise costs by 11.8% YoY. - REsurety's CleanTrade platform digitizes PPA trading, unlocking $16B in liquidity via CFTC-approved SEF infrastructure within two months. - Strategic S&P Global partnership standardizes PPA/REC valuations, addressing institutional investors' risk management gaps in green energy markets. - While global PPA markets grow at 14.6% CAGR to $9.5B by 2035, U.S. policy uncertainty remain

Bitget-RWA2025/12/16 04:22
Revealing the Value of Green Gold: The Transformative Impact of Institutional-Grade Platforms on Clean Energy Markets
© 2025 Bitget