Stablecoin supply has spiked to bear market levels, suggesting buyers could soon spark another leg up for the Bitcoin ( BTC ) and crypto markets, according to analysts.
Key takeaways:
Bitcoin Stablecoin Supply Ratio at bear market lows signals BTC price bottom.
Rising Binance stablecoin reserves and falling BTC supply indicate a buildup of buyer liquidity.
Bitcoin’s falling wedge breakout targets previous all-time highs at $124,000.
Bitcoin liquidity signals “turning point”
Bitcoin’s stablecoin ratio is at levels that have historically marked bottoms for BTC, according to new analysis.
Stablecoin Supply Ratio (SSR) has dropped back to its “lower historical range (13) — the same zone that marked bottoms in mid-2021, and throughout 2024,” CryptoQuant analyst MorenoDV wrote in a Quicktake analysis, adding:
“Each time, Bitcoin was trading quietly before staging a strong rebound.”
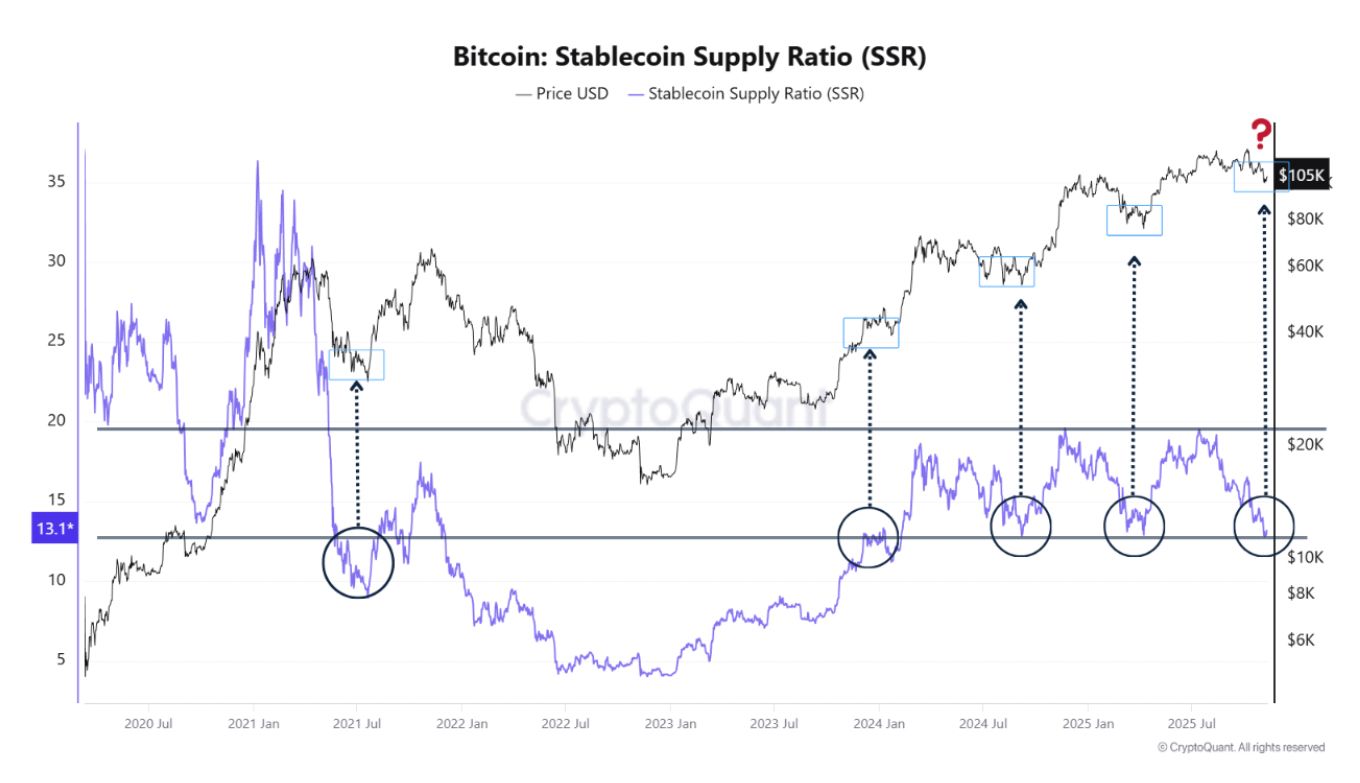 Bitcoin Stablecoin Supply Ratio: Source: CryptoQuant
The low SSR suggests that stablecoin liquidity is quietly building again, potentially setting the stage for a relief rally or the final bullish leg of this cycle.
The Binance Bitcoin/Stablecoin Reserve Ratio (SRR) tells the same story.
Related: Bitcoin price fills CME gap, but ‘$240M market dump’ stops a $104K rebound
The chart below shows that stablecoin reserves on Binance are rising, while BTC reserves are shrinking , “a pattern that, time and again, has occurred right before market recoveries,” the analyst said, adding:
“We’re witnessing a liquidity configuration that has only appeared a handful of times since 2020, and each instance marked a pivotal moment for Bitcoin's trajectory.”
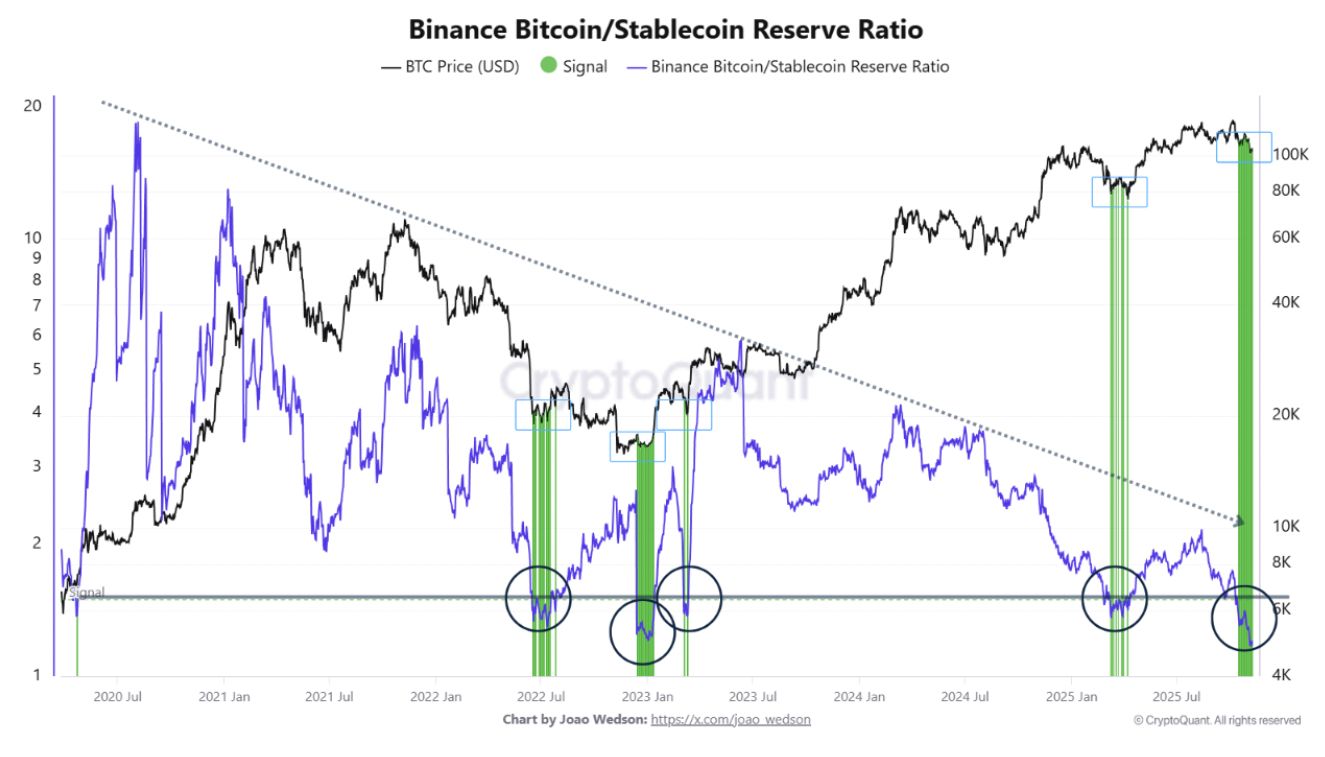 Binance Bitcoin/stablecoin reserve ratio. Source: CryptoQuant
The growing stablecoin supply suggests that there is an increasing amount of sidelined capital that can be deployed into the crypto market.
Historically, this pattern tends to emerge during phases of structural capitulation or seller exhaustion, when weak hands exit and strong hands begin to accumulate quietly.
André Dragosch, the European head of research at investment company Bitwise, shared a chart showing the short-term holder seller exhaustion constant has recorded the lowest value since August 2023.
This metric reaches such levels when volatility is low, but losses realized onchain are high, signaling seller exhaustion.
Similar levels in the past preceded volatility to the upside, with the last one leading to a 190% in BTC price to $74,000 in March 2024 from $25,300 in August 2023.
Sellers exhausted ✅ pic.twitter.com/ROTggxDKfy
— André Dragosch, PhD⚡ (@Andre_Dragosch) November 11, 2025
As Cointelegraph reported , the MVRV ratio (market value to realized value) also suggests that BTC may have bottomed at $98,000 due to seller exhaustion .
Bitcoin’s falling wedge targets $124,000
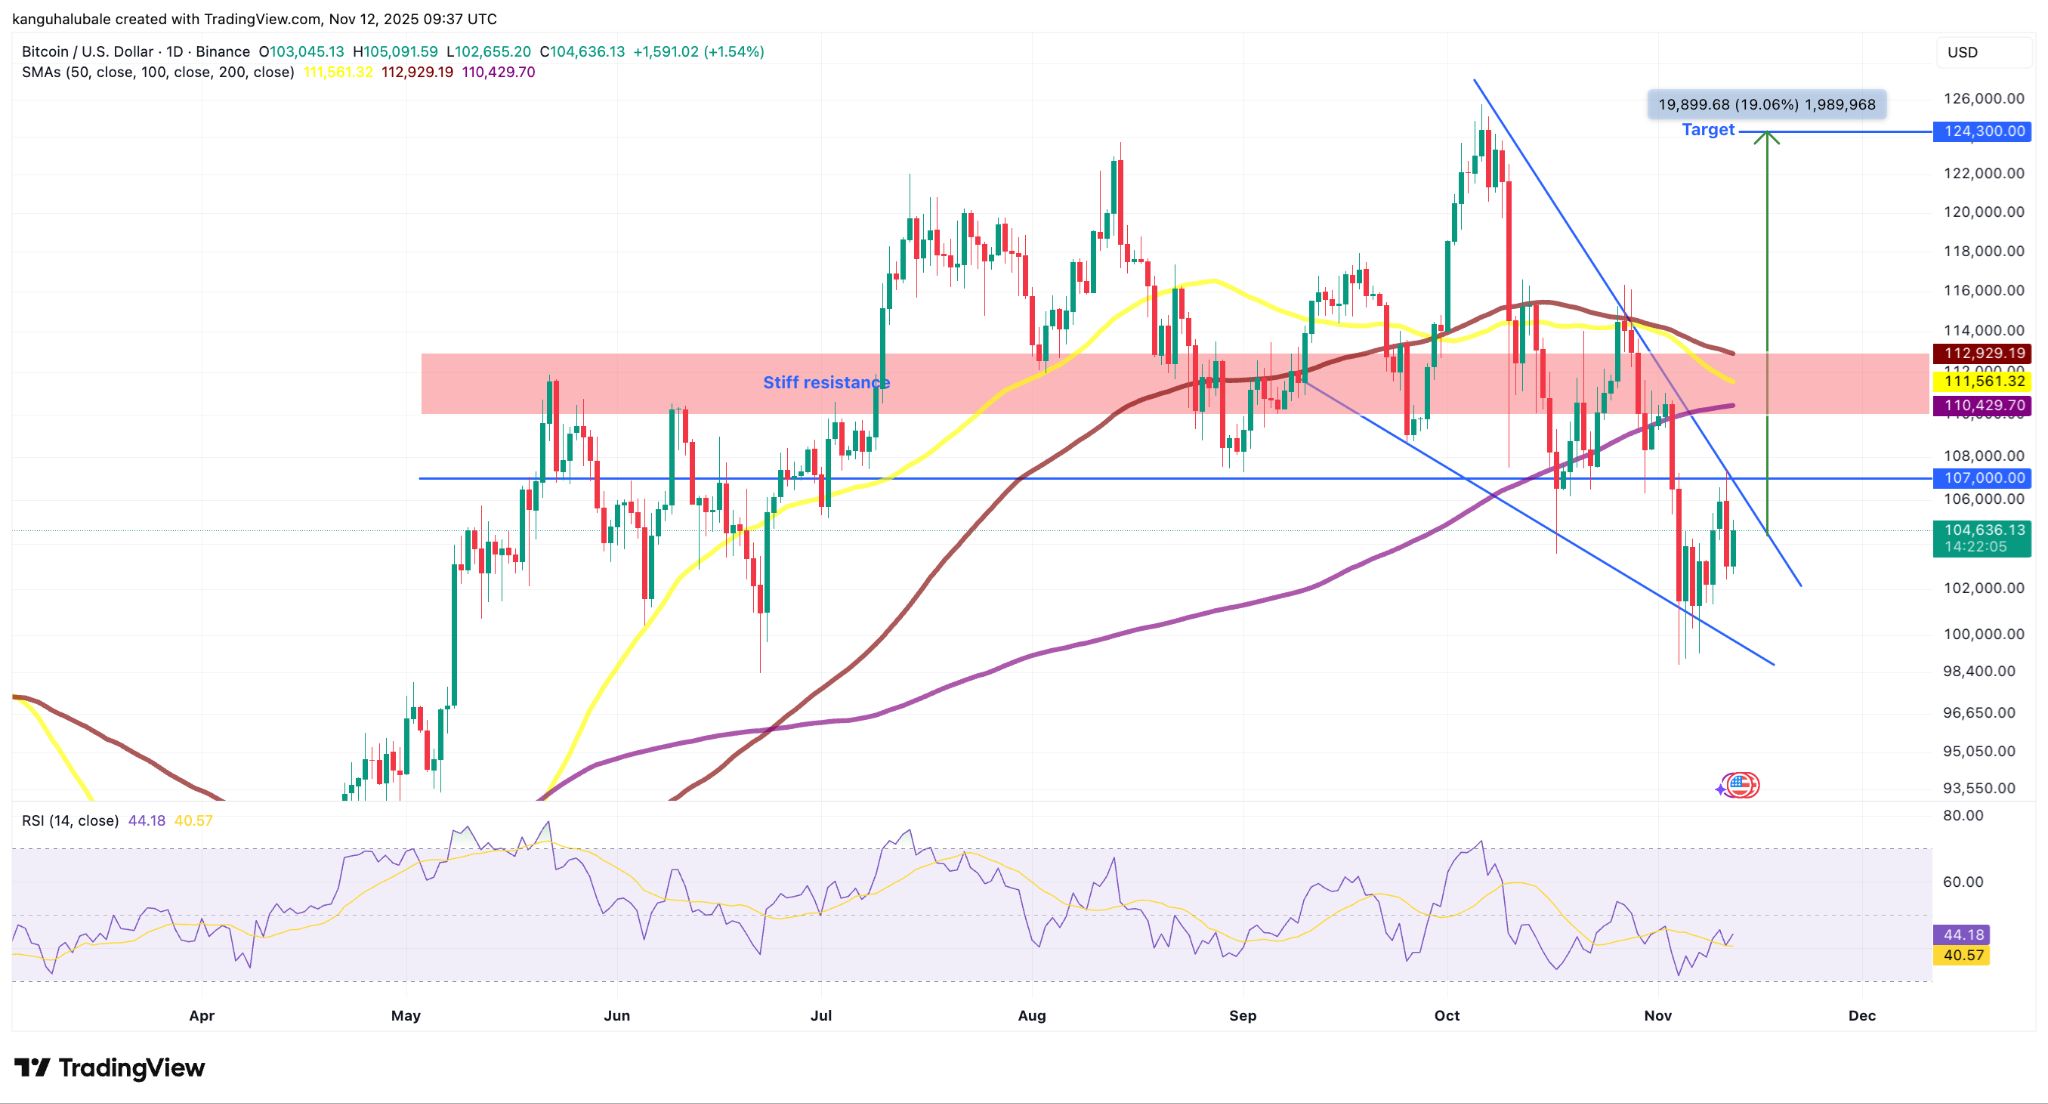
The daily candle chart shows the BTC/USD pair trading within a falling wedge, after the price was rejected from the upper trendline of the pattern at $107,000.
Falling wedges are typically bullish reversal patterns, and BTC’s continued consolidation within the pattern’s trendlines suggests that the downtrend could be nearing its end.
“Bitcoin is trading in this falling wedge,” said analyst Mister Crypto in an X post on Tuesday, adding:
“The breakout is so close now.”
A daily candlestick close above $107,000 will confirm the pattern, clearing the path for Bitcoin’s rise toward the wedge’s bullish target at $124,000, representing a 19% increase from the current price. This coincides with its previous peak reached on Aug. 14 .
 Bitcoin/USD daily chart. Source: Cointelegraph/ TradingView
“The Risk-Off Signal has shifted back to a low-risk regime, showing that selling pressure is easing as Bitcoin recovers,” private wealth manager Swissblock said in its latest BTC analysis, adding:
“BTC now needs to reclaim $108.5K–$110K, confirming recovery as risk stabilizes and goes to 0.”
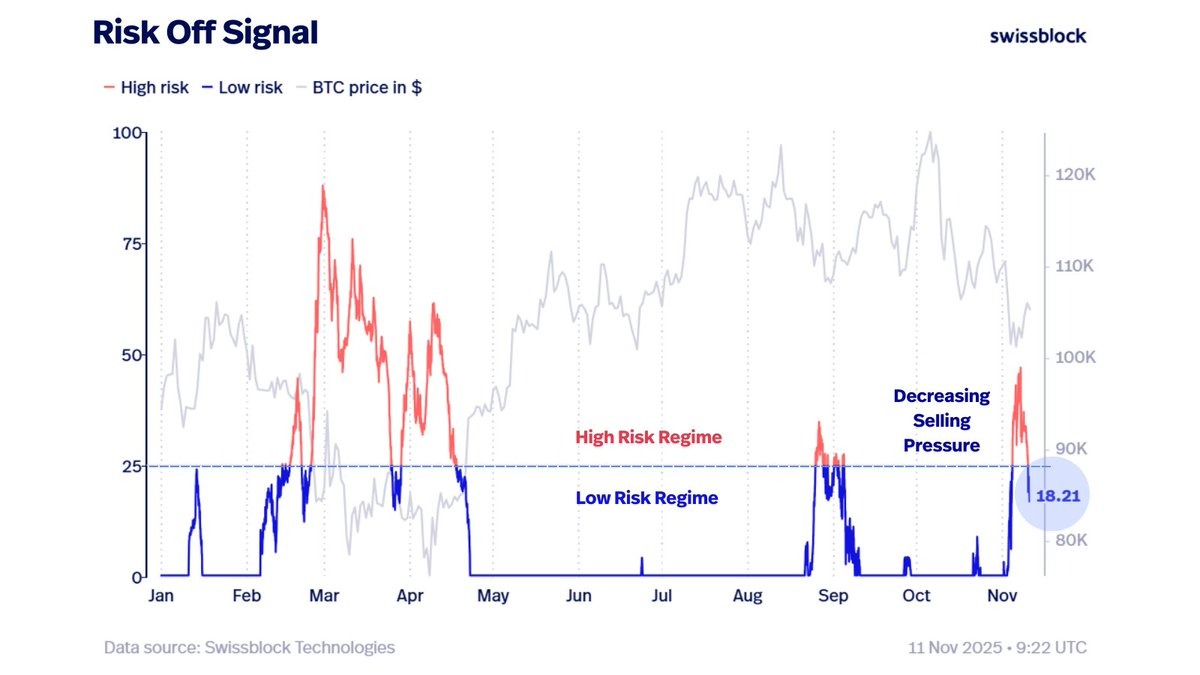 Bitcoin risk-off signal. Source: Swissblock.