XRP falls to key support level as analysts monitor price action: ‘It’s going to get bullish!’

XRP has declined to a critical support level following a 30-day pullback, prompting technical analysis of whether the cryptocurrency can maintain its current price structure.
- XRP has fallen to a key macro support level after a month-long pullback, drawing close attention from technical analysts.
- Momentum indicators such as the RSI are oversold on lower timeframes, increasing the probability of a short-term bounce.
- If XRP holds above this level and avoids setting a new low, the structure would support a bullish continuation with potential upside later in the year.
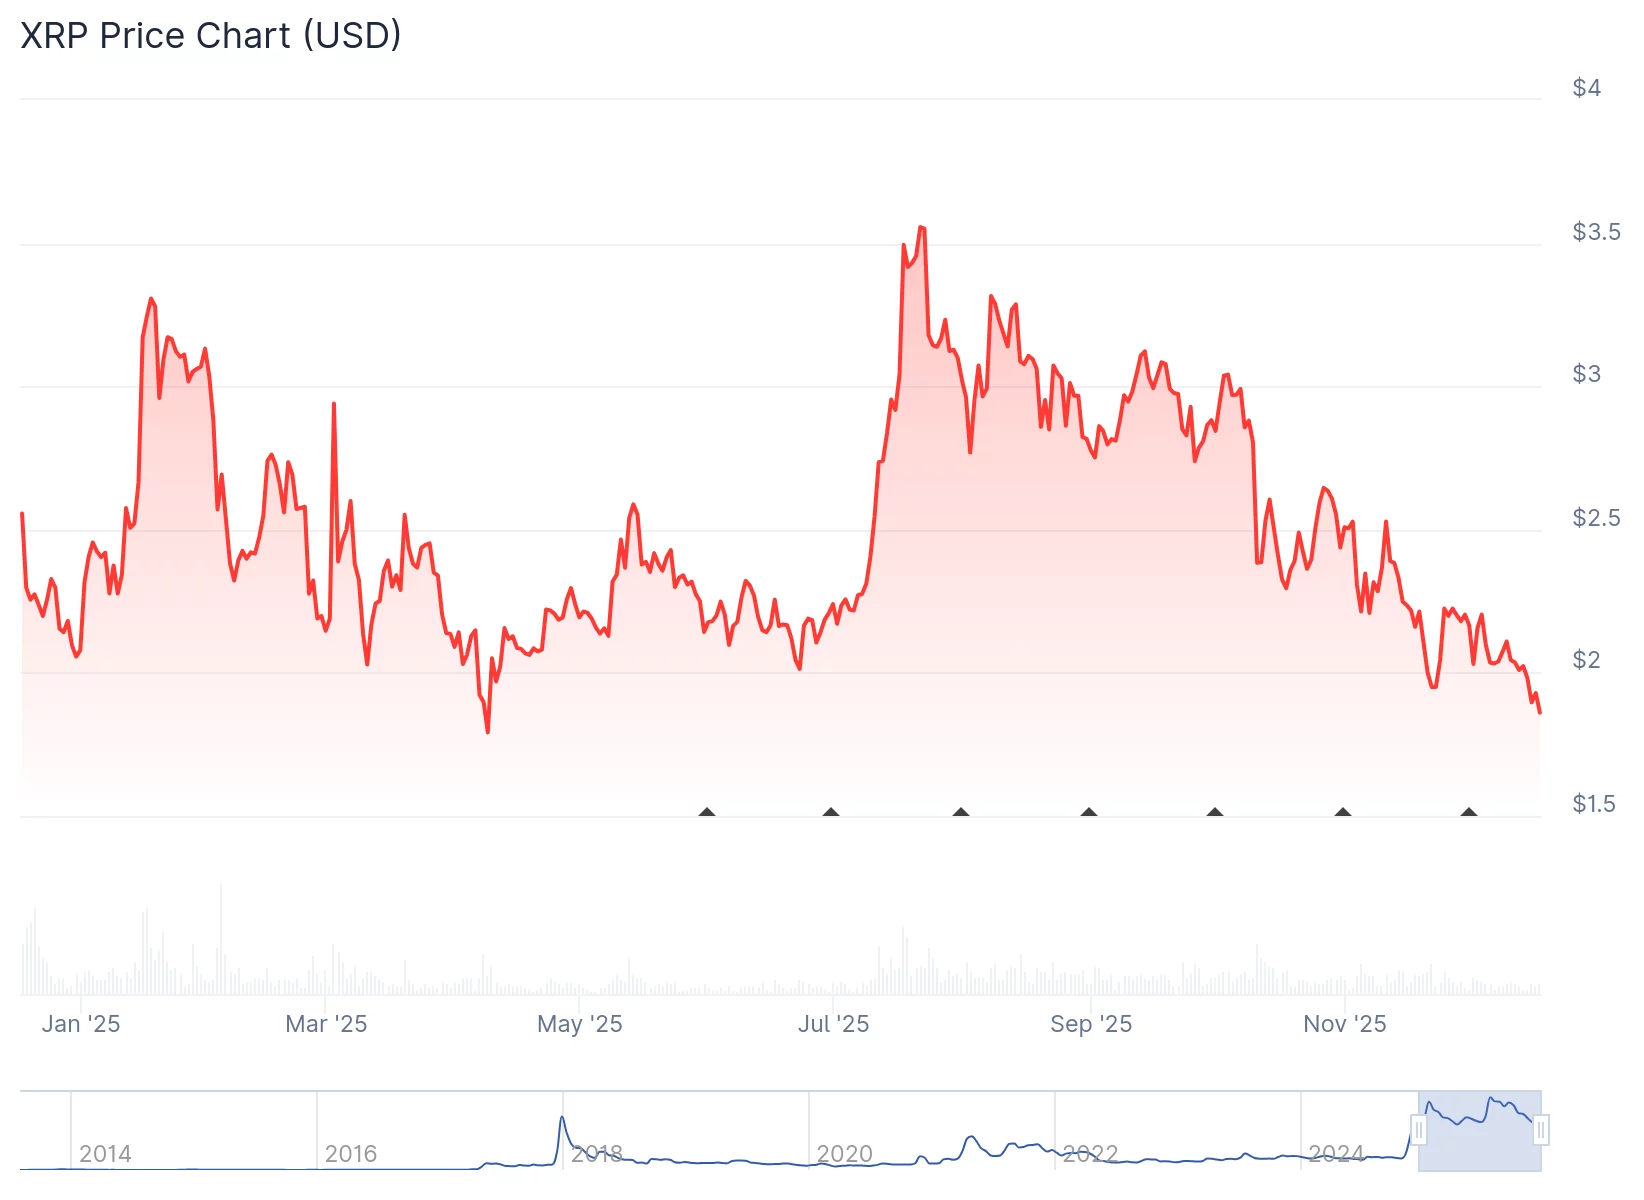
The token reached an intraday low in the past 24 hours, according to data from CoinGecko. Technical analysis indicates that the price has reached a macro support level defined by a 0.5 Fibonacci retracement on higher-timeframe charts.
 Source:
CoinGecko
Source:
CoinGecko
This support zone previously served as a pivot point, including during a bounce on November 21 that pushed the price higher within 48 hours, the analyst noted. Multiple Fibonacci confluences are clustered in the support region, suggesting structural significance to the price level.
The current pullback has proceeded without sharp breakdowns below the support level as of the latest data, with selling momentum appearing to decrease as the price compresses at this zone, according to the technical analysis.
According to crypto analyst Tara, such moments typically generate heightened concern among traders when price sits on support rather than moving away from it. The analyst noted that retesting support is not inherently bearish, as repeated tests can absorb selling pressure and establish conditions for a subsequent bounce.
The analyst emphasized that the token’s reaction at this level carries more significance than the level itself. If XRP holds above the support and avoids establishing a decisive new low, “It’s going to get bullish!” Tara noted.
In that scenario, midterm upside targets could be achieved before the end of the year.
Momentum indicators, including the Relative Strength Index (RSI), have entered oversold territory on the 4-hour candlestick chart, adding to the possibility of a bounce from the support level, the analysis showed.
At press time, the token was showing signs of holding above the support level. However, a breakdown below the current range would invalidate the bullish setup and shift focus to lower retracement areas, according to the technical analysis.
Disclaimer: The content of this article solely reflects the author's opinion and does not represent the platform in any capacity. This article is not intended to serve as a reference for making investment decisions.
You may also like
Hive boosts Paraguay Bitcoin mining as rivals pivot to HPC
CFTC Acting Chief Pham Eyes MoonPay Role Post-Selig Confirmation
Bitcoin Implied Volatility at 45% as Traders Bet on $100K–$120K Rally and Hedge with Puts Near $85K
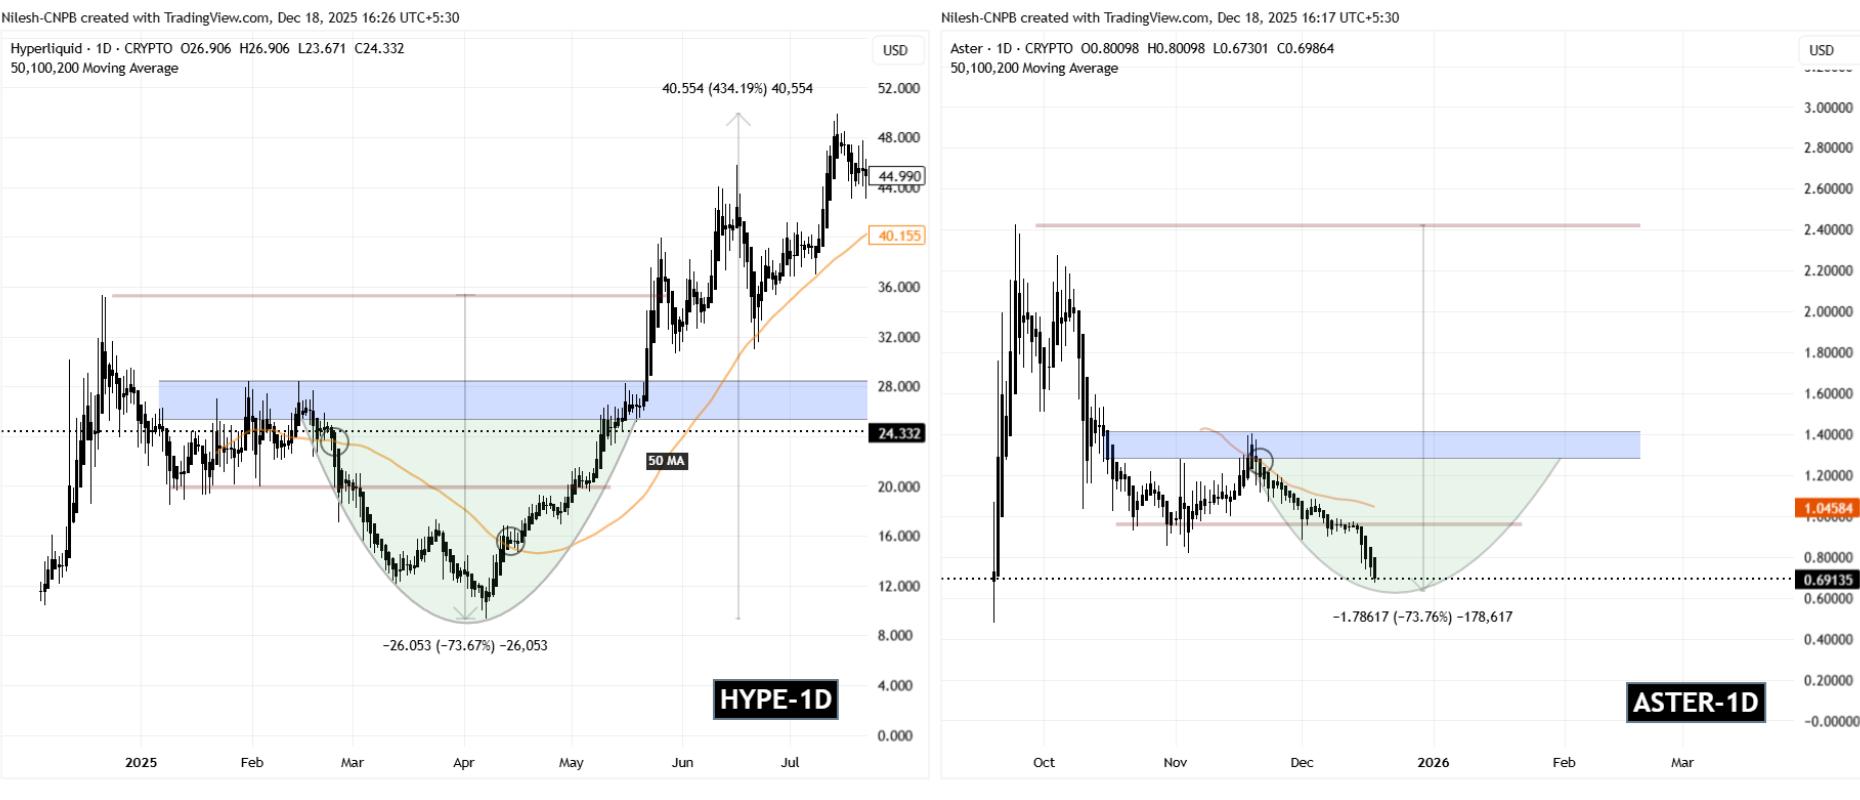
Is Aster ($ASTER) Nearing a Potential Bottom? A Key Emerging Fractal Suggests So!